Sample Category Title
Gold Reaches 11-Month High as Global Demand for Safe Assets Surges
Gold prices surged to an 11-month high, reaching 2,750 USD per troy ounce, a level last seen in November of the previous year. The metal’s rally reflects heightened demand for safe-haven assets amid escalating global trade tensions and a weakening US dollar.
Drivers of Gold’s rise
The growing appetite for Gold comes as fears of global 'trade wars' intensify. Investors seek refuge in safe assets following US President Donald Trump’s announcement of plans to overhaul the country’s tariff policies. The uncertainty surrounding potential escalations with Canada, Mexico, and China has rattled markets. The market eagerly awaits updates on these developments, but for now, the environment is ripe for Gold’s continued appeal.
In addition, Trump recently vowed to impose tariffs on the EU, though specifics remain unclear. The move is perceived as a potential tool for political leverage, raising further risks for global capital markets.
Another factor to watch is US inflation. Trump’s policies were initially expected to drive inflation, which supported the Federal Reserve’s elevated interest rates. While this would typically weigh on Gold, much will depend on the details of forthcoming economic measures.
Technical analysis of XAU/USD
On the H4 chart, XAU/USD formed a consolidation range around 2,689 USD before breaking out upwards to 2,724 USD. After testing 2,689 USD from above, the market resumed its upward movement, breaking through 2,724 USD and advancing towards the next target of 2,761 USD. A correction back to 2,689 USD remains possible in the future. The MACD indicator supports this scenario, with its signal line above the zero level and trending strongly upwards, reflecting bullish momentum.
On the H1 chart, the pair consolidated around 2,724 USD before breaking upwards to continue its growth wave. The immediate target is 2,761 USD and is expected to be reached soon. After hitting this level, a downward wave back to 2,724 USD could emerge, potentially extending to 2,689 USD as part of a correction. The Stochastic oscillator confirms this view, with its signal line above the 80 level but showing signs of preparing for a decline towards 20, indicating potential short-term bearish movement.
Conclusion
Gold’s rise to an 11-month high reflects its renewed safe-haven status amid escalating trade uncertainties and a softer US dollar. Technical indicators point to further gains towards 2,761 USD in the short term, though a correction to levels around 2,724 USD or 2,689 USD remains possible. Broader movements will depend on developments in US trade policy and inflation, with the market keenly focused on updates from Washington.
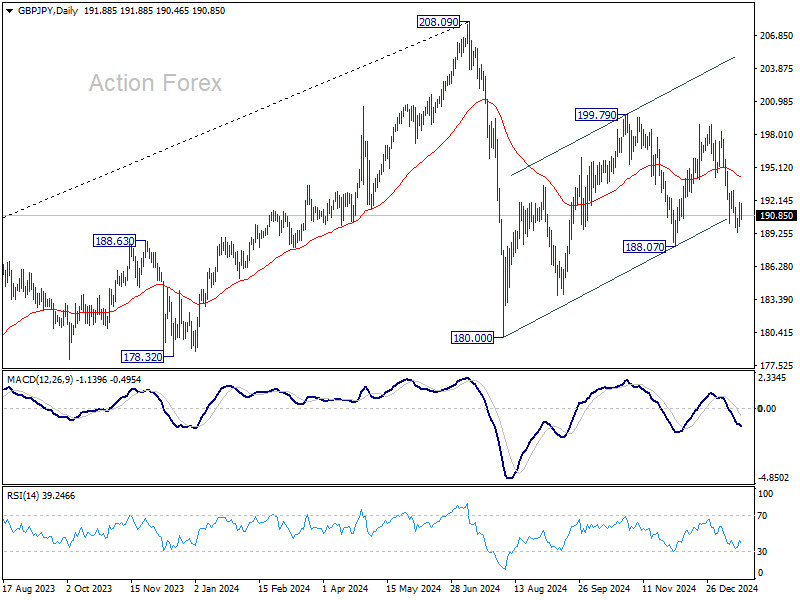
GBP/JPY Daily Outlook
Daily Pivots: (S1) 190.95; (P) 191.57; (R1) 192.67; More...
Intraday bias in GBP/JPY remains neutral as recovery from 189.31 is still capped below 193.01 resistance. Risk continues to stay on the downside. Break of 189.31 will target 188.07 support. Firm break there will argue that corrective pattern from 180.00 has finished too, and larger decline from 208.09 might be ready to resume.
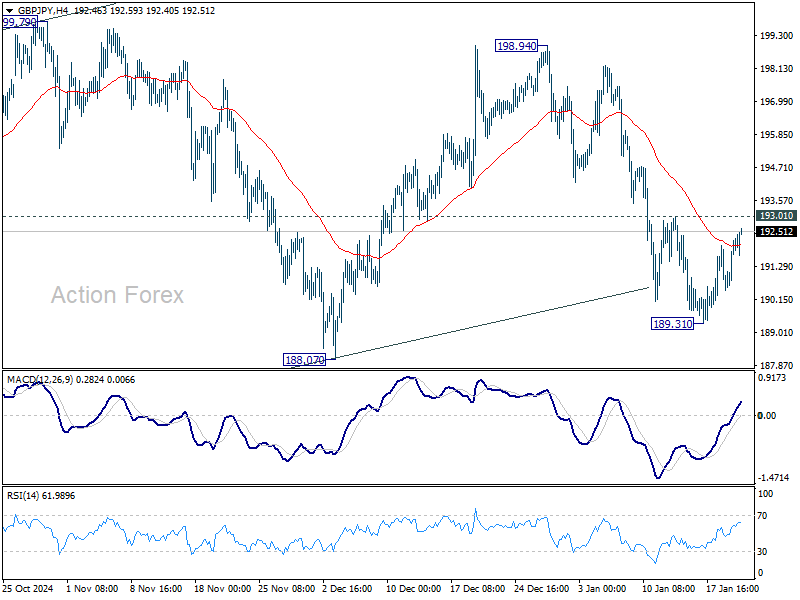
In the bigger picture, price actions from 208.09 are seen as a correction to whole rally from 123.94 (2020 low). The range of consolidation should be set between 38.2% retracement of 123.94 to 208.09 at 175.94 and 208.09. However, decisive break of 175.94 will argue that deeper correction is underway.
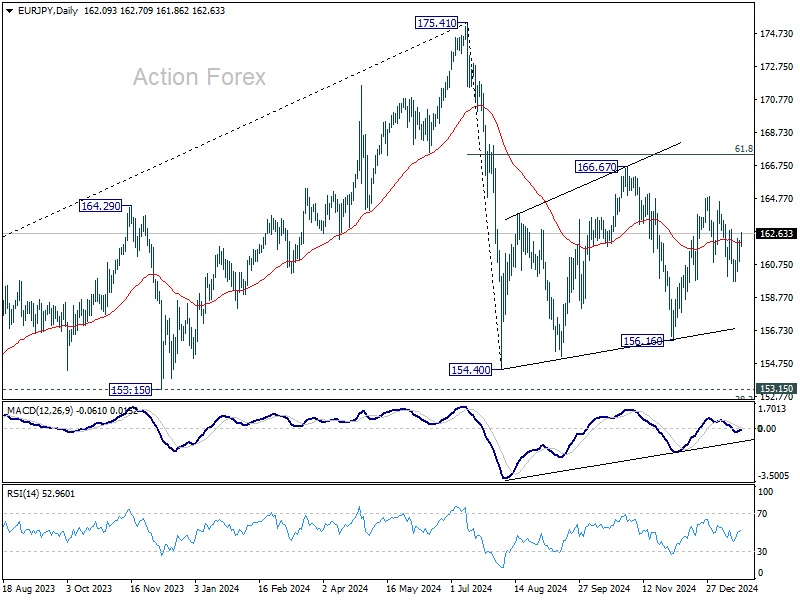
EUR/JPY Daily Outlook
Daily Pivots: (S1) 161.30; (P) 161.77; (R1) 162.57; More...
Intraday bias in EUR/JPY remains neutral as recovery from 159.74 is still capped below 162.88 resistance. Further fall is in favor and break of 159.74 will resume the decline from 164.89 to 156.16 support. On the upside, however, break of 162.88 will bring retest of 164.89 instead.
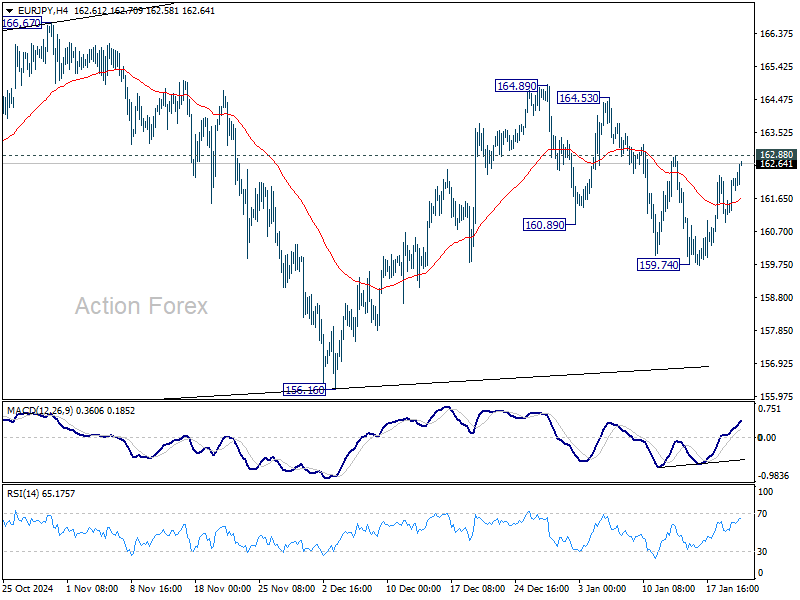
In the bigger picture, price actions from 175.41 are seen as correction to rally from 114.42 (2020 low). The range of consolidation should have been set between 38.2% retracement of 114.42 to 175.41 at 152.11 and 175.41 high. However, decisive break of 152.11 would argue that deeper correction is underway.
EUR/GBP Daily Outlook
Daily Pivots: (S1) 0.8430; (P) 0.8447; (R1) 0.8455; More...
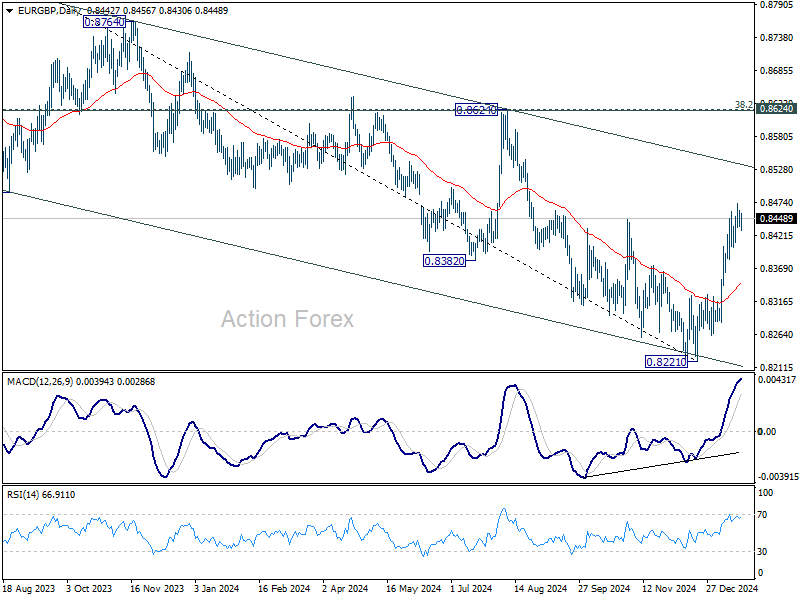
EUR/GBP lost upside momentum as seen in 4H MACD, and intraday bias is turned neutral first. Outlook will stay bullish as long as 0.8403 support holds. Break of 0.8472 temporary top will resume the rally from 0.8221 to 0.8624 key cluster resistance zone next.
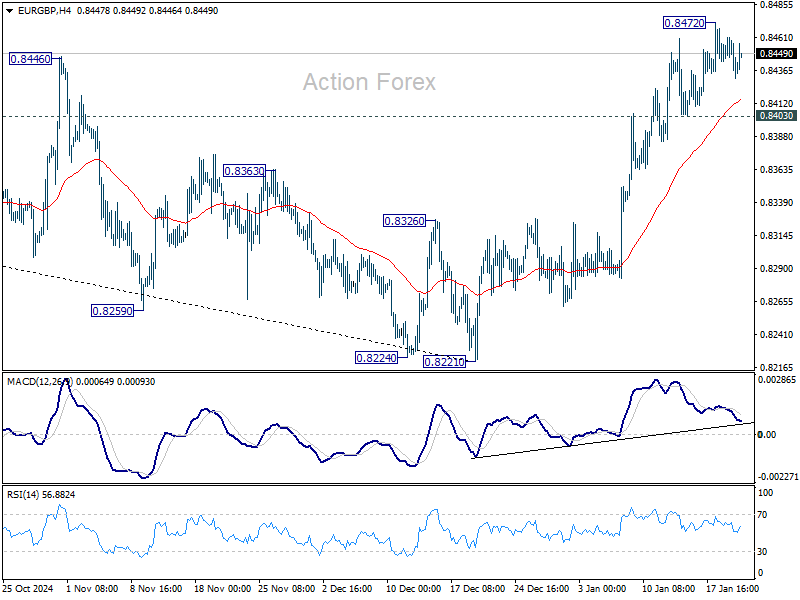
In the bigger picture, a medium term bottom was formed at 0.8221, just ahead of 0.8201 key support (2022 low). But outlook will be neutral as best as long as 0.8624 cluster resistance (38.2% retracement of 0.9267 to 0.8221 at 0.8621) holds. That is, larger down trend from 0.9267 (2022 high) might still extend lower. However, decisive break of 0.8621/4 should confirm trend reversal and turn outlook bullish.
EUR/AUD Daily Outlook
Daily Pivots: (S1) 1.6577; (P) 1.6630; (R1) 1.6674; More...
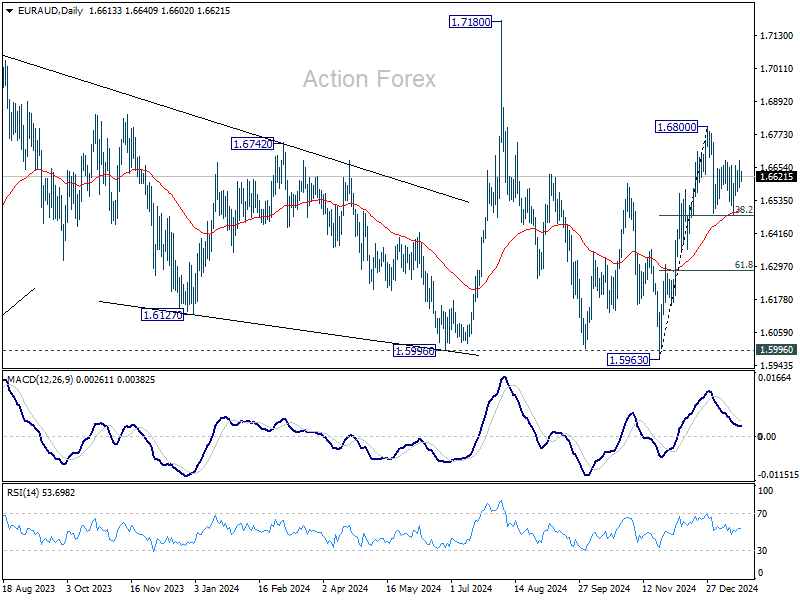
Intraday bias in EUR/AUD remains neutral as consolidations continue below 1.6800. Strong support is still expected from 38.2% retracement of 1.5963 to 1.6800 at 1.6480 to contain downside. On the upside, firm break of 1.6800 will resume the rally from 1.5963. However, sustained break of 1.6480 will bring deeper correction 61.8% retracement at 1.6283 instead.
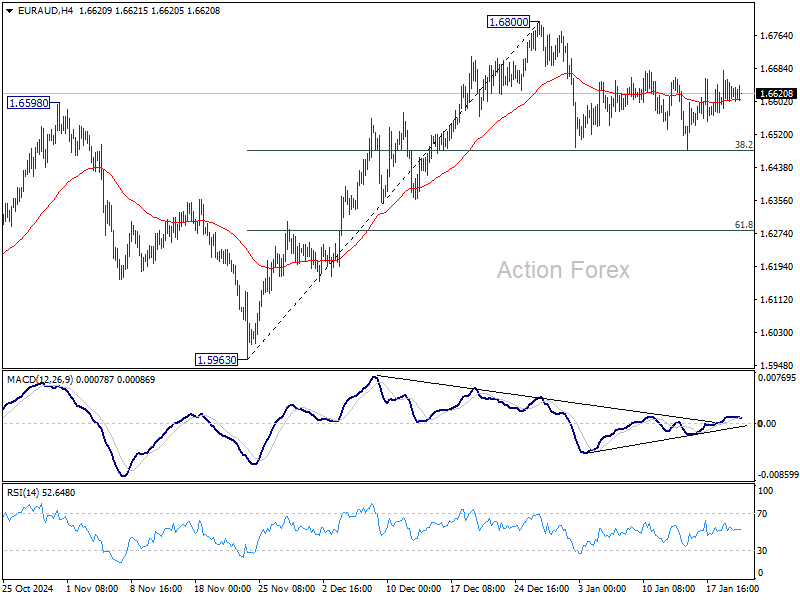
In the bigger picture, EUR/AUD is holding on to 1.5996 key support despite brief breach. Larger up trend from 1.4281 (2022 low) is still in favor to resume through 1.7180 at a later stage. Nevertheless, sustained break of 1.5995 will indicate that such up trend has completed and deeper decline would be seen.
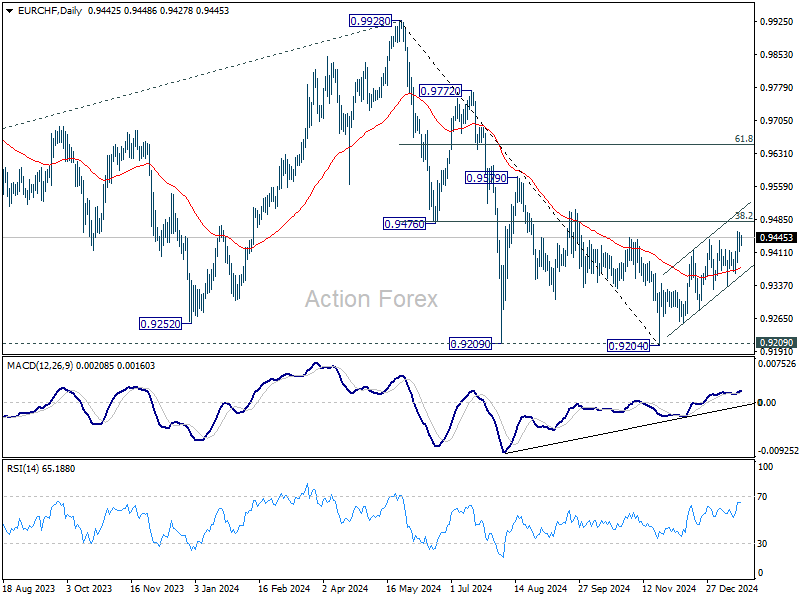
EUR/CHF Daily Outlook
Daily Pivots: (S1) 0.9419; (P) 0.9439; (R1) 0.9464; More....
Intraday bias in EUR/CHF remains mildly on the upside at this point. While further rally would be seen, strong resistance is expected from 0.9481 fibonacci level to complete the corrective rebound from 0.9204. On the downside, below 0.9365 minor support will turn bias to the downside for 0.9336 support first. Firm break of 0.9336 will argue that the correction has completed.
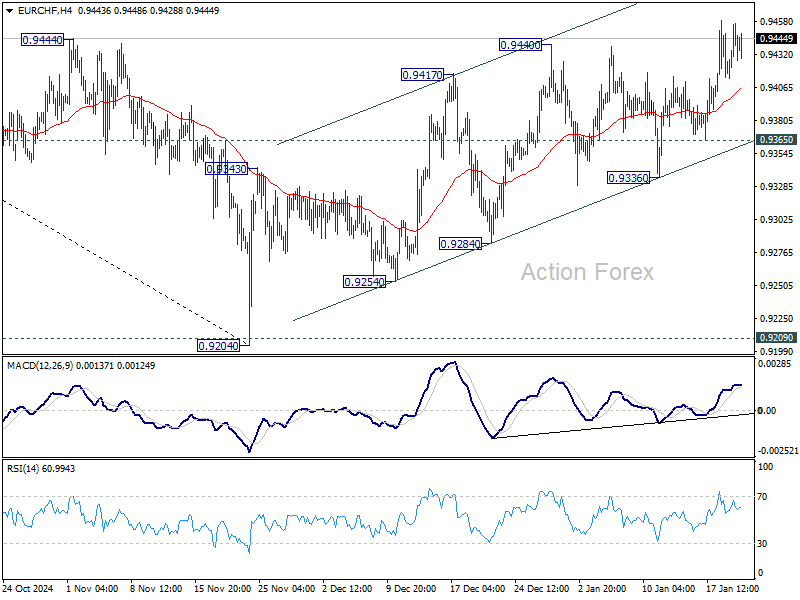
In the bigger picture, while corrective rebound from 0.9204 might extend higher, strong resistance could be seen from 38.2% retracement of 0.9928 to 0.9204 at 0.9481 to limit upside. Down trend from 0.9928 (2024 high) is still in favor to resume through 0.9204/9 support zone at a later stage. However, strong break of 0.9481 will raise the chance of medium term bottoming, and bring further rally back to 61.8% retracement at 0.9651.
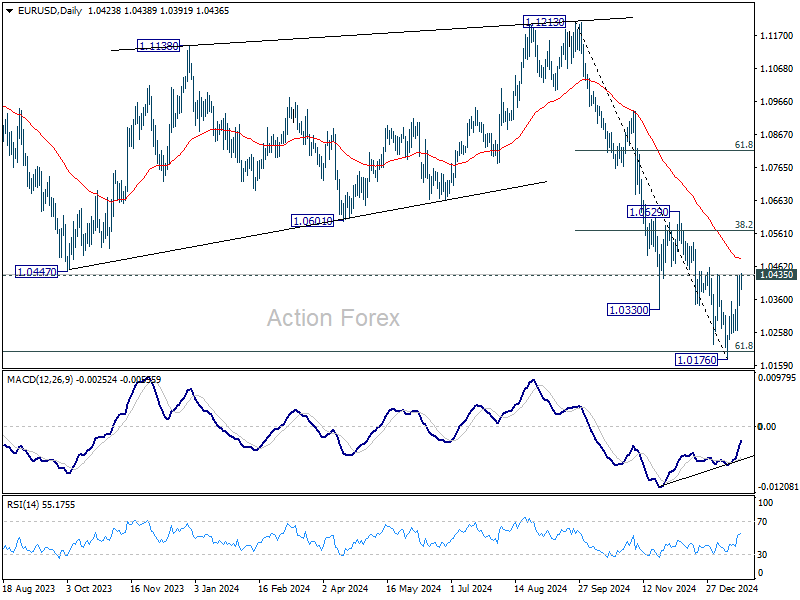
EUR/USD Daily Outlook
Daily Pivots: (S1) 1.0368; (P) 1.0401; (R1) 1.0461; More...
Immediate focus in on 1.0435 resistance in EUR/USD's rebound from 1.0176 extends. Firm break there will extend the rise to 38.2% retracement of 1.1213 to 1.0176 at 1.0572. Rejection by 1.0435 will keep the correction from 1.0176 relatively short. Firm break of 1.0176 will resume whole fall from 1.1213.
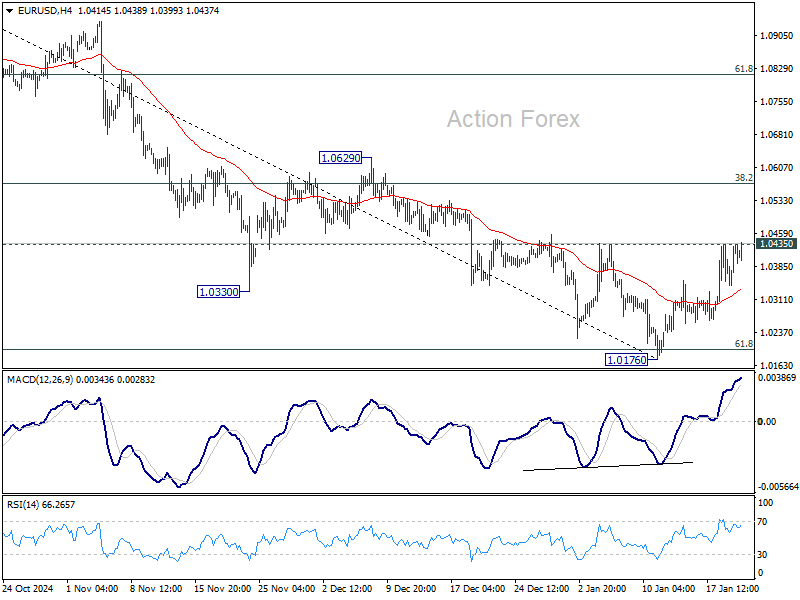
In the bigger picture, fall from 1.1274 (2023 high) should either be the second leg of the corrective pattern from 0.9534 (2022 low), or another down leg of the long term down trend. In both cases, sustained break of 61.8 retracement of 0.9534 to 1.1274 at 1.0199 will pave the way back to 0.9534. For now, outlook will stay bearish as long as 1.0629 resistance holds, even in case of strong rebound.
USD/JPY Daily Outlook
Daily Pivots: (S1) 154.78; (P) 155.51; (R1) 156.24; More...
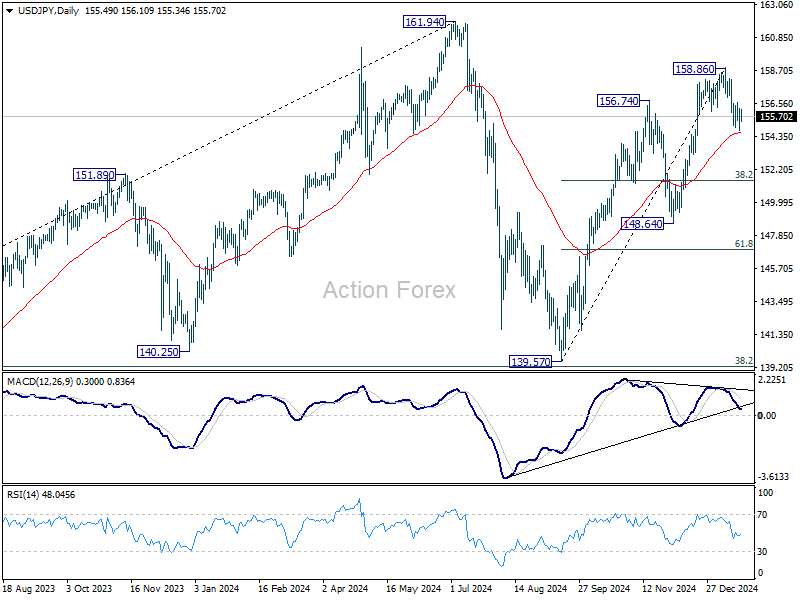
Intraday bias in USD/JPY is turned neutral on loss of momentum, as seen in 4H MACD. But risk will stay on the downside as long as 158.86 short term top holds. Sustained trading below 55 D EMA (now at 154.64) will extend the fall from 158.86 to 38.2% retracement of 139.57 to 158.86 at 151.49 next.
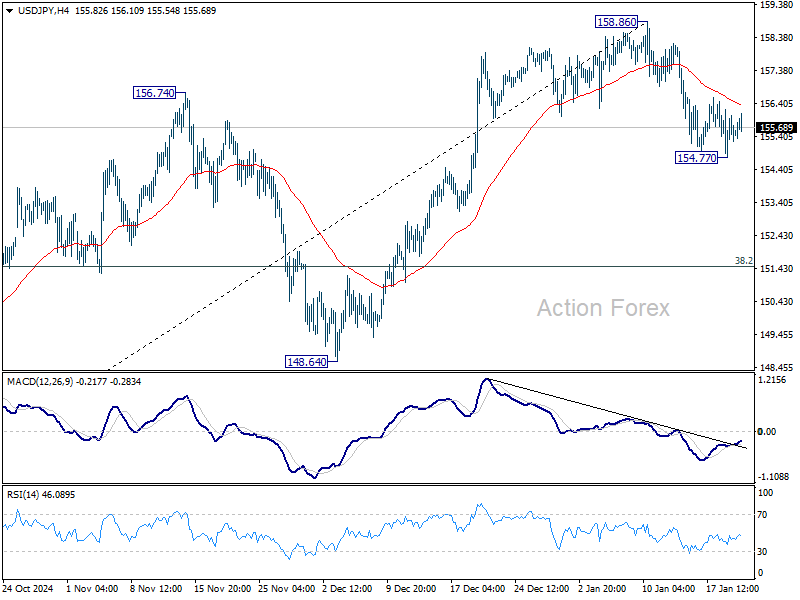
In the bigger picture, price actions from 161.94 are seen as a corrective pattern to rise from 102.58 (2021 low). The range of medium term consolidation should be set between 38.2% retracement of 102.58 to 161.94 at 139.26 and 161.94. Nevertheless, sustained break of 139.26 would open up deeper medium term decline to 61.8% retracement at 125.25.
GBP/USD Daily Outlook
Daily Pivots: (S1) 1.2267; (P) 1.2313; (R1) 1.2398; More...
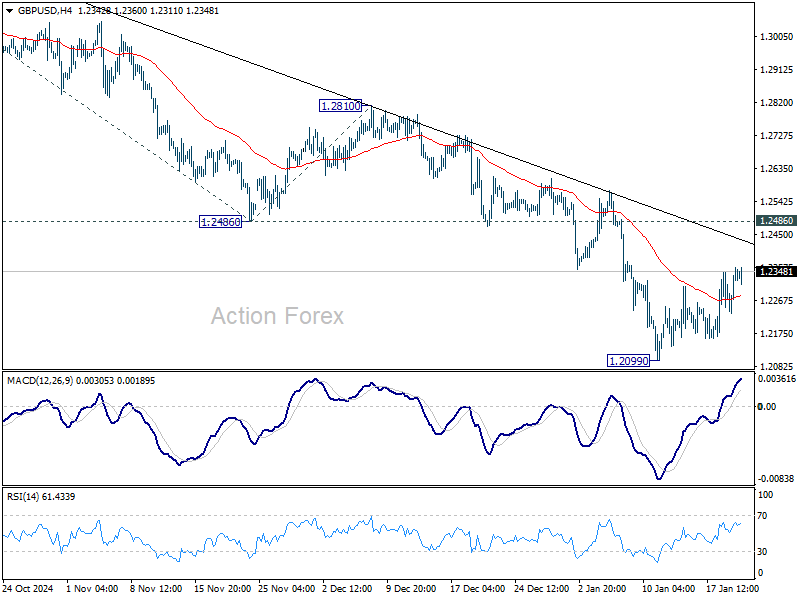
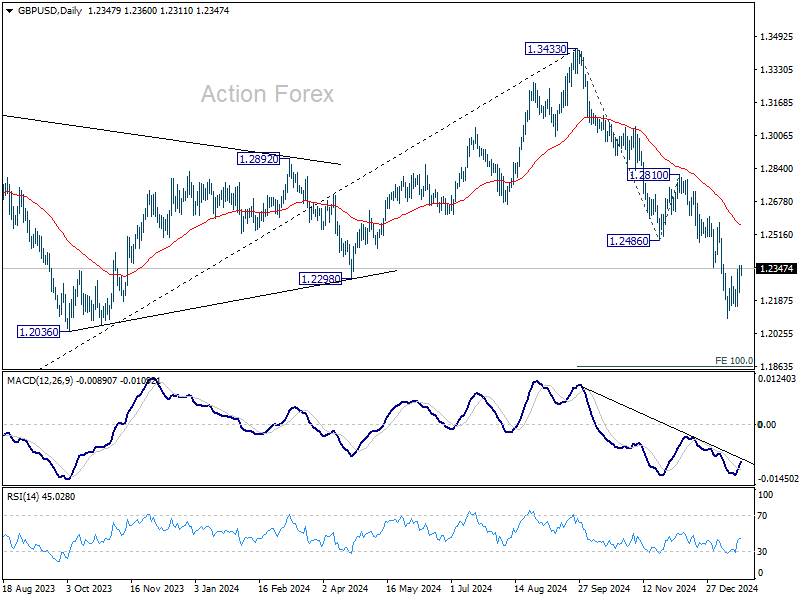
GBP/USD is staying in consolations above 1.2099 and intraday bias stays neutral. Further decline is expected with 1.2486 support turned resistance intact. On the downside, break of 1.2099 will resume the fall from 1.3433 to 100% projection of 1.3433 to 1.2486 from 1.2810 at 1.1863.
In the bigger picture, rise from 1.0351 (2022 low) should have already completed at 1.3433, and the trend has reversed. Further fall is now expected as long as 1.2810 resistance holds. Deeper decline should be seen to 61.8% retracement of 1.0351 to 1.3433 at 1.1528, even as a corrective move.
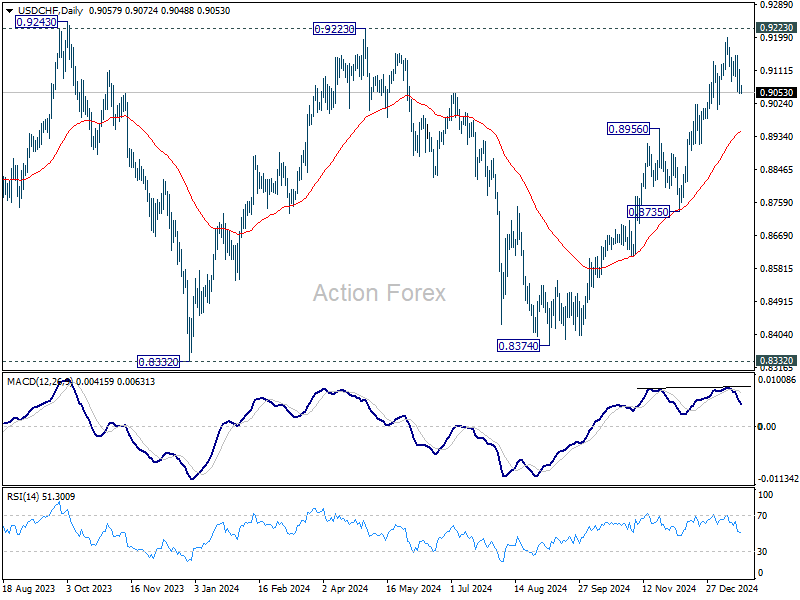
USD/CHF Daily Outlook
Daily Pivots: (S1) 0.9032; (P) 0.9077; (R1) 0.9102; More…
Intraday bias in USD/CHF remains neutral and outlook is unchanged. Intraday bias stays neutral for consolidations below 0.9200. Further rally is expected with 0.9007 support intact. On the upside, decisive break of 0.9223 will carry larger bullish implications. However, break of 0.9007 will turn bias back to the downside for deeper pull back to 55 D EMA (now at 0.8950).
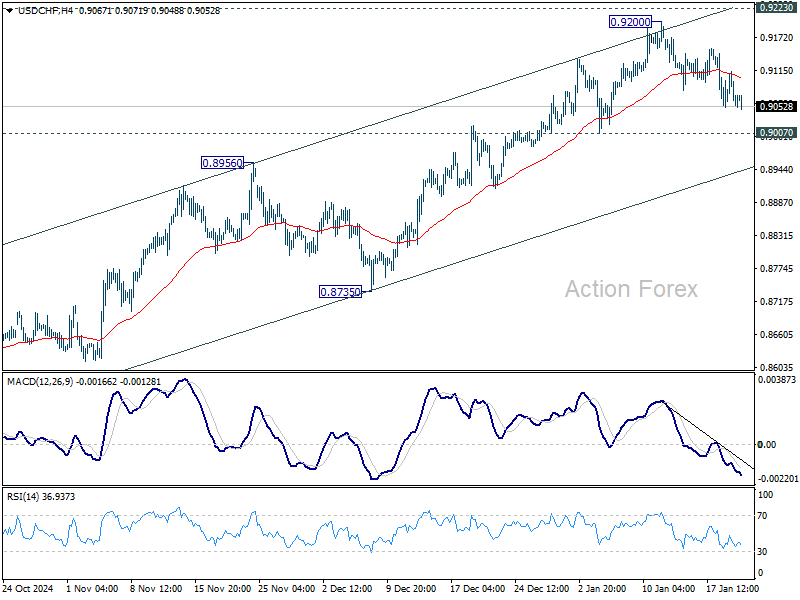
In the bigger picture, as long as 0.9223 resistance holds, price actions from 0.8332 (2023 low) are seen as a medium term corrective pattern. That is, long term down trend is in favor to resume through 0.8332 at a later stage. However, sustained break of 0.9223 will be an important sign of bullish trend reversal.