
Sample Category Title
EUR/GBP Weekly Outlook
EUR/GBP's rally from 0.8221 continued last week but failed to sustain above 0.8446 resistance and turned sideway. Initial bias remains neutral this week first. On the upside, decisive break of 0.8446 will target 0.8624 key cluster resistance zone. However, break of 0.8403 support will indicate short term topping after rejection by 0.8446. Intraday bias will be back on the downside for 55 D EMA (now at 0.8335).
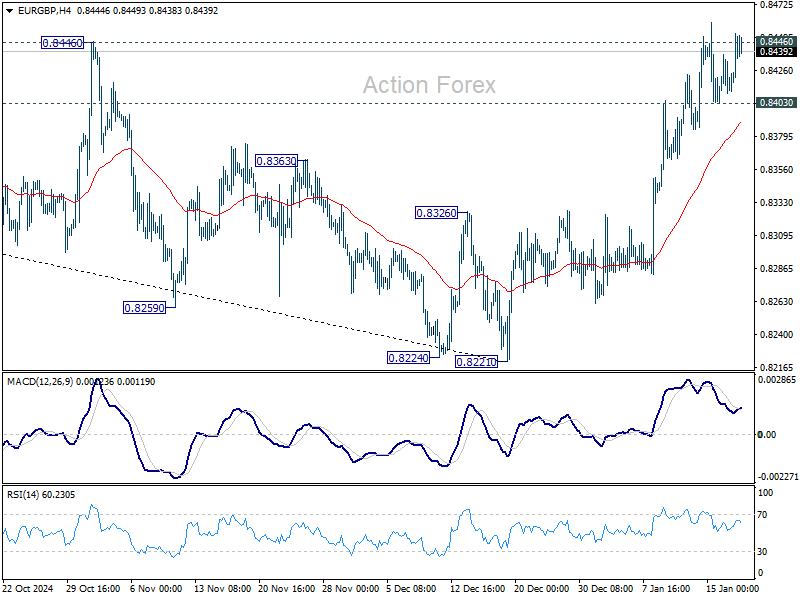
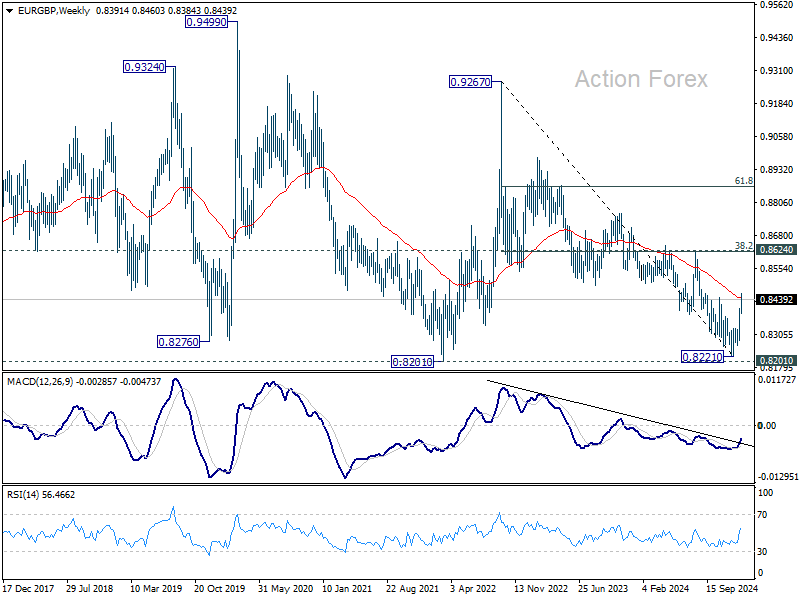
In the bigger picture, considering bullish convergence condition in D MACD, decisive break of 0.8446 resistance and 55 W EMA (now at 0.8446) should confirm medium term bottoming at 0.8221, just ahead of 0.8201 key support (2022 low). Further rally should be seen towards 0.8624 key resistance, even as a correction to the down trend from 0.9267 (2022 high). Overall, however, medium term outlook will be neutral at best until decisive break of 0.8624 cluster zone (38.2% retracement of 0.9267 to 0.8221 at 0.8621). Risk will stay on the downside even in case of strong rebound.
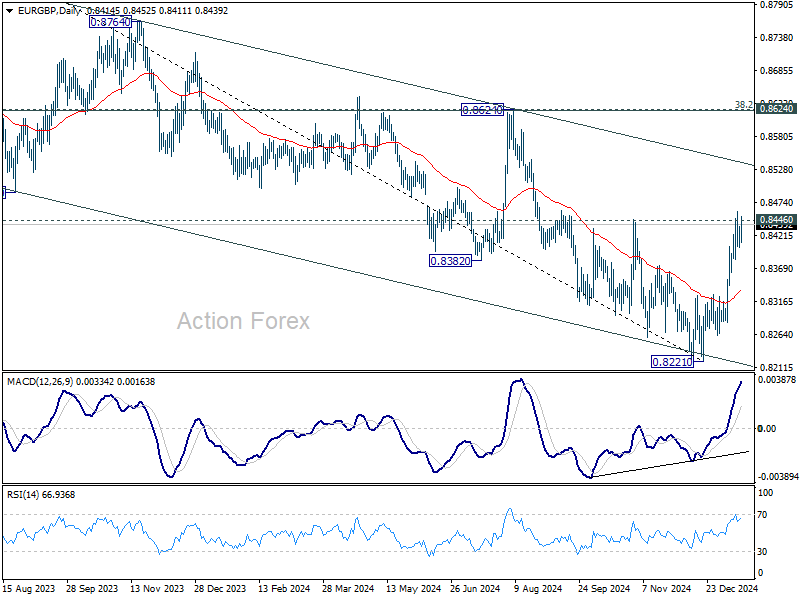
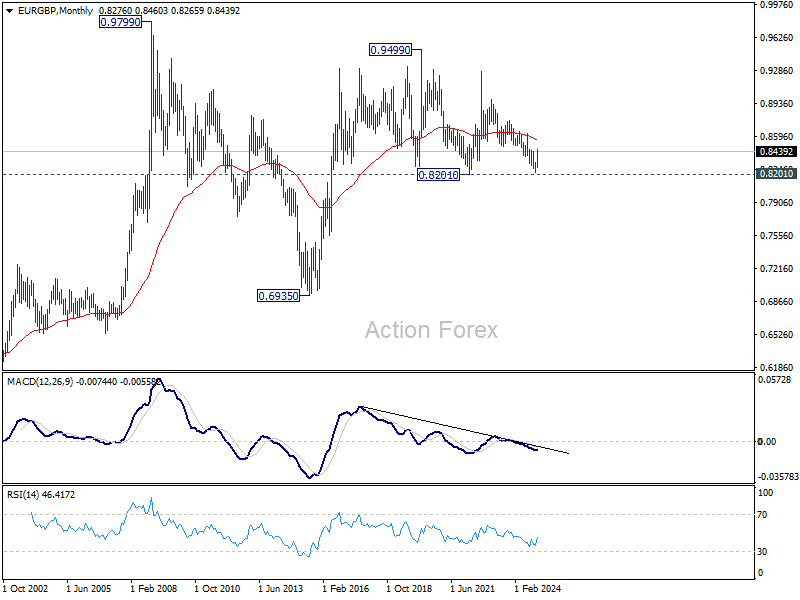
In the long term picture, price action from 0.9499 (2020 high) is seen as part of the long term range pattern from 0.9799 (2008 high). Range trading should continue between 0.8201 and 0.9499, until there is clear signal of imminent breakout.
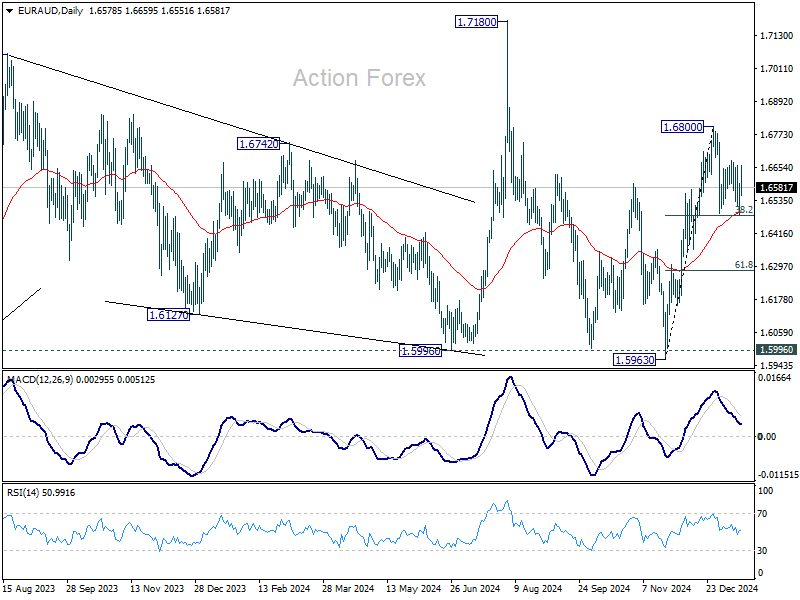
EUR/AUD Weekly Outlook
EUR/AUD's consolidation from 1.6800 extended last week and outlook is unchanged. Initial bias stays neutral this week first. For now, strong support is still expected from 38.2% retracement of 1.5963 to 1.6800 at 1.6480 to contain downside. On the upside, firm break of 1.6800 will resume the rally from 1.5963. However, sustained break of 1.6480 will bring deeper correction 61.8% retracement at 1.6283 instead.
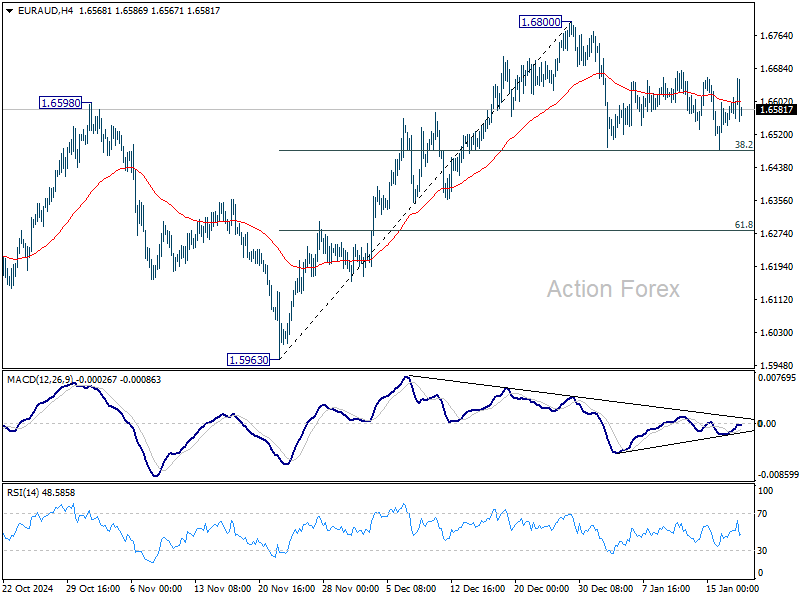
In the bigger picture, EUR/AUD is holding on to 1.5996 key support despite brief breach. Larger up trend from 1.4281 (2022 low) is still in favor to resume through 1.7180 at a later stage. Nevertheless, sustained break of 1.5995 will indicate that such up trend has completed and deeper decline would be seen.
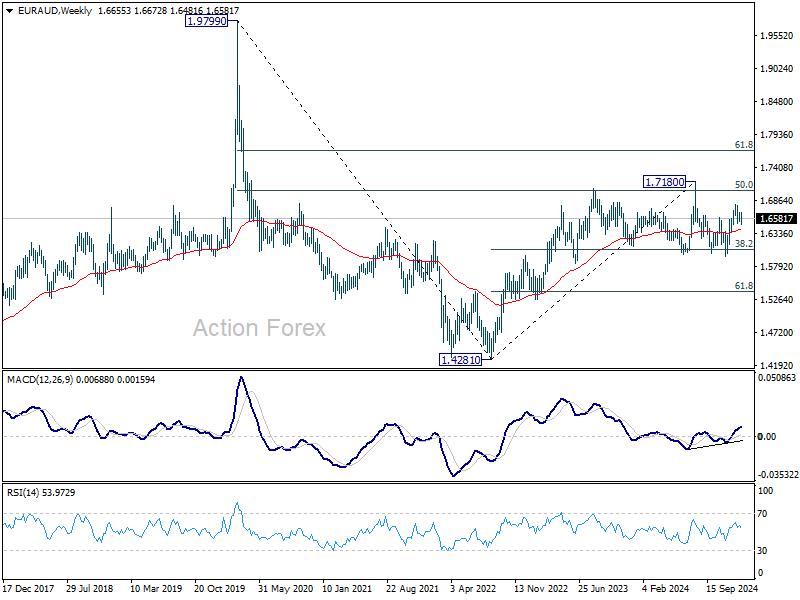
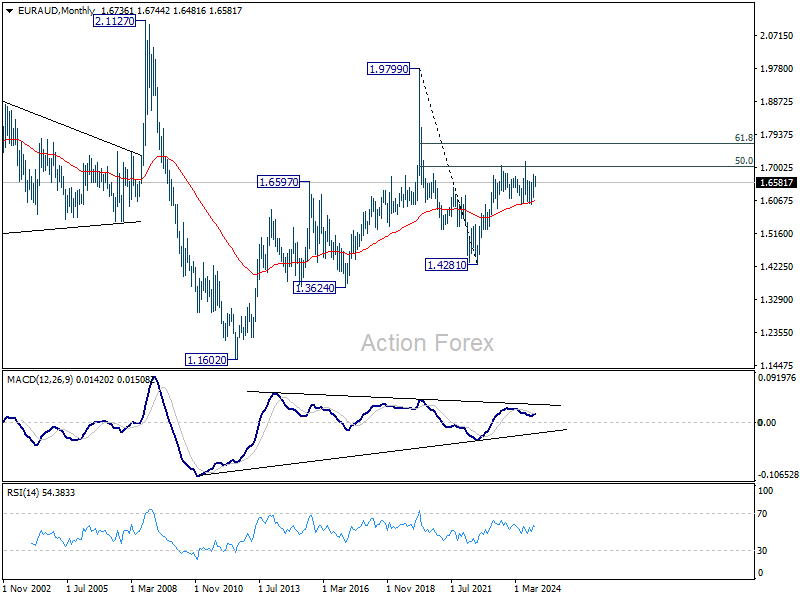
In the longer term picture, rise from 1.4281 is seen as the second leg of the pattern from 1.9799 (2020 high), which is part of the pattern from 2.1127 (2008 high). As long as 55 M EMA (now at 1.6073) holds, this second leg could still extend higher. However, sustained trading below 55 M EMA will open up the bearish case for extending the decline through 1.4281 low.
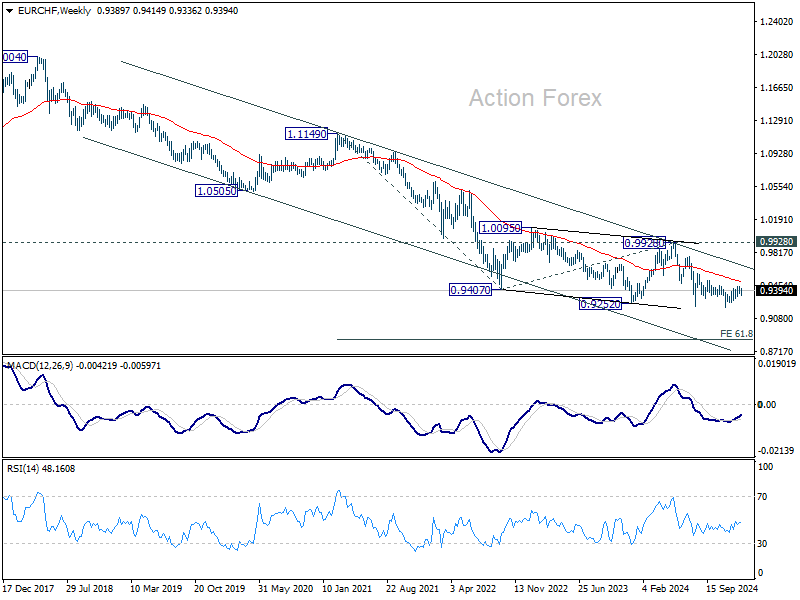
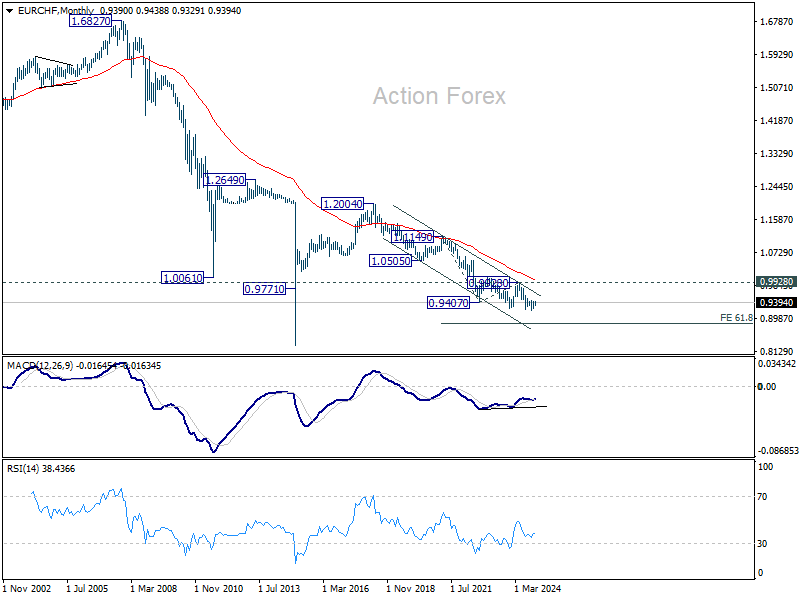
EUR/CHF Weekly Outlook
EUR/CHF stayed in consolidation below 0.9444 last week and outlook is unchanged. Initial bias remains neutral this week first. Rebound from 0.9204 is seen as a corrective move and could extend above 0.9440 But upside should be limited by 0.9481 fibonacci resistance. On the downside, firm break of 0.9336 support will argue that the correction has completed, and turn bias back to the downside for 0.9284 support first.
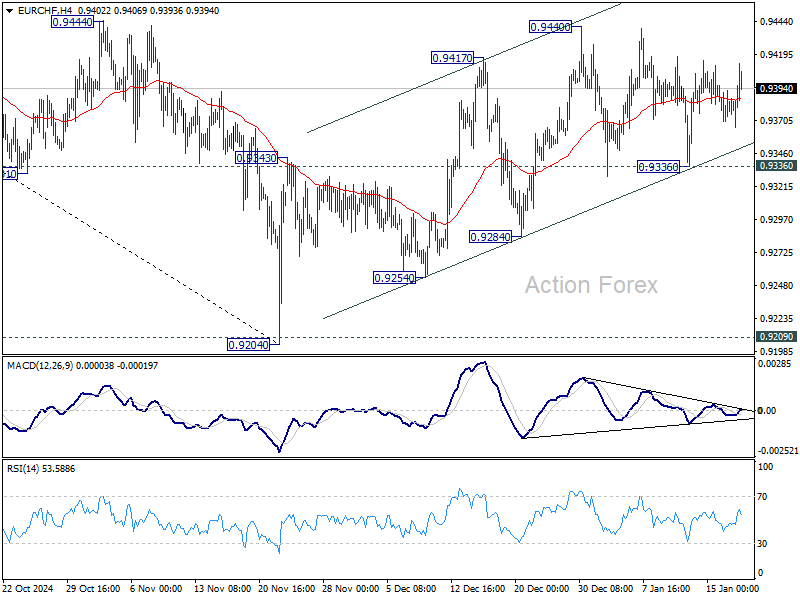
In the bigger picture, while corrective rebound from 0.9204 might extend higher, strong resistance could be seen from 38.2% retracement of 0.9928 to 0.9204 at 0.9481 to limit upside. Down trend from 0.9928 (2024 high) is still in favor to resume through 0.9204/9 support zone at a later stage.
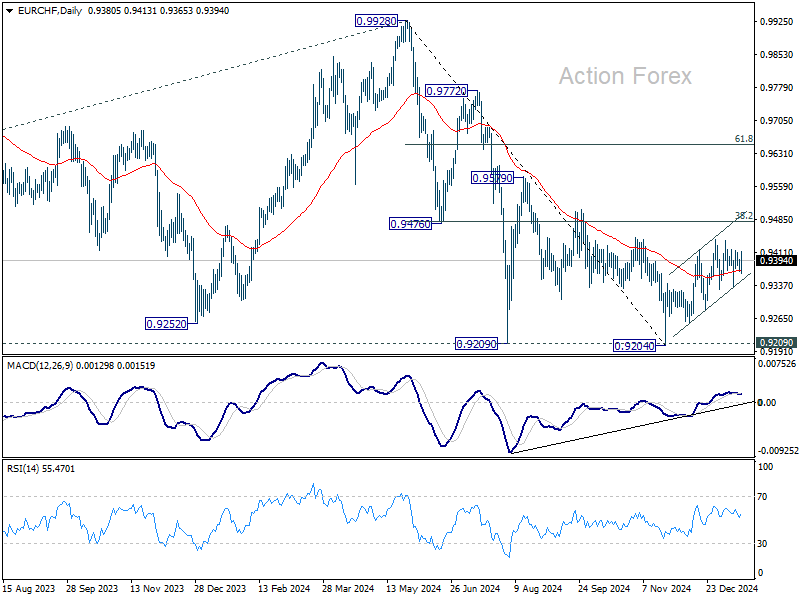
In the long term picture, fall from 1.2004 (2018 high) is part of the multi-decade down trend. Corrective pattern from 0.9407 (2022 low) might have completed with three waves to 0.9928. Decisive break of 0.9252 (2023 low) will confirm long term down trend resumption to 61.8% projection of 1.1149 to 0.9407 from 0.9928 at 0.8851. For now, outlook will stay bearish as long as 0.9928 resistance holds, even in case of strong rebound.
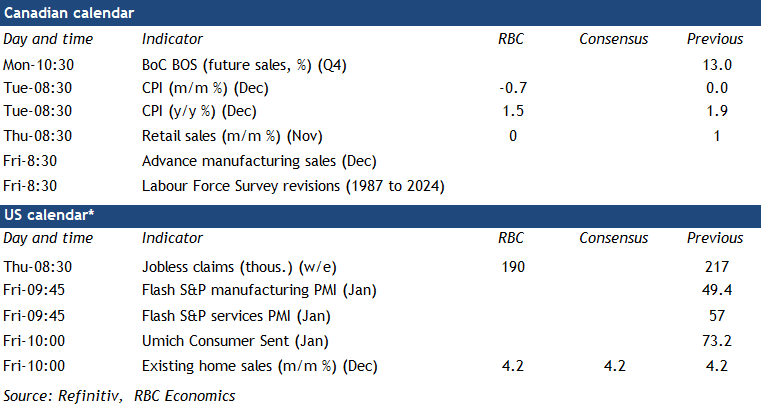
Summary 1/20 – 1/24
Monday, Jan 20, 2025
| GMT | Ccy | Events | Consensus | Previous |
|---|---|---|---|---|
| 23:50 | JPY | Machinery Orders M/M Nov | -0.70% | 2.10% |
| 00:01 | GBP | Rightmove House Price Index M/M Jan | -1.70% | |
| 01:00 | CNY | 1-y Loan Prime Rate | 3.10% | 3.10% |
| 01:00 | CNY | 5-y Loan Prime Rate | 3.60% | 3.60% |
| 04:30 | JPY | Tertiary Industry Index M/M Nov | 0.10% | 0.30% |
| 04:30 | JPY | Industrial Production M/M Nov F | -2.30% | -2.30% |
| 07:00 | EUR | Germany PPI M/M Dec | 0.30% | 0.50% |
| 07:00 | EUR | Germany PPI Y/Y Dec | 1.10% | 0.10% |
| 07:30 | CHF | PPI M/M Dec | 0.20% | -0.60% |
| 07:30 | CHF | PPI Y/Y Dec | -1.50% | |
| 15:30 | CAD | BoC Business Outlook Survey | ||
| 21:30 | NZD | Business NZ PSI Dec | 49.5 |
| GMT | Ccy | Events | |
|---|---|---|---|
| 23:50 | JPY | Machinery Orders M/M Nov | |
| Forecast: -0.70% | Previous: 2.10% | ||
| 00:01 | GBP | Rightmove House Price Index M/M Jan | |
| Forecast: | Previous: -1.70% | ||
| 01:00 | CNY | 1-y Loan Prime Rate | |
| Forecast: 3.10% | Previous: 3.10% | ||
| 01:00 | CNY | 5-y Loan Prime Rate | |
| Forecast: 3.60% | Previous: 3.60% | ||
| 04:30 | JPY | Tertiary Industry Index M/M Nov | |
| Forecast: 0.10% | Previous: 0.30% | ||
| 04:30 | JPY | Industrial Production M/M Nov F | |
| Forecast: -2.30% | Previous: -2.30% | ||
| 07:00 | EUR | Germany PPI M/M Dec | |
| Forecast: 0.30% | Previous: 0.50% | ||
| 07:00 | EUR | Germany PPI Y/Y Dec | |
| Forecast: 1.10% | Previous: 0.10% | ||
| 07:30 | CHF | PPI M/M Dec | |
| Forecast: 0.20% | Previous: -0.60% | ||
| 07:30 | CHF | PPI Y/Y Dec | |
| Forecast: | Previous: -1.50% | ||
| 15:30 | CAD | BoC Business Outlook Survey | |
| Forecast: | Previous: | ||
| 21:30 | NZD | Business NZ PSI Dec | |
| Forecast: | Previous: 49.5 | ||
Tuesday, Jan 21, 2025
| GMT | Ccy | Events | Consensus | Previous |
|---|---|---|---|---|
| 07:00 | GBP | Claimant Count Change Dec | 10.3K | 0.3K |
| 07:00 | GBP | ILO Unemployment Rate (3M) Nov | 4.30% | 4.30% |
| 07:00 | GBP | Average Earnings Excluding Bonus 3M/Y Nov | 5.50% | 5.20% |
| 07:00 | GBP | Average Earnings Including Bonus 3M/Y Nov | 5.60% | 5.20% |
| 07:00 | GBP | Claimant Count Rate Dec | 4.60% | |
| 10:00 | EUR | Germany ZEW Economic Sentiment Jan | 15.1 | 15.7 |
| 10:00 | EUR | Germany ZEW Current Situation Jan | -93 | -93.1 |
| 10:00 | EUR | Eurozone ZEW Economic Sentiment Jan | 16.9 | 17 |
| 13:30 | CAD | CPI M/M Dec | -0.70% | 0.00% |
| 13:30 | CAD | CPI Y/Y Dec | 1.70% | 1.90% |
| 13:30 | CAD | CPI Median Y/Y Dec | 2.50% | 2.60% |
| 13:30 | CAD | CPI Trimmed Y/Y Dec | 2.50% | 2.70% |
| 13:30 | CAD | CPI Common Y/Y Dec | 1.90% | 2.00% |
| 21:45 | NZD | CPI Q/Q Q4 | 0.50% | 0.60% |
| 21:45 | NZD | CPI Y/Y Q4 | 2.10% | 2.20% |
| GMT | Ccy | Events | |
|---|---|---|---|
| 07:00 | GBP | Claimant Count Change Dec | |
| Forecast: 10.3K | Previous: 0.3K | ||
| 07:00 | GBP | ILO Unemployment Rate (3M) Nov | |
| Forecast: 4.30% | Previous: 4.30% | ||
| 07:00 | GBP | Average Earnings Excluding Bonus 3M/Y Nov | |
| Forecast: 5.50% | Previous: 5.20% | ||
| 07:00 | GBP | Average Earnings Including Bonus 3M/Y Nov | |
| Forecast: 5.60% | Previous: 5.20% | ||
| 07:00 | GBP | Claimant Count Rate Dec | |
| Forecast: | Previous: 4.60% | ||
| 10:00 | EUR | Germany ZEW Economic Sentiment Jan | |
| Forecast: 15.1 | Previous: 15.7 | ||
| 10:00 | EUR | Germany ZEW Current Situation Jan | |
| Forecast: -93 | Previous: -93.1 | ||
| 10:00 | EUR | Eurozone ZEW Economic Sentiment Jan | |
| Forecast: 16.9 | Previous: 17 | ||
| 13:30 | CAD | CPI M/M Dec | |
| Forecast: -0.70% | Previous: 0.00% | ||
| 13:30 | CAD | CPI Y/Y Dec | |
| Forecast: 1.70% | Previous: 1.90% | ||
| 13:30 | CAD | CPI Median Y/Y Dec | |
| Forecast: 2.50% | Previous: 2.60% | ||
| 13:30 | CAD | CPI Trimmed Y/Y Dec | |
| Forecast: 2.50% | Previous: 2.70% | ||
| 13:30 | CAD | CPI Common Y/Y Dec | |
| Forecast: 1.90% | Previous: 2.00% | ||
| 21:45 | NZD | CPI Q/Q Q4 | |
| Forecast: 0.50% | Previous: 0.60% | ||
| 21:45 | NZD | CPI Y/Y Q4 | |
| Forecast: 2.10% | Previous: 2.20% | ||
Wednesday, Jan 22, 2025
| GMT | Ccy | Events | Consensus | Previous |
|---|---|---|---|---|
| 00:00 | AUD | Westpac Leading Index M/M Dec | 0.10% | |
| 07:00 | GBP | Public Sector Net Borrowing (GBP) Dec | 13.7B | 11.2B |
| 13:30 | CAD | Industrial Product Price M/M Dec | 0.80% | 0.60% |
| 13:30 | CAD | Raw Material Price Index Dec | 0.40% | -0.50% |
| 23:50 | JPY | Trade Balance (JPY) Dec | -0.64T | -0.38T |
| GMT | Ccy | Events | |
|---|---|---|---|
| 00:00 | AUD | Westpac Leading Index M/M Dec | |
| Forecast: | Previous: 0.10% | ||
| 07:00 | GBP | Public Sector Net Borrowing (GBP) Dec | |
| Forecast: 13.7B | Previous: 11.2B | ||
| 13:30 | CAD | Industrial Product Price M/M Dec | |
| Forecast: 0.80% | Previous: 0.60% | ||
| 13:30 | CAD | Raw Material Price Index Dec | |
| Forecast: 0.40% | Previous: -0.50% | ||
| 23:50 | JPY | Trade Balance (JPY) Dec | |
| Forecast: -0.64T | Previous: -0.38T | ||
Thursday, Jan 23, 2025
| GMT | Ccy | Events | Consensus | Previous |
|---|---|---|---|---|
| 13:30 | USD | Initial Jobless Claims (Jan 17) | 220K | 217K |
| 13:30 | CAD | Retail Sales M/M Nov | 0.10% | 0.60% |
| 13:30 | CAD | Retail Sales ex Autos M/M Nov | 0.00% | 0.10% |
| 15:00 | EUR | Eurozone Consumer Confidence Jan P | -14.5 | -14.5 |
| 15:30 | USD | Natural Gas Storage | -258B | |
| 22:00 | AUD | Manufacturing PMI Jan P | 47.8 | |
| 22:00 | AUD | Services PMI Jan P | 50.8 | |
| 23:30 | JPY | National CPI Y/Y Dec | 2.90% | |
| 23:30 | JPY | National CPI Core Y/Y Dec | 3.00% | 2.70% |
| 23:30 | JPY | National CPI Core-Core Y/Y Dec | 2.70% |
| GMT | Ccy | Events | |
|---|---|---|---|
| 13:30 | USD | Initial Jobless Claims (Jan 17) | |
| Forecast: 220K | Previous: 217K | ||
| 13:30 | CAD | Retail Sales M/M Nov | |
| Forecast: 0.10% | Previous: 0.60% | ||
| 13:30 | CAD | Retail Sales ex Autos M/M Nov | |
| Forecast: 0.00% | Previous: 0.10% | ||
| 15:00 | EUR | Eurozone Consumer Confidence Jan P | |
| Forecast: -14.5 | Previous: -14.5 | ||
| 15:30 | USD | Natural Gas Storage | |
| Forecast: | Previous: -258B | ||
| 22:00 | AUD | Manufacturing PMI Jan P | |
| Forecast: | Previous: 47.8 | ||
| 22:00 | AUD | Services PMI Jan P | |
| Forecast: | Previous: 50.8 | ||
| 23:30 | JPY | National CPI Y/Y Dec | |
| Forecast: | Previous: 2.90% | ||
| 23:30 | JPY | National CPI Core Y/Y Dec | |
| Forecast: 3.00% | Previous: 2.70% | ||
| 23:30 | JPY | National CPI Core-Core Y/Y Dec | |
| Forecast: | Previous: 2.70% | ||
Friday, Jan 24, 2025
| GMT | Ccy | Events | Consensus | Previous |
|---|---|---|---|---|
| JPY | BoJ Interest Rate Decision | 0.50% | 0.25% | |
| 00:01 | GBP | GfK Consumer Confidence Jan | -18 | -17 |
| 00:30 | JPY | Manufacturing PMI Jan P | 49.7 | 49.6 |
| 00:30 | JPY | Services PMI Jan P | 50.9 | |
| 08:15 | EUR | France Manufacturing PMI Jan P | 42.1 | 41.9 |
| 08:15 | EUR | France Services PMI Jan P | 49.4 | 49.3 |
| 08:30 | EUR | Germany Manufacturing PMI Jan P | 42.9 | 42.5 |
| 08:30 | EUR | Germany Services PMI Jan P | 51.1 | 51.2 |
| 09:00 | EUR | Eurozone Manufacturing PMI Jan P | 45.3 | 45.1 |
| 09:00 | EUR | Eurozone Services PMI Jan P | 51.4 | 51.6 |
| 09:30 | GBP | Manufacturing PMI Jan P | 46.9 | 47 |
| 09:30 | GBP | Services PMI Jan P | 50.6 | 51.1 |
| 13:30 | CAD | New Housing Price Index M/M Dec | 0.20% | 0.10% |
| 14:45 | USD | Manufacturing PMI Jan P | 49.4 | |
| 14:45 | USD | Services PMI Jan P | 56.8 | |
| 15:00 | USD | Existing Home Sales M/M Dec | 4.16M | 4.15M |
| 15:00 | USD | Existing Home Sales Change M/M Dec | 4.80% | |
| 15:00 | USD | Michigan Consumer Sentiment Jan F | 73.2 | 73.2 |
| GMT | Ccy | Events | |
|---|---|---|---|
| JPY | BoJ Interest Rate Decision | ||
| Forecast: 0.50% | Previous: 0.25% | ||
| 00:01 | GBP | GfK Consumer Confidence Jan | |
| Forecast: -18 | Previous: -17 | ||
| 00:30 | JPY | Manufacturing PMI Jan P | |
| Forecast: 49.7 | Previous: 49.6 | ||
| 00:30 | JPY | Services PMI Jan P | |
| Forecast: | Previous: 50.9 | ||
| 08:15 | EUR | France Manufacturing PMI Jan P | |
| Forecast: 42.1 | Previous: 41.9 | ||
| 08:15 | EUR | France Services PMI Jan P | |
| Forecast: 49.4 | Previous: 49.3 | ||
| 08:30 | EUR | Germany Manufacturing PMI Jan P | |
| Forecast: 42.9 | Previous: 42.5 | ||
| 08:30 | EUR | Germany Services PMI Jan P | |
| Forecast: 51.1 | Previous: 51.2 | ||
| 09:00 | EUR | Eurozone Manufacturing PMI Jan P | |
| Forecast: 45.3 | Previous: 45.1 | ||
| 09:00 | EUR | Eurozone Services PMI Jan P | |
| Forecast: 51.4 | Previous: 51.6 | ||
| 09:30 | GBP | Manufacturing PMI Jan P | |
| Forecast: 46.9 | Previous: 47 | ||
| 09:30 | GBP | Services PMI Jan P | |
| Forecast: 50.6 | Previous: 51.1 | ||
| 13:30 | CAD | New Housing Price Index M/M Dec | |
| Forecast: 0.20% | Previous: 0.10% | ||
| 14:45 | USD | Manufacturing PMI Jan P | |
| Forecast: | Previous: 49.4 | ||
| 14:45 | USD | Services PMI Jan P | |
| Forecast: | Previous: 56.8 | ||
| 15:00 | USD | Existing Home Sales M/M Dec | |
| Forecast: 4.16M | Previous: 4.15M | ||
| 15:00 | USD | Existing Home Sales Change M/M Dec | |
| Forecast: | Previous: 4.80% | ||
| 15:00 | USD | Michigan Consumer Sentiment Jan F | |
| Forecast: 73.2 | Previous: 73.2 | ||
Markets Weekly Outlook – Trump 2.0 Takes Flight as BoJ Decision Looms
- It was a strong week for US stocks and gold, with the S&P rising about 3% by the end of the week.
- Markets are bracing for potential volatility and policy surprises as Donald Trump is inaugurated as US President.
- The Bank of Japan (BoJ) meeting on January 24th is a key event, with potential for an interest rate hike.
- The S&P 500 is showing positive signs, potentially entering a bullish phase if it closes above a key resistance level.
Week in Review: Moderating US Inflation and Strong Earnings Keep Sentiment Positive
Markets bid farewell to the last trading week before Trump 2.0 as incoming US President Donald Trump will be inaugurated on Monday. Markets have been bracing for volatility and potential surprises in policy as Trump returns to the White House.
US inflation data showed positive signs this week and was backed up by some dovish commentary from Federal Reserve policymakers. However, by the end of next week we could all be singing from a different hymn sheet and thus caution remains.
US Equities enjoyed a positive week as strong corporate earnings from the country’s biggest banks helped propel US indices higher. TSMC also provided a positive outlook for 2025 from a demand perspective that boosted hopes around AI spending and growth prospects. At the time of writing the S&P 500 was up 3% for the week.
The S&P 500 banking index (.SPXBK) and regional banks (.KRX) outpaced the main indexes this week, gaining approximately 6.1% and 7.6%, respectively.
Source: LSEG (click to enlarge)
Gold rose this week and reclaimed the $2700/oz level as the precious metal continues to find demand thanks to global uncertainties. This week the precious metal was also boosted by increased optimism around US rate cuts for 2025.
Oil prices continue to hold the high ground thanks to new Russian sanctions as well potential sanctions on Iran when President Trump assumes office. Oil prices have added 1.87% this week following the successive week of gains. If President Trump reverses the no drilling mandate passed by President Biden recently that could lead to a drop in prices.
On the FX front, the US Dollar has struggled this week but it hasn’t been a smooth move lower. Markets still see a stronger USD in 2025 and that could in part explain the grind lower and why it didn’t gather any real steam.
The crypto market is back on the up this week with Bitcoin eyeing a move above the 105k handle at the time of writing. XRP has continued its rise as markets also bet on a pro crypto policy under President Trump’s administration.
All asset classes and Global markets await the inauguration of Donald Trump as they wait with bated breath for his long promised policy proposals, The proposals are likely to shape market dynamics in the months ahead and remain crucial.
The Week Ahead: Trump Inauguration and BoJ Hold the Keys
Asia Pacific Markets
The main focus this week in the Asia Pacific region is the Bank of Japan’s meeting on January 24. Recent inflation and wage figures look promising and back its plan to increase interest rates at next week’s meeting.
Earlier today we heard rumors from Nikkei that the majority of BoJ board members are set to approve a rate hike next week.
After Friday’s release of data, which saw Chinese GDP come in better than expected. The economy grew by 5.4% in the fourth quarter compared to a year ago, up from 4.6% in the third quarter and higher than the 5.0% estimate. This was the fastest growth since the second quarter of 2023.
Following a data heavy week China’s schedule for new updates slows down. On Monday, the loan prime rates will be announced, but no changes are expected since the People’s Bank of China left key rates the same. Attention will turn to Trump’s inauguration and whether he will announce any immediate tariffs on China.
In the Asia Pacific region New Zealand inflation will be the highest impact data release and could provide the NZD with some impetus moving forward.
Europe + UK + US
In developed markets, the US inauguration will no doubt be at the forefront as well as any immediate moves by the incoming administration. This has the potential to overshadow any data releases.
The US will also be releasing S&P Manufacturing and Services PMI data on Friday.
In Europe and the UK, we also have a S&P manufacturing data which would give further insights into the Euro Area economy. There are also two speeches from ECB President Christine Lagarde on Wednesday and Friday.
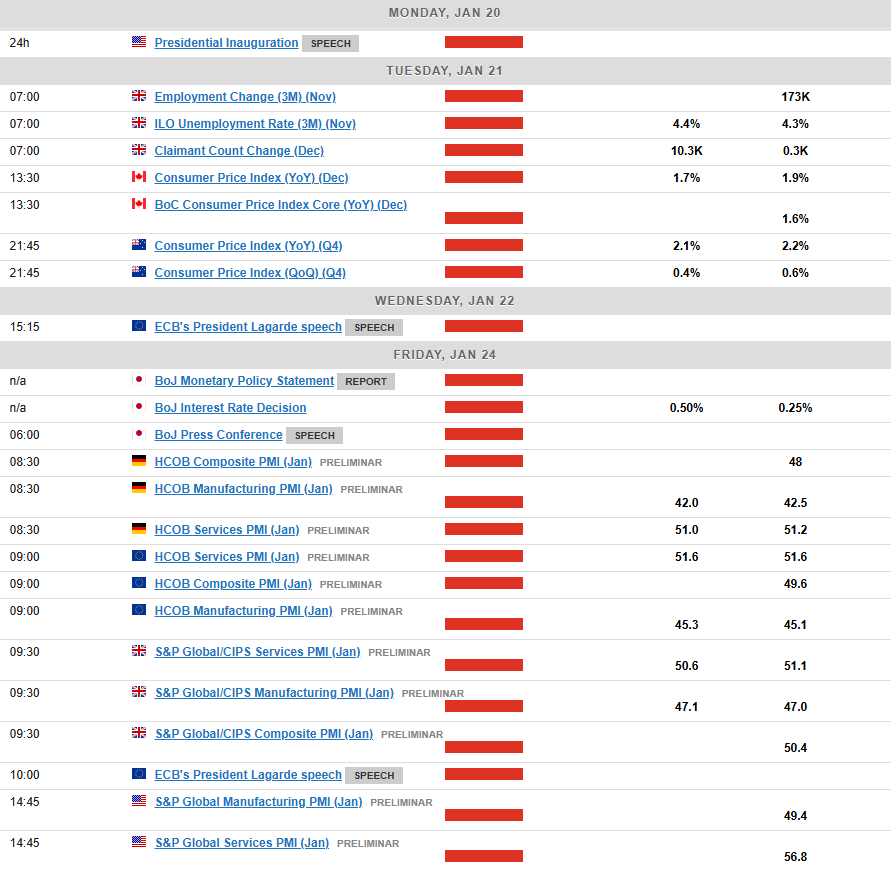
Chart of the Week
This week’s focus is on the S&P 500 as it looks to record a daily candle close above a key level that would put bulls firmly in control.
The S&P 500 is currently trading above the previous swing high at 5980 with a daily candle close above leading to change in structure.
This would be key as the optimism for stocks under the incoming President remains high. The S&P found support at the back end of the week after breaking above the 20-day SMA after strong bank earnings helped the index move higher.
There is more earnings due next week with further strong performances from the likes of Netflix likely to propel the S&P 500 toward its all time highs .
Immediate resistance rests at 6025 before the all time highs of 6094 comes into focus.
On the downside, support rests at the 20-day SMA which lines up with support at 5910 before 5840 and 5757 become areas to focus on.
S&P 500 Daily Chart – January 17, 2025
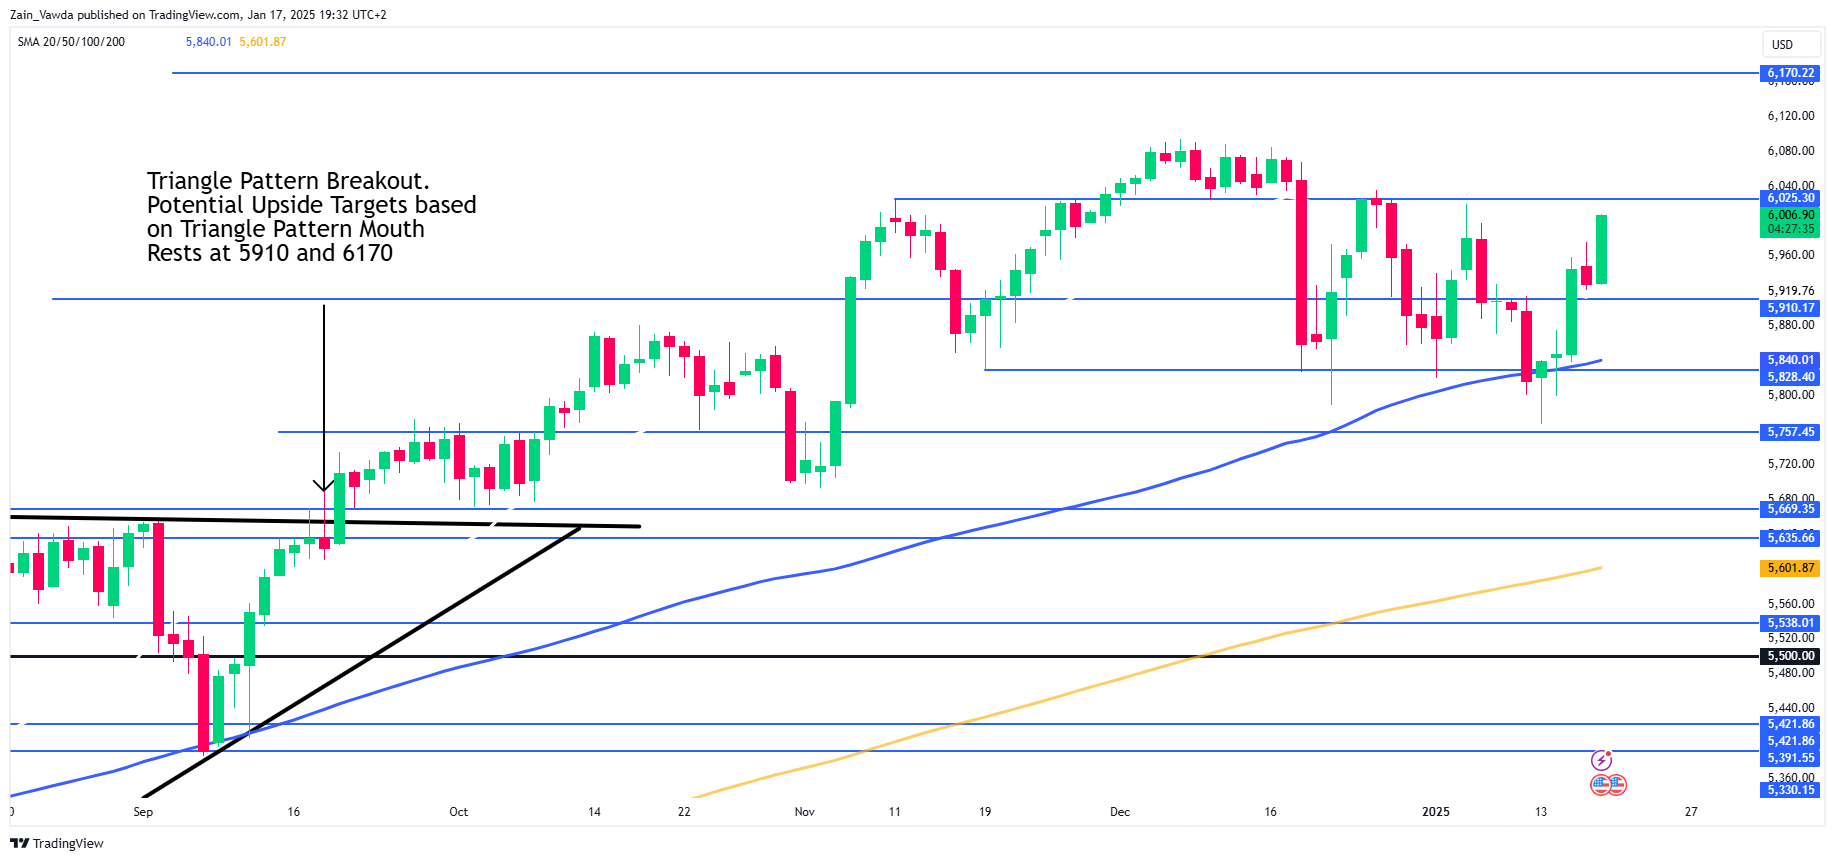
Source:TradingView.Com (click to enlarge)
Key Levels to Consider:
Support
- 5910
- 5840
- 5757
Resistance
- 6025
- 6094
- 6170
The Weekly Bottom Line: U.S. Economy Sails into Trump’s Presidency at Cruising Speed
Canadian Highlights
- Donald Trump will be inaugurated on Monday, and Canadians are bracing for the economic threats in recent weeks to turn into action through a flurry of executive orders.
- Canada is economically tied to the U.S., with $1.9 billion in daily goods and services exported to its southern neighbour. That amounts to over 20% of GDP.
- While we aren’t expecting the worst-case scenario on tariffs, even a tapered down set of tariffs could be enough to send temporary shockwaves through the economy and financial markets.
U.S. Highlights
- December’s CPI report brought some modestly positive news on inflation. The headline CPI came in as expected and even better core inflation had a softer month after a string of hot readings.
- Retail sales also saw a solid gain in December. While consumers reduced spending at restaurants and bars, it’s likely they were just busy shopping.
- Fed officials continued to emphasize that the economy remains solid and that the central bank can afford to be patient with further interest rate cuts.
Canada – Ready or Not, Here He Comes
Donald Trump will be inaugurated on Monday, and Canadians are bracing for the economic threats in recent weeks to turn into action through a flurry of executive orders. While we aren’t expecting the worst-case scenario, even a tapered down set of tariffs could be enough to send temporary shockwaves through the economy and financial markets. To assess the magnitude of this threat, here are the areas of economic growth and jobs most at risk on Trump’s return to the White House.
Three-quarters of Canadian exports head south of the border. This amounts to $1.9 billion in daily goods and services exports, meaning that exports to the U.S. account for over 20% of Canada’s GDP. Breaking it down by sector, energy is by far the largest contributor in dollar terms, making up more than a quarter of total exports. However, non-energy exports are also highly vulnerable. As shown in Chart 1, sectors ranging from motor vehicles to forestry have more than 80% of their production destined for the U.S. An estimated 46k companies in Canada depend on exporting to the U.S., supporting around 2 million jobs (nearly 10% of total employment).
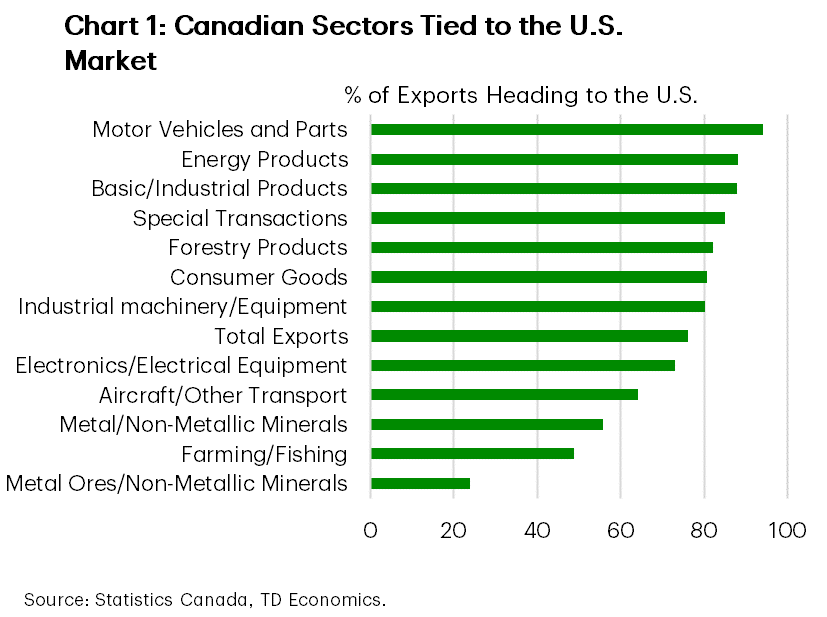
Geographically, the risk is widespread. All provinces have exposure to U.S. tariffs, ranging from B.C. lumber to Quebec metals to Nova Scotia live animal exports. However, Ontario tops the list in terms of total dollars due to its diversified industries being deeply integrated with its southern neighbour. Motor vehicle and parts manufacturing may get most of the attention, but Ontario is also home to significant production of machinery, base metals, chemicals, and even food/beverage. While many of these goods are a part of well-established integrated supply chains, it won’t assuage fears, as nearly a million jobs in the province are tied to U.S. trade. Alberta is another key province to flag given its energy concentration. There’s speculation that Trump may give Canadian oil a “carve out” from tariffs to prevent rising gasoline prices for American consumers, but still, there are over 300k jobs in Alberta tied to exports.
What President Trump ultimately implements is highly uncertain. Our baseline assumption is that Canada avoids blanket tariffs and instead faces temporary sector-specific threats as leverage for broader negotiations. However, we must also prepare for a worst-case scenario: a blanket 25% tariff with Canadian retaliation. Such an outcome would almost certainly push the Canadian economy into recession, driving the unemployment rate above 8%. However, some of the downside would be mitigated by government action, with discussions well underway on support to affected businesses and consumers. The Bank of Canada would also create a cushion by accelerating rate cuts, as would an inevitably weaker currency. A larger interest rate gap with the U.S. and the nature of this risk could cause the Loonie to test the historical low of 62 U.S. cents. This would also provide a cushion for Canadian exporters.
This is the playing field for Canada. The country faced similar risks in 2016, when Trump defied economic logic by igniting a trade war with China and imposing tariffs on specific Canadian exports. While fears were running high and many forecasters slashed their GDP outlooks, the economic impact was less severe than anticipated, as Trump’s goal was to secure a deal.
This time, Canadian officials must be strategic. Short-term supports may be necessary to assist industries and workers, but the government cannot miss acting on long-term opportunities. This crisis creates a burning platform that could enable bold action to build out Canada’s competitive advantages, such as reducing regulatory barriers/red tape, and improve tax competitiveness to incent business investment.
As the old Churchill saying goes: “Never let a good crisis go to waste”.
U.S. – The U.S. Economy Sails into Trump’s Presidency at Cruising Speed
This week was the final “quiet period” before a storm of headlines and announcements from the White House next week, following Trump’s inauguration. The incoming president inherits a robust economy, with this week’s data confirming that momentum remained strong through the end of last year.
Building on last week’s unexpectedly strong job gains, the retail sales report added more good news, signaling strong consumer spending over the holiday season. Retail sales rose by 0.6% in December, following a 0.9% gain in November. The “control group”—which excludes volatile categories like gasoline, autos, and building supplies—showed even stronger growth at 0.7%. Growth was broad-based, with especially strong spending on discretionary items like furniture, clothing, and sporting goods.
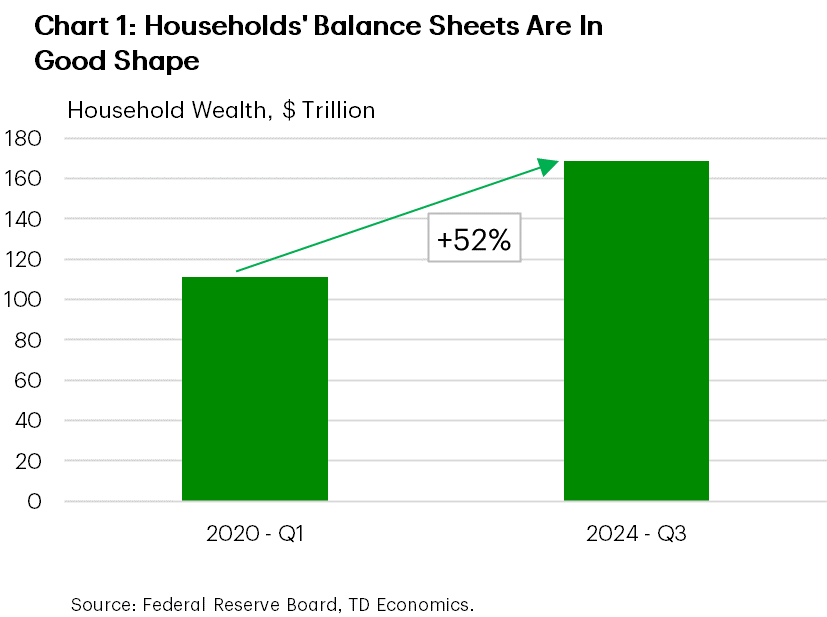
Anecdotal evidence from the Fed’s Beige Book, released this week, confirmed robust consumer spending at year-end, noting that “consumer spending has moved up moderately, with most districts reporting strong holiday sales that exceeded expectations.” This suggests that consumers ended 2024 on a high note, and it’s easy to see why. The labor market remained strong, continuing to add jobs at a good clip, while inflation has subsided (particularly in the goods category), and household wealth remains elevated (Chart 1). Even with recent volatility in the equity market, the S&P 500 is still up some 25% from a year ago. All in all, we expect inflation-adjusted consumer spending to rise somewhere in 3%-3.5% range for the fourth quarter, roughly in line with the previous quarter. Homebuilding activity also ended 2024 on a high note, breaking a three-month streak of declining housing starts.
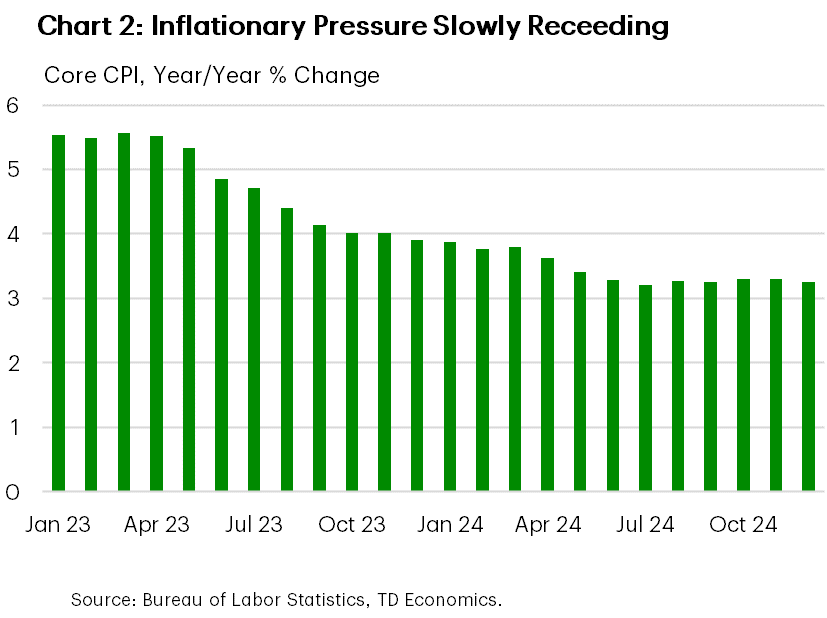
This week’s CPI report provided a bit of good news on the inflation front, alleviating some concerns that had flared in recent months. Core CPI (excluding food and energy) increased by 0.2% from the previous month, and the 12-month inflation rate edged down to 3.2%, after holding at 3.3% for three consecutive months (Chart 2). However, this is unlikely to affect the Fed’s decision at its next meeting on January 29th. For one, CPI is not the Fed’s preferred inflation gauge; that’s the core PCE deflator, and the December PCE data won’t be available before the Fed’s next rate decision. Additionally, there’s nothing in the recent data that would prompt the Fed to change course, especially with inflation risks from Trump’s economic policies.
Fed speakers this week reiterated that the economy is performing well. FOMC member Barkin noted, “you keep seeing good numbers on retail sales, unemployment, and the like… Demand is good, solid, fine.” While the FOMC member Williams stated that the monetary policy is in “a very good position”, and the Fed “can take the time to analyze the incoming data”. Given the potential policy shifts under the new administration, the Fed will have plenty to assess in the coming months.
Weekly Economic & Financial Commentary: FOMC Likely to Enter an Extended Pause in Its Recent Easing Cycle
Summary
United States: Riding the Wave
- The Consumer Price Index ended the year at 2.9% year-over-year, which is a minor improvement from its 3.1% rate in January 2024 and points to stalled progress on the road back to the Federal Reserve's 2% inflation target. We now look for only two 25 bps rate cuts in the second half of 2025 and expect the FOMC to hold at a target range of 3.75%-4.00% through 2026.
- Next week: Leading Economic Index (Wed.), Existing Home Sales (Fri.)
International: China's Economy Finished 2024 on a Solid Note, but Challenges Remain
- China's economy finished 2024 on a sturdy note, with policy support measures helping to boost activity late last year. Q4 GDP firmed more than expected to 5.4% year-over-year, while December activity data also showed an acceleration in retail sales and industrial output. We still expect 2025 to be a challenging year, however, with higher U.S. tariffs weighing on China's export sector and domestic growth unlikely to be sustained unless the government announces large-scale fiscal stimulus.
- Next week: Canada CPI (Tue.), Bank of Japan Policy Rate (Fri.), Eurozone PMIs (Fri.)
Interest Rate Watch: FOMC Likely to Enter an Extended Pause in Its Recent Easing Cycle
- We share the widely-held expectation that the FOMC will maintain its current target range of 4.25%-4.50% for the federal funds rate at its upcoming meeting on January 29. We also think the FOMC will keep rates on hold until the second half of the year before easing again.
Topic of the Week: Beige Book Shows Moderate Expansion Across All Districts
- The latest Beige Book revealed a picture of continued economic growth, with all 12 of the regional banks reporting a “slight” to “moderate” expansion in activity over the period. Employment across the Districts was resilient, and prices broadly rose. Tariffs clouded the economic outlook for many contacts.
Canadian Inflation and Business Outlook Survey to Reveal More Economic Softening
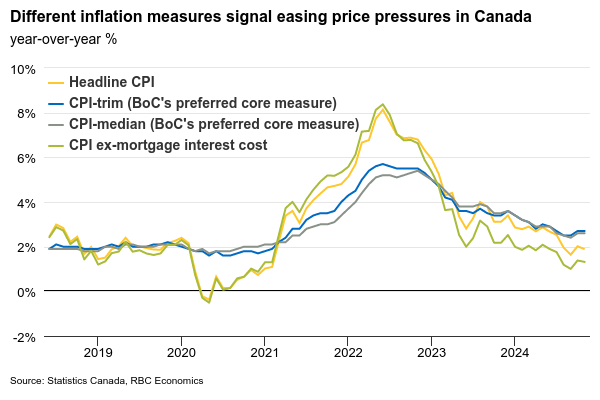
The final consumer price index report for 2024 on Tuesday will be closely watched for further signs of easing in underlying price pressures in Canada, but we expect the data will be distorted by the GST holiday that began on Dec. 14. It applied to a subset of consumer purchases including some groceries, toys, and restaurant meals.
We expect headline inflation to edge down in December to 1.5% from 1.9% year-over-year. This slowdown was largely driven by slower food price growth, which offsets an increase in energy inflation. Excluding those two volatile components, we look for core inflation to remain steady at 1.9%.
The Bank of Canada’s preferred “core” measures are calculated from price data that is adjusted to exclude the impact of indirect taxes, which means they should be cleaner reads. We expect the trim and median measures to hover around 2 ½ %, consistent with a softening economy that continues to weigh on domestic price pressures.
Mortgage interest costs continue to disproportionately impact total CPI growth, and also have an impact on the core measures, but are expected to continue to slow with a lag from the BoC interest rate cuts last year. By our count, year-over-year growth in median and trim measures would have been 0.5% lower on averrage in November (2.2% and 2.1%, respectively) if mortgage interest costs weren’t included in the calculation.
The release of the BoC’s Business Outlook Survey for Q4 is also out on Monday. We think inflation expectations likely continued to moderate, given readings have stayed near the central bank’s 2% target for four consecutive months. With job openings declining—a sign of weakening hiring demand—expected wage growth should slow further. The BoC will be paying close attention to any further deterioration in key capacity pressures such as labour shortages and supply chain disruptions. Those could signal a deeper economic slowdown, a wider economy output gap, and disinflationary risks going forward.
Week ahead data watch
On Thursday, we expect Canadian retail sales to hold steady in November in line with Statistics Canada’s advance estimate. Seasonally adjusted auto sales jumped 8%, while sales at gas stations likely bounced back in November due to higher prices. But weak core sales are expected to offset the growth.
Week Ahead – Markets on Edge as Trump’s Inauguration and BoJ Decision Loom
- Markets brace for impact ahead of Trump’s inauguration.
- BoJ seen raising rates at first gathering of 2025.
- Euro and Pound traders turn gaze to PMIs.
- Canada and New Zealand CPI data to shape BoC and RBNZ bets.
- World Economic Forum in Davos also in focus.
Trump takes the oath of office
Another interesting week lies ahead of us, with the spotlight falling on the inauguration of US president-elect Donald Trump on Monday, and on the BoJ, which is kickstarting the first round of central bank decisions for 2025 on Friday.
Getting the ball rolling with Trump and the US, the dollar has benefited and Treasury yields have surged lately on increasing expectations that the Fed may need to proceed with extra caution on rate cuts this year. Trump’s tariff pledges and his promises of corporate tax cuts and deregulation have raised concerns about a resurgence of inflation, which has been proving sticky even before such policies are enacted. What’s more, the US economy seems to be firing on all cylinders, with the labor market seeing strong growth in November and December, corroborating the notion that there is no need for the Fed to rush into lowering interest rates further.
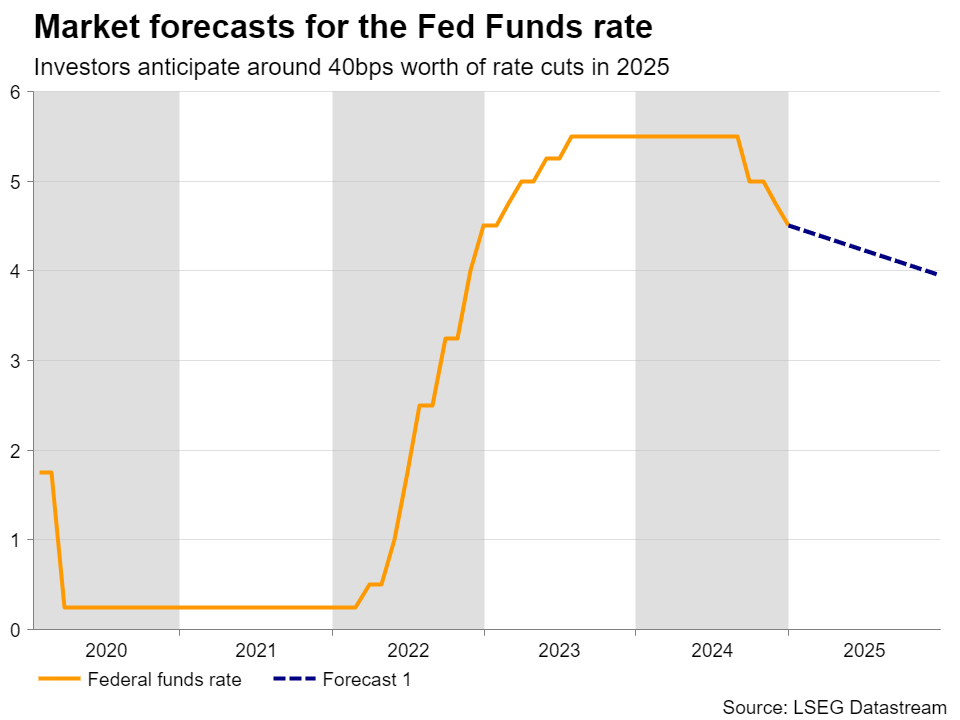
According to Fed funds futures, investors are currently expecting 40bps worth of reductions by December 2025, which is a more hawkish projection than the Fed’s own upwardly revised ‘dot plot’, which pointed to two 25bps reductions. And this is even after news headlines suggested that the new US administration is likely to adopt a gradual approach on tariffs and after the US CPI numbers for December came in somewhat softer-than-expected.
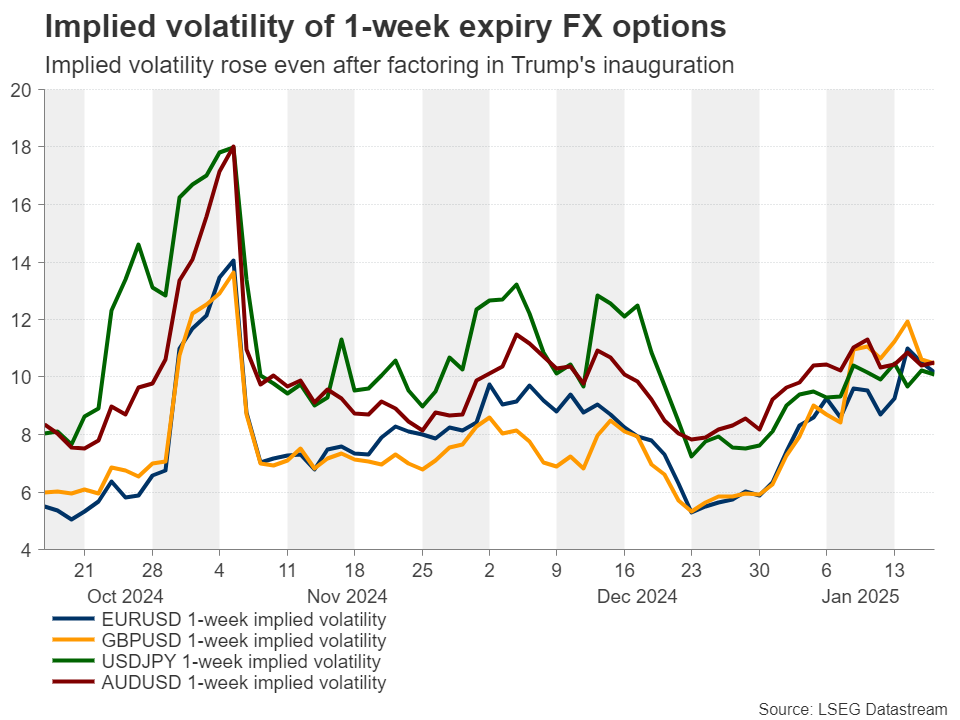
With all that in mind, investors may be eagerly awaiting Trump’s inauguration speech for more clues about how he plans to proceed with his policies, and this is evident by the fact that the implied volatility of 1-week expiry FX options has been trending north and has continued to rise even after factoring in Monday’s inauguration. In other words, market participants see the event as a source of volatility for the FX market.
Should Trump sound more hawkish on tariffs than the latest headlines suggest, the dollar is likely to take another shot in the arm as Treasury yields rebound. A potentially risk-averse mood could also weigh on equities, specifically stock futures, as the New York Stock Exchange will remain closed in celebration of Martin Luther King Day. However, whether any declines will be sustained will also depend on whether Trump will bolster the hype about extending corporate tax cuts, which is a supportive variable.
Stock traders will have more to digest the following day as Netflix will report its earnings results for the last quarter of 2024.
Will the BoJ hike rates right off the bat?
Flying to Japan, the BoJ will kickstart the first round of central bank decisions for 2025 on Friday. At its last meeting for 2024, the BoJ decided to refrain from hiking interest rates, with Governor Ueda saying that they need more information to raise interest rates again, placing emphasis on wages and the uncertainty surrounding US president-elect Trump’s economic policies.
Since then, data revealed that the Nationwide CPI accelerated notably in November, while the closely watched Tokyo prints pointed to even hotter price pressures in December. Wages also sped up in November. What’s more, the Summary of Opinions from the December gathering suggested that a hike may be on the cards sooner than investors were led to believe following Ueda’s press conference.
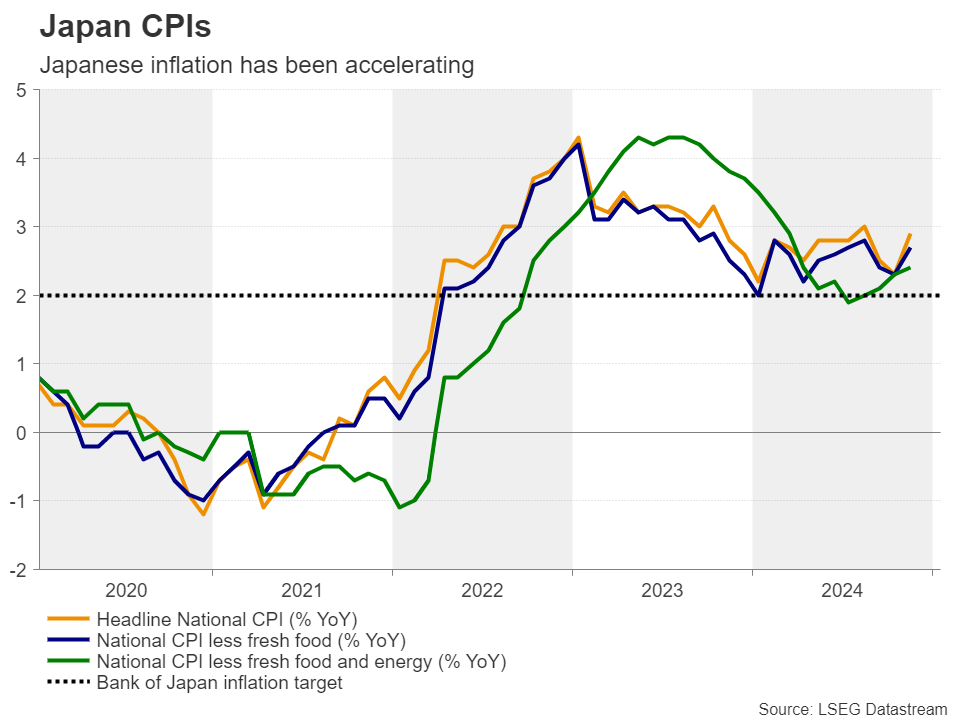
Combined with hawkish remarks by several policymakers thereafter, including Ueda this week, who said that he heard many encouraging views on potential pay hikes since the turn of the year, the aforementioned developments prompted investors to pencil in around an 80% chance of a quarter-point interest rate increase on Friday.
Having said that though, the BoJ has a strong record of disappointing hawkish bets, and this may be another one of those occasions if president-elect Trump sounds too aggressive about his tariff plans at his inauguration speech on Monday. Therefore, if the Bank refrains from hitting the hike button once again, the yen is likely to tumble.
The opposite could be true should policymakers agree to hike, but the risks may be asymmetrical. The negative impact on the yen if the Bank were to stay on hold may be larger than the positive impact associated with a hike. Nonetheless, a falling yen may not be the easiest trade in town as further declines may encourage a new round of intervention by Japanese authorities.
January PMIs the drivers for Euro and Pound
From the Eurozone and the UK, the preliminary S&P Global PMIs for January are coming out on Friday. The euro and the pound have been bleeding recently, with the former falling victim to the widening divergence in monetary policy expectations between the ECB and the Fed and the latter feeling the heat of fears about a Truss 2.0 episode as well as the latest round of weak UK data. Just this week, the softer-than-expected inflation data for December was followed by weak GDP, December retail sales, and industrial production numbers for November.
Both the ECB and the BoE are expected to cut interest rates more aggressively than the Fed this year, with the former seen cutting another 95bps and the latter another 60bps. Thus, PMIs pointing to more troubles for the Eurozone and UK economies could further widen the policy divergence between the ECB and the BoE with the Fed and thereby deepen the wounds of the euro and the pound.
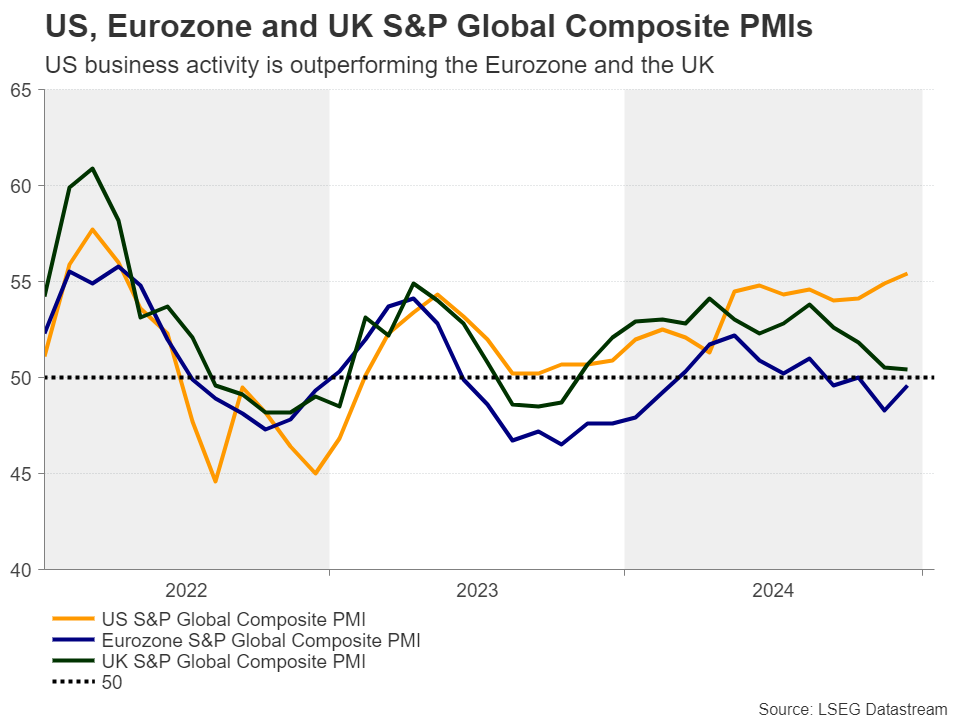
The US S&P Global PMIs will also be released on the same day, but dollar traders will be already digesting Trump’s policy signals and thus, the impact of those numbers may be limited and short-lived.
Loonie and Kiwi traders await CPI reports
Following this week’s US CPI figures, Canada and New Zealand are scheduled to release their own inflation prints on Tuesday. The Canadian jobs report for December revealed strong employment gains, with the unemployment rate unexpectedly dropping. Still, investors are assigning a decent 65% for the BoC to cut interest rates by another 25bps on January 29. For that probability to be lowered meaningfully, Canada’s CPI numbers may need to come in hotter-than-expected, which could encourage loonie traders to increase their long positions. A positive business outlook survey by the BoC on Monday may also help.
In New Zealand, a February rate cut seems to be a done deal. The question is whether it will be a quarter- or a half-point cut. At their November gathering, RBNZ policymakers cut the cash rate by 50bps and signaled that if economic conditions continue to evolve as projected, they could lower the OCR further early in 2025.
Since then, GDP data revealed that the economy slipped into technical recession in Q3, allowing investors to assign a strong 65% chance that another bold 50bps reduction may be looming, especially as inflation rested at 2.2% y/y in Q3, very close to the midpoint of the Bank’s 1-3% target range.
Ergo, should next week’s data reveal that inflation returned, or even fell below that 2% midpoint, market participants may start considering a larger 75bps reduction, and the kiwi could resume its prevailing steep downtrend against its US counterpart.
Global leaders gather in Davos
Elsewhere, the World Economic Forum in Davos, Switzerland will take place. The meeting gets underway the same day with Trump’s inauguration and thus, Trump is expected to deliver a speech virtually on Thursday. Other speakers include Ukrainian President Zelenskyy, who will attend in person and speak on Tuesday.
Geopolitical tensions will be one of the main topics at the gathering, and thus, it will be interesting to see what risks global leaders foresee for their economies this year. Their views on Trump’s agenda may be closely monitored as well, while artificial intelligence will also be a key topic of discussion.
Weekly Focus – All Eyes on Trump’s Inauguration Day
The bond market sell-off stabilised ahead of Donald Trump's inauguration on Monday, as the December core inflation data from the US came out on the soft side (+0.2% m/m SA, Nov. +0.3%). Easing hotel, core goods and health care inflation contributed to the cooling but importantly, broader housing and non-housing services inflation remain at moderating trends as well. The move gained further momentum on Thursday, when the Fed's influential Chistopher Waller flagged that three or four rate cuts could be possible this year if 'data cooperates'. While Trump's election win has brought inflation fears firmly back to markets' agenda, we find little reason for concern in the hard data received so far, and still think the Fed will continue cutting rates in March. Read more from Global Inflation Watch - Hard data signals continuing disinflation, 16 January.
Most of our central bank views remain on the dovish side of market pricing even after this week's rally. This also implies further downside potential to bond yields on both sides of the Atlantic. In our updated forecasts, we now see 10y Bund yield at 2.25% in 12M horizon and maintain 10y UST yield view at 4.20%, read more from Yield Outlook - The pendulum has swung too far, 13 January. We also tweaked our call for Riksbank, and now see the next cut already at the upcoming January meeting, see RtM Sweden, 17 January.
On the geopolitical front, the fear of Trump allowing 'all hell to break out' motivated Israel and Hamas to finally agree on a ceasefire set to begin on Sunday. The actual content of the deal has not changed much from preliminary plans, and the implementation remains uncertain. Importantly, the future governance of Gaza remains an open question.
Next week, all eyes will be on which executive orders Trump enacts once he enters the White House. Rumoured topics of up to 100 separate orders include everything from tariffs to immigration to regulation and more. For the near-term macro-outlook and markets, any new announcements on tariffs will be the key to follow. The mixed signals heard from news sources and Trump himself over the past weeks suggest there is at least some level of internal disagreement within the Republican party over the topic. Our best guess is that any announcements made next week would be limited to targeted tariffs against specific countries and/or goods. We would expect any broader universal tariffs to be announced only at a later stage.
The upcoming week will be a relatively quiet one in terms of macro data. The most important release will be the January Flash PMIs on Friday, where we expect the euro area composite index to recover back to the neutral level of 50.0 (Dec. 49.6). We expect some improvement to both manufacturing and services indices. The former will still likely remain well below 50, which means production continues to contract, but just at a slower pace.
Early Friday morning, we expect the Bank of Japan to hike rates by 25bp. Analysts are divided between no change and a hike while markets price in nearly 80% probability of a hike at the time of writing. The latest December CPI data is due for release just before the monetary policy decision. This week, we recommended a short USD/JPY position as part of our annual FX Top Trades 2025, 14 January.