Sample Category Title
EUR/USD Daily Outlook
Daily Pivots: (S1) 1.0270; (P) 1.0293; (R1) 1.0324; More...
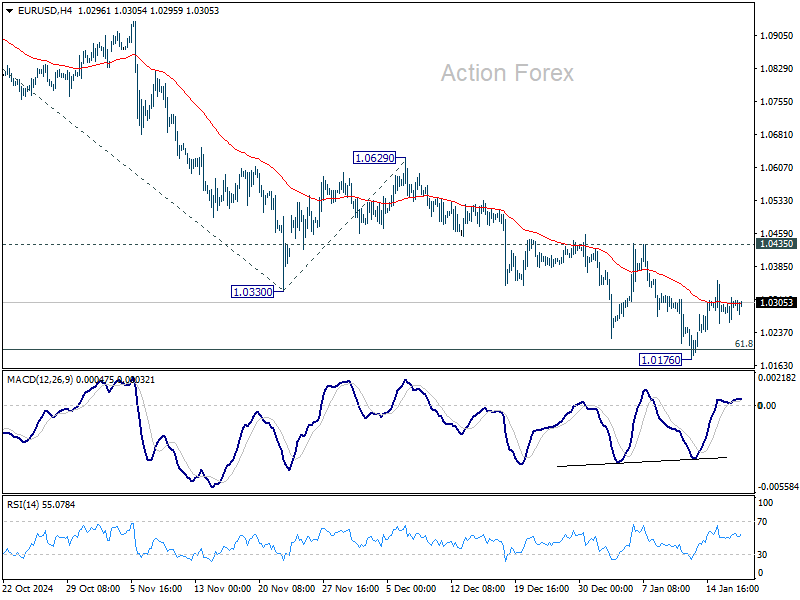
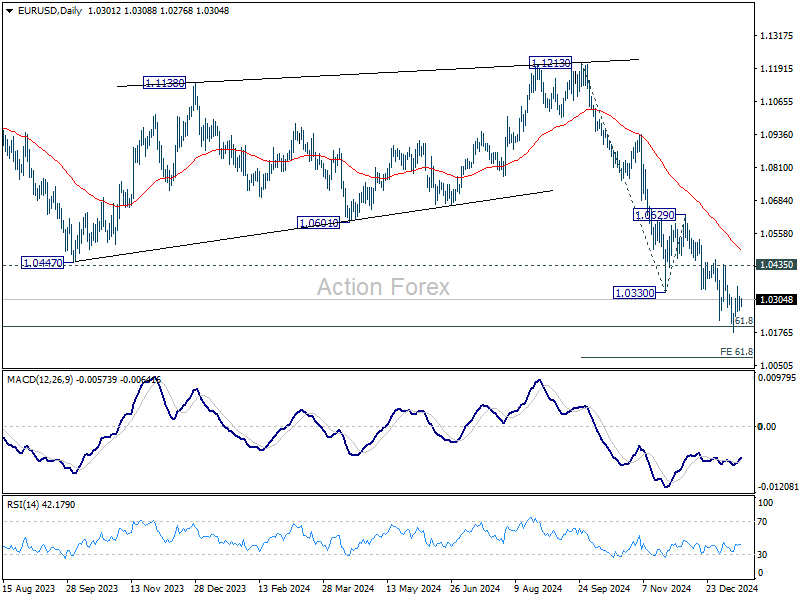
EUR/USD is staying in consolidation above 1.0176 and intraday bias stays neutral. With 1.0435 resistance intact, outlook remains bearish and further decline is expected. On the downside, break of 1.0176 will resume the fall from 1.1213 and target 61.8% projection of 1.1213 to 1.0330 from 1.0629 at 1.0083. However, considering bullish convergence condition in 4H MACD, firm break of 1.0435 will confirm short term bottoming, and turn bias back to the upside for stronger rebound.
In the bigger picture, fall from 1.1274 (2023 high) should either be the second leg of the corrective pattern from 0.9534 (2022 low), or another down leg of the long term down trend. In both cases, sustained break of 61.8 retracement of 0.9534 to 1.1274 at 1.0199 will pave the way back to 0.9534. For now, outlook will stay bearish as long as 1.0629 resistance holds, even in case of strong rebound.
USD/JPY Daily Outlook
Daily Pivots: (S1) 154.59; (P) 155.63; (R1) 156.15; More...
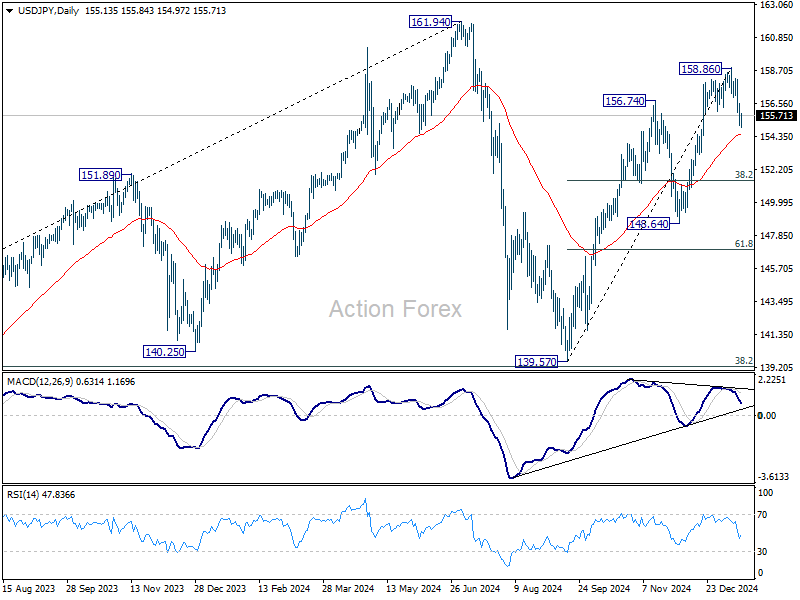
USD/JPY's fall from 158.86 short term top is in progress and intraday bias stays on the downside for 55 D EMA (now at 154.51). Firm break there will target 38.2% retracement of 139.57 to 158.86 at 151.49 next. On the upside, above 156.34 minor resistance will turn intraday bias neutral again first. But risk will stay on the downside as long as 158.86 resistance holds, in case of recovery.
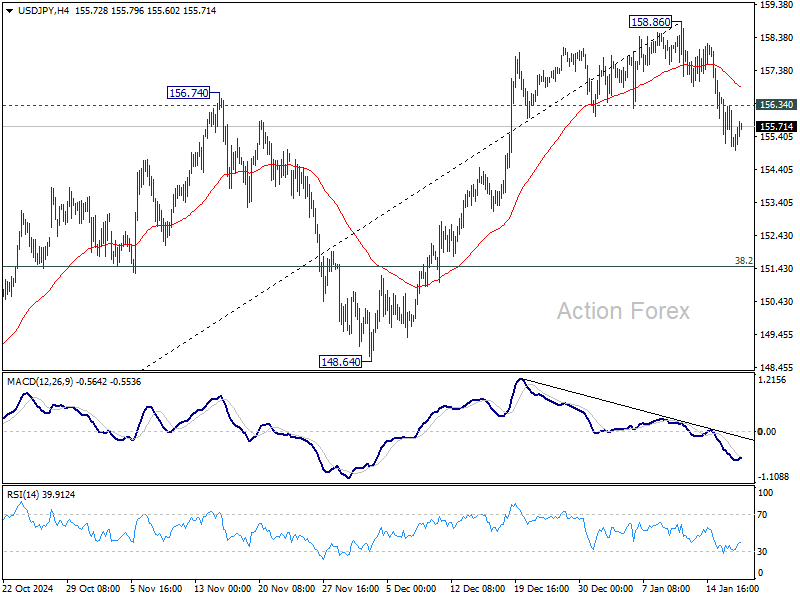
In the bigger picture, price actions from 161.94 are seen as a corrective pattern to rise from 102.58 (2021 low). The range of medium term consolidation should be set between 38.2% retracement of 102.58 to 161.94 at 139.26 and 161.94. Nevertheless, sustained break of 139.26 would open up deeper medium term decline to 61.8% retracement at 125.25.
GBP/USD Daily Outlook
Daily Pivots: (S1) 1.2188; (P) 1.2225; (R1) 1.2274; More...
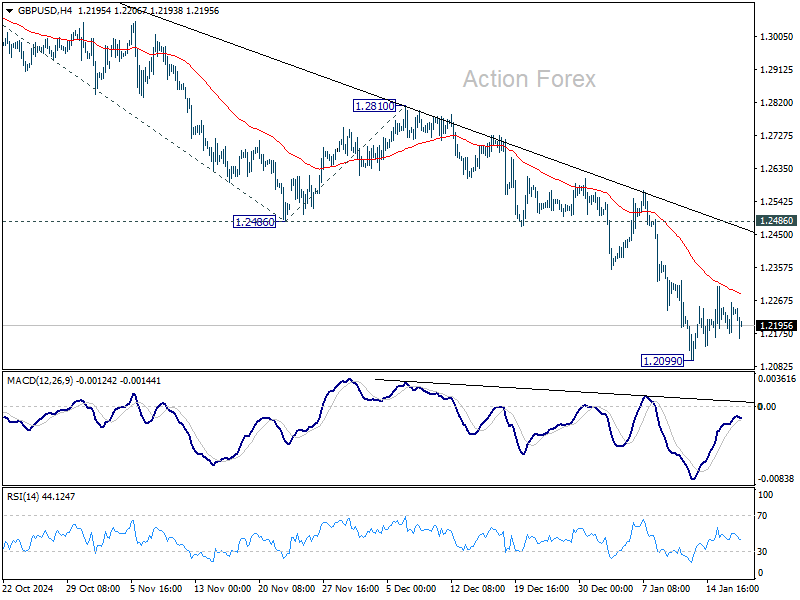
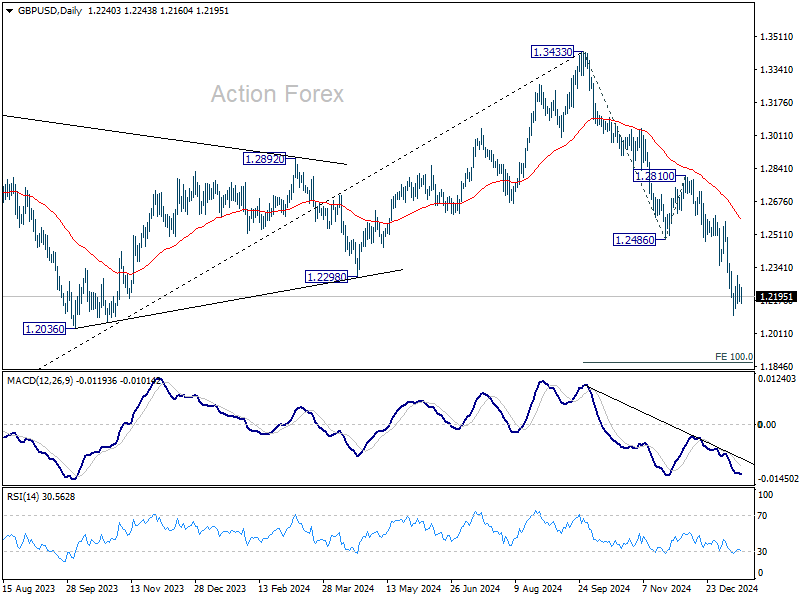
Intraday bias in GBP/USD remains neutral as consolidation continues above 1.2099. Outlook remains bearish with 1.2486 support turned resistance intact. Larger fall from 1.3433 is still expected to continue. On the downside, break of 1.2099 will resume the decline to 100% projection of 1.3433 to 1.2486 from 1.2810 at 1.1863.
In the bigger picture, rise from 1.0351 (2022 low) should have already completed at 1.3433, and the trend has reversed. Further fall is now expected as long as 1.2810 resistance holds. Deeper decline should be seen to 61.8% retracement of 1.0351 to 1.3433 at 1.1528, even as a corrective move.
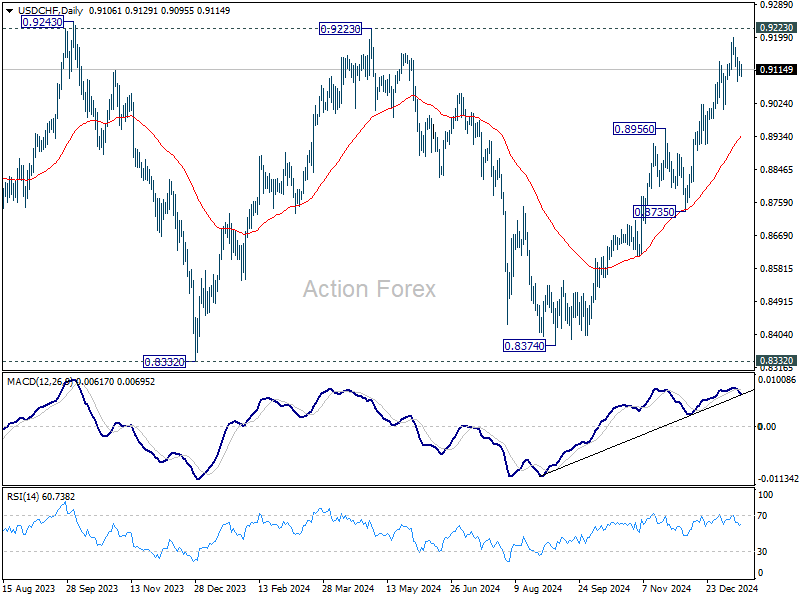
USD/CHF Daily Outlook
Daily Pivots: (S1) 0.9092; (P) 0.9116; (R1) 0.9132; More…
USD/CHF is staying in consolidation below 0.9200 and intraday bias remains neutral. As long as 0.9007 support holds, near term outlook remains bullish. On the upside, decisive break of 0.9223 will carry larger bullish implications. However, break of 0.9007 will confirm short term topping, and turn bias back to the downside for 55 D EMA (now at 0.8936).
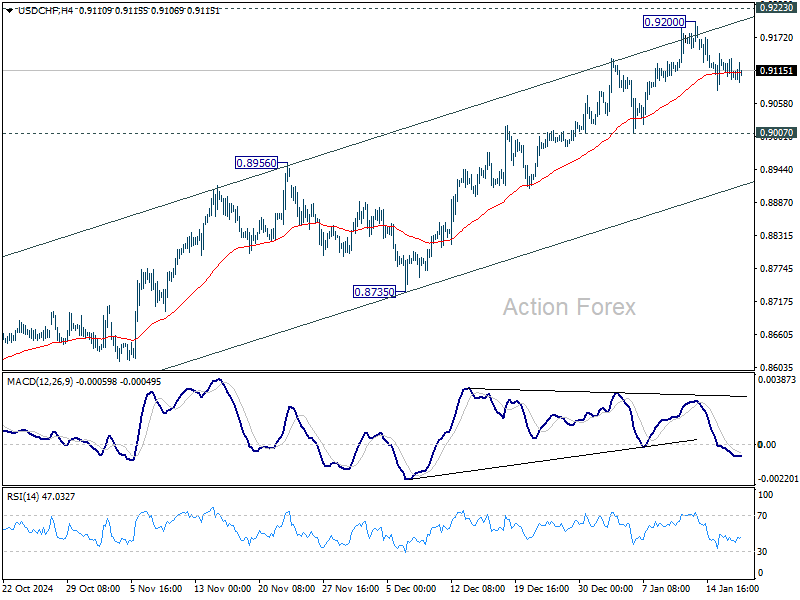
In the bigger picture, price actions from 0.8332 (2023 low) are currently seen as a medium term corrective pattern, with rise from 0.8374 as the third leg. Overall outlook will continue to stay bearish as long as 0.9223 resistance holds. Break of 0.8332 low is in favor at a later stage when the consolidation completes. However, decisive break of 0.9223 will be an important sign of bullish trend reversal.
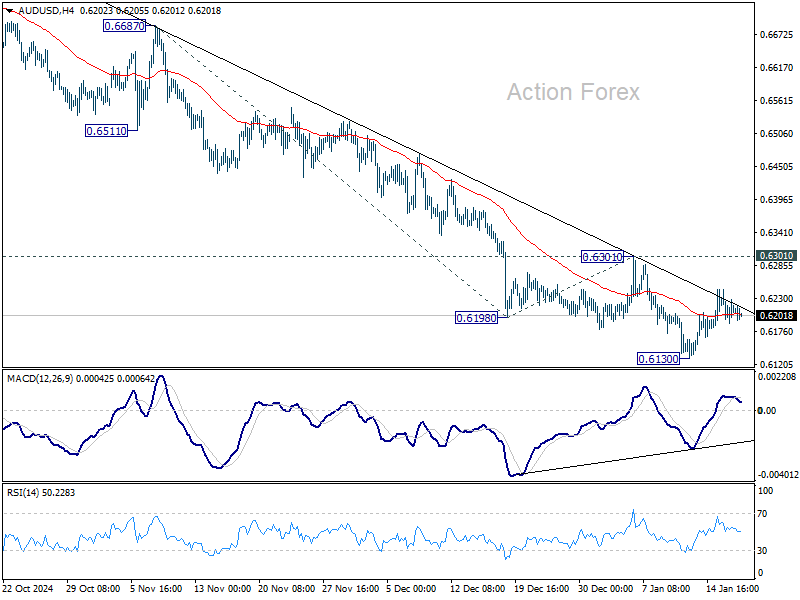
AUD/USD Daily Report
Daily Pivots: (S1) 0.6188; (P) 0.6217; (R1) 0.6243; More...
AUD/USD's consolidation from 0.6130 is extending and intraday bias stays neutral. Further decline is expected as long as 0.6310 resistance holds. Break of 0.6130 will resume the fall from 0.6941 to 61.8% projection of 0.6687 to 0.6198 from 0.6301 at 0.5999. However, considering bullish convergence condition in 4H MACD, break of 0.6310 will indicate short term bottoming, and turn bias back to the upside for stronger rebound.
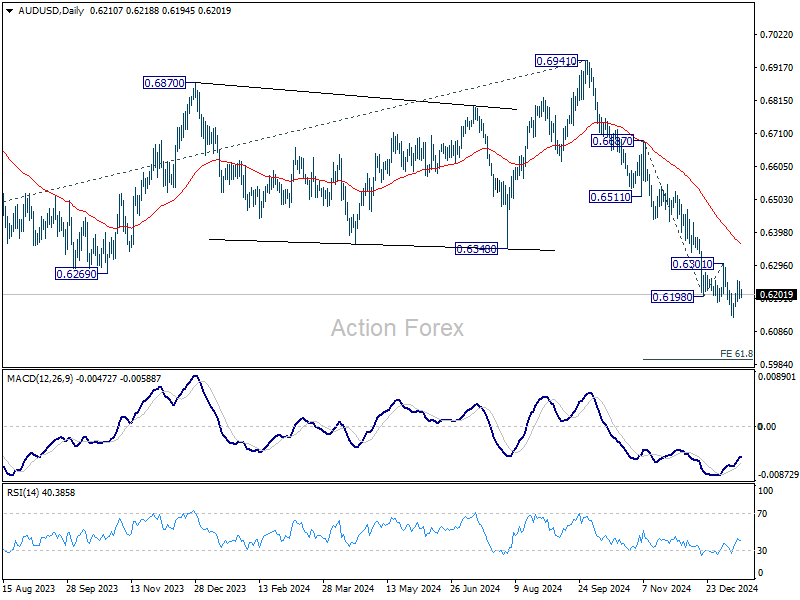
In the bigger picture, down trend from 0.8006 (2021 high) is resuming with break of 0.6169 (2022 low). Next medium term target is 61.8% projection of 0.8006 to 0.6169 from 0.6941 at 0.5806, In any case, outlook will stay bearish as long as 55 W EMA (now at 0.6587) holds.
USD/CAD Daily Outlook
Daily Pivots: (S1) 1.4336; (P) 1.4370; (R1) 1.4427; More...
USD/CAD is still bounded in consolidation below 1.4466 and intraday bias remains neutral. Break of 1.4279 support will bring deeper correction. But downside should be contained by 55 D EMA (now at 1.4187) to bring rebound. On the upside, break of 1.4466 will resume larger up trend to 1.4667/89 long term resistance zone.

In the bigger picture, up trend from 1.2005 (2021) is in progress for retesting 1.4667/89 key resistance zone (2020/2015 highs). Medium term outlook will remain bullish as long as 1.3976 resistance turned holds (2022 high), even in case of deep pullback.

EUR/CHF Daily Outlook
Daily Pivots: (S1) 0.9369; (P) 0.9385; (R1) 0.9398; More....
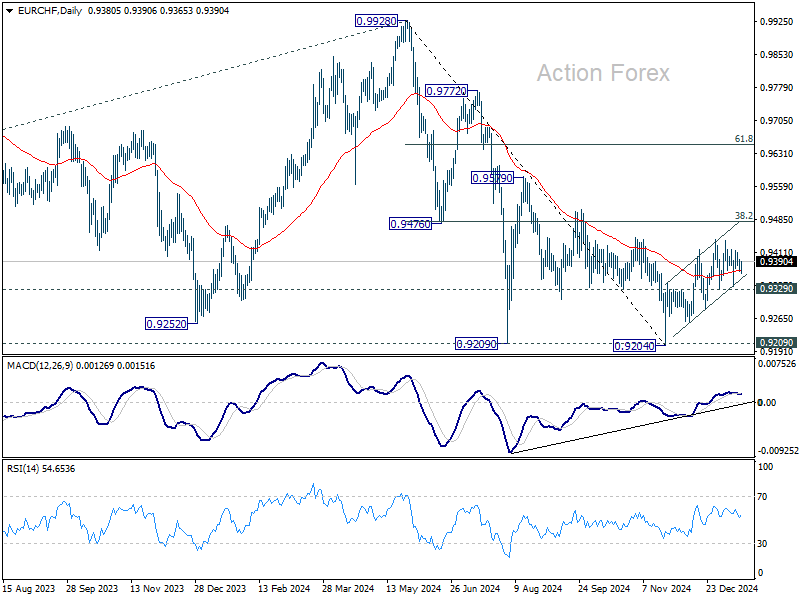
Sideway trading continues in EUR/CHF and intraday bias remains neutral. Corrective rebound from 0.9204 could still extend higher. But upside should be limited by 0.9481 fibonacci resistance. On the downside, firm break of 0.9329 support will argue that the correction has completed, and turn bias back to the downside for 0.9284 support first.
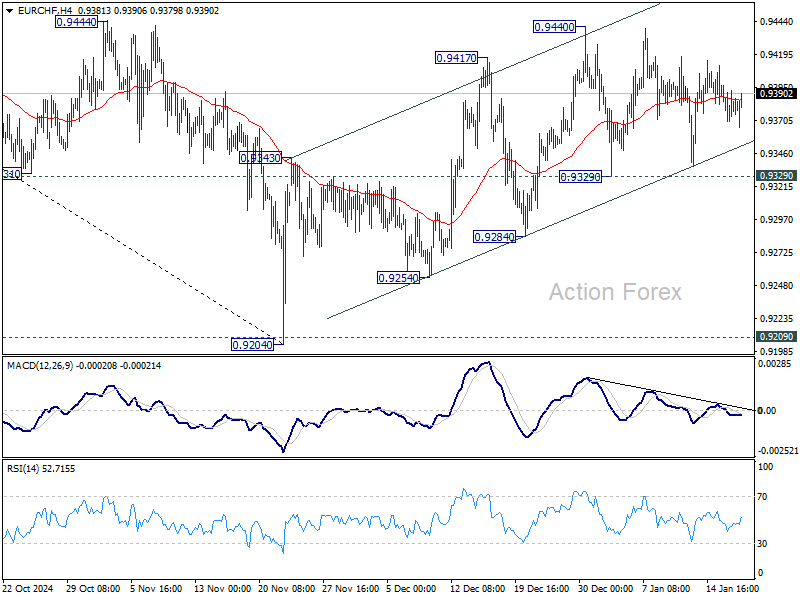
In the bigger picture, while corrective rebound from 0.9204 might extend higher, strong resistance could be seen from 38.2% retracement of 0.9928 to 0.9204 at 0.9481 to limit upside. Down trend from 0.9928 (2024 high) is still in favor to resume through 0.9204/9 support zone at a later stage.
GBP/JPY Daily Outlook
Daily Pivots: (S1) 189.24; (P) 190.39; (R1) 191.01; More...
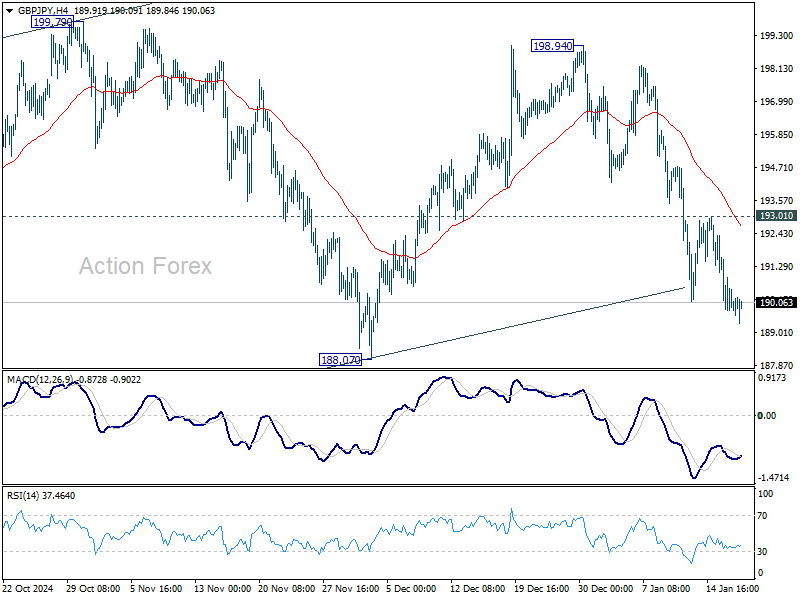
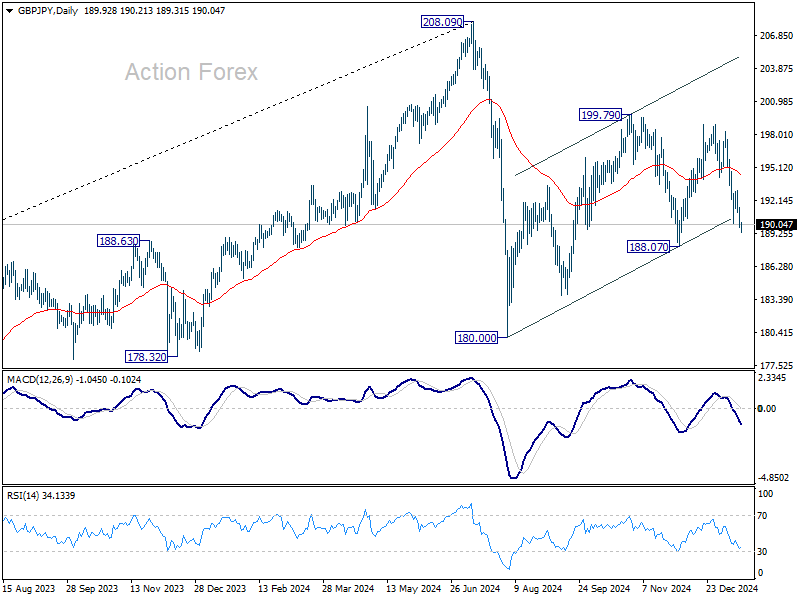
Intraday bias in GBP/JPY remains mildly on the downside for the moment. Fall from 198.94 is in progress for 188.07 support. Firm break there will argue that corrective pattern from 180.00 has finished too, and larger decline from 208.09 might be ready to resume. On the upside, above 193.01 resistance will delay the bearish case and turn intraday bias neutral again.
In the bigger picture, price actions from 208.09 are seen as a correction to whole rally from 123.94 (2020 low). The range of consolidation should be set between 38.2% retracement of 123.94 to 208.09 at 175.94 and 208.09. However, decisive break of 175.94 will argue that deeper correction is underway.
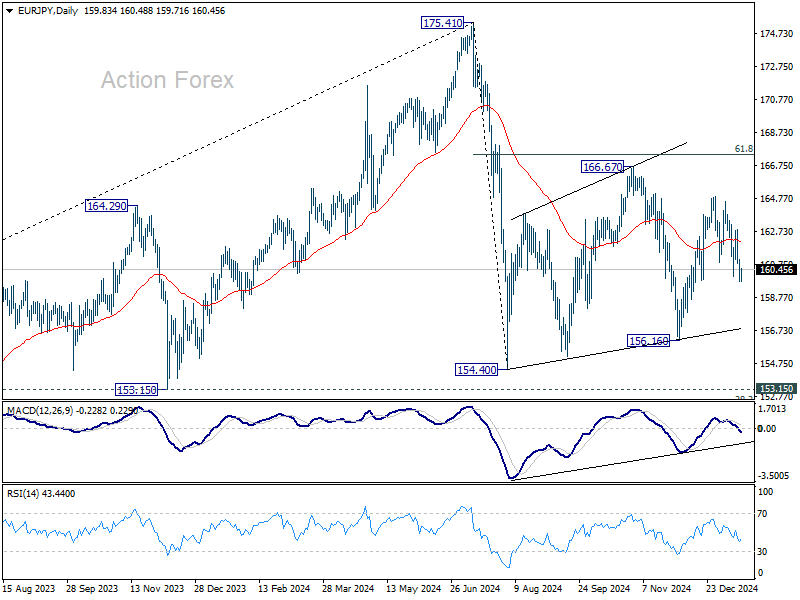
EUR/JPY Daily Outlook
Daily Pivots: (S1) 159.32; (P) 160.23; (R1) 160.72; More...
Intraday bias in EUR/JPY stays mildly on the downside at this point. Fall from 164.89 is in progress for 156.16 support. Firm break there will argue that corrective pattern from 154.40 has completed, and fall from 175.41 is ready to resume. For now, risk will stay on the downside as long as 162.88 resistance holds, in case of recovery.
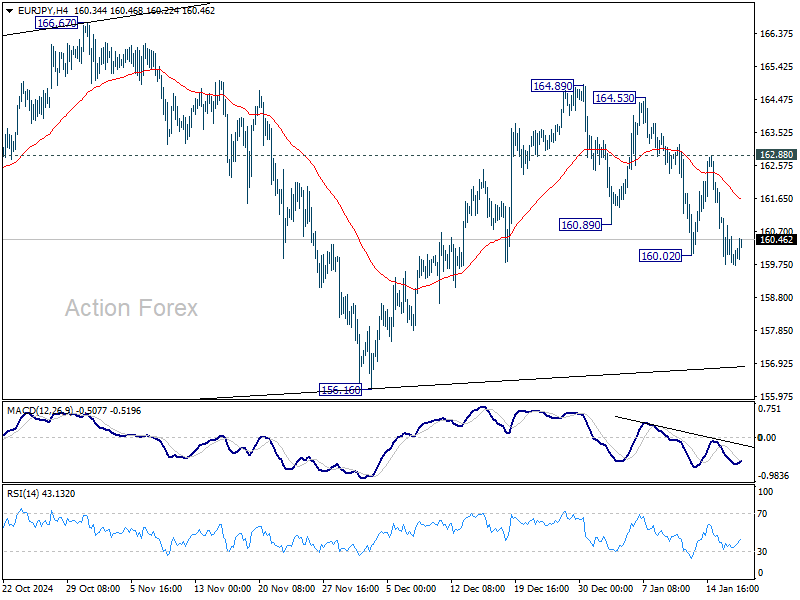
In the bigger picture, price actions from 175.41 are seen as correction to rally from 114.42 (2020 low). The range of consolidation should have been set between 38.2% retracement of 114.42 to 175.41 at 152.11 and 175.41 high. However, decisive break of 152.11 would argue that deeper correction is underway.
EUR/AUD Daily Outlook
Daily Pivots: (S1) 1.6512; (P) 1.6556; (R1) 1.6627; More...
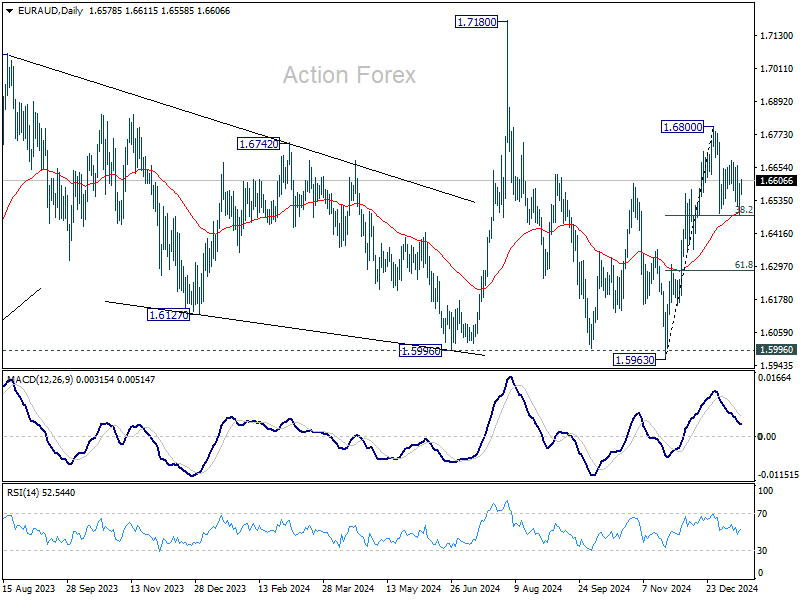
EUR/AUD is still bounded in consolidation from 1.6800 and intraday bias remains neutral. Strong support is expected from 38.2% retracement of 1.5963 to 1.6800 at 1.6480 to contain downside. Firm break of 1.6800 will resume the rally from 1.5963. However, sustained break of 1.6480 will bring deeper correction 61.8% retracement at 1.6283 instead.
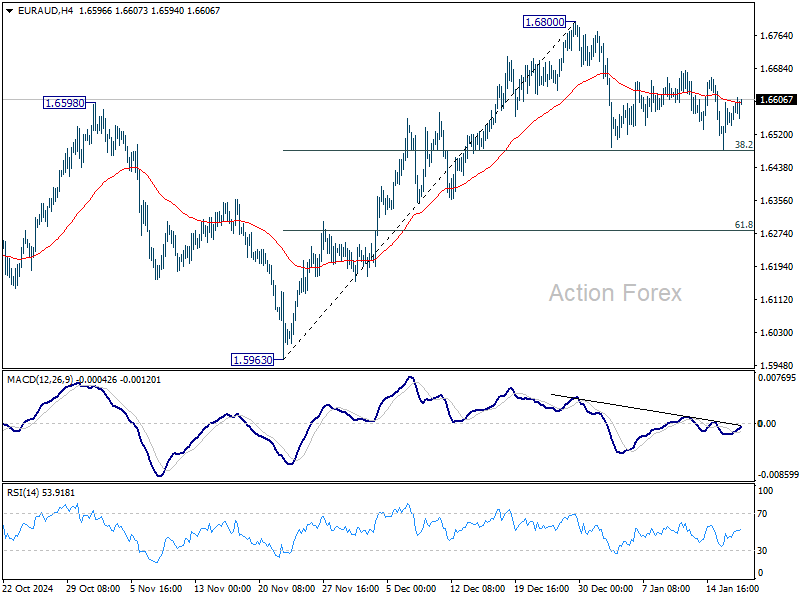
In the bigger picture, EUR/AUD is holding on to 1.5996 key support despite brief breach. Larger up trend from 1.4281 (2022 low) is still in favor to resume through 1.7180 at a later stage. Nevertheless, sustained break of 1.5995 will indicate that such up trend has completed and deeper decline would be seen.