Sample Category Title
EUR/USD Weekly Outlook
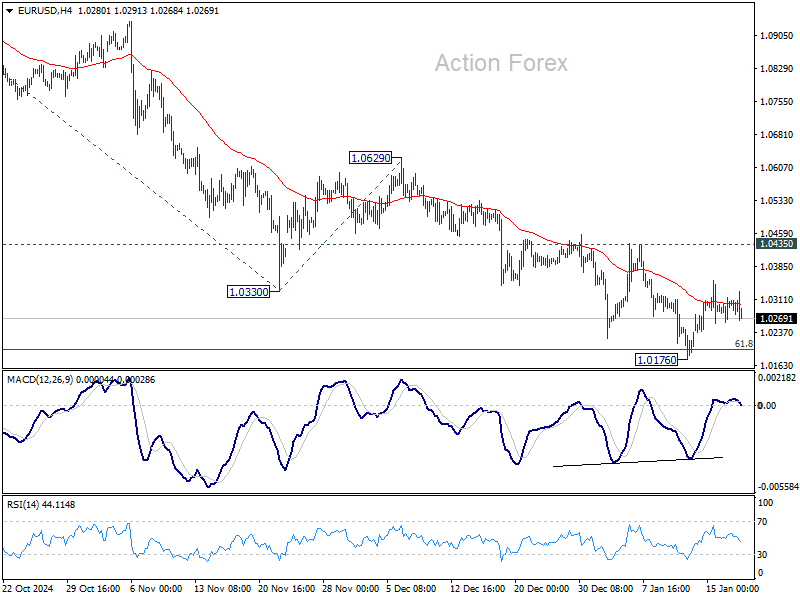
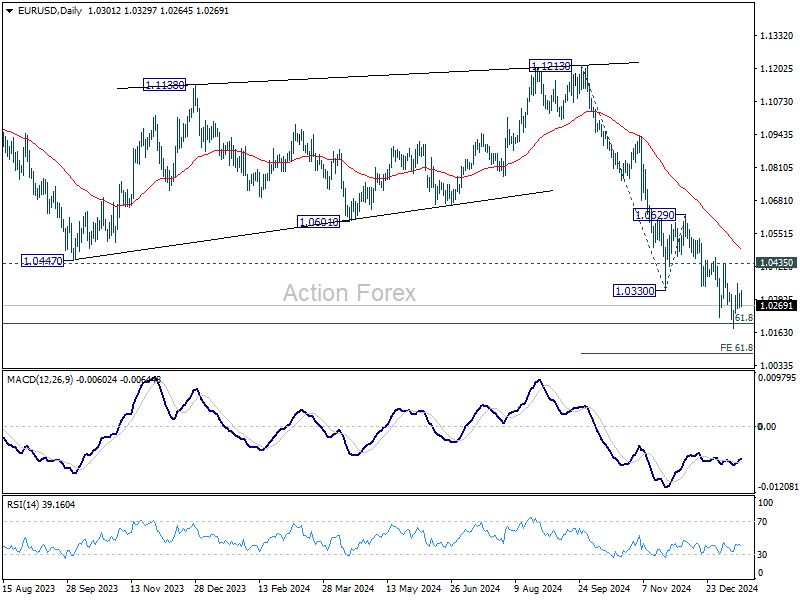
EUR/USD edged lower to 1.0176 last week but recovered after breaching 1.0199 fibonacci level briefly. Initial bias stays neutral this week first and more consolidations could be seen. But outlook will remain bearish as long as 1.0439 resistance holds. On the downside, break of 1.0176 will resume the fall from 1.1213 and target 61.8% projection of 1.1213 to 1.0330 from 1.0629 at 1.0083. However, firm break of 1.0435 will confirm short term bottoming, and turn bias back to the upside for stronger rebound.
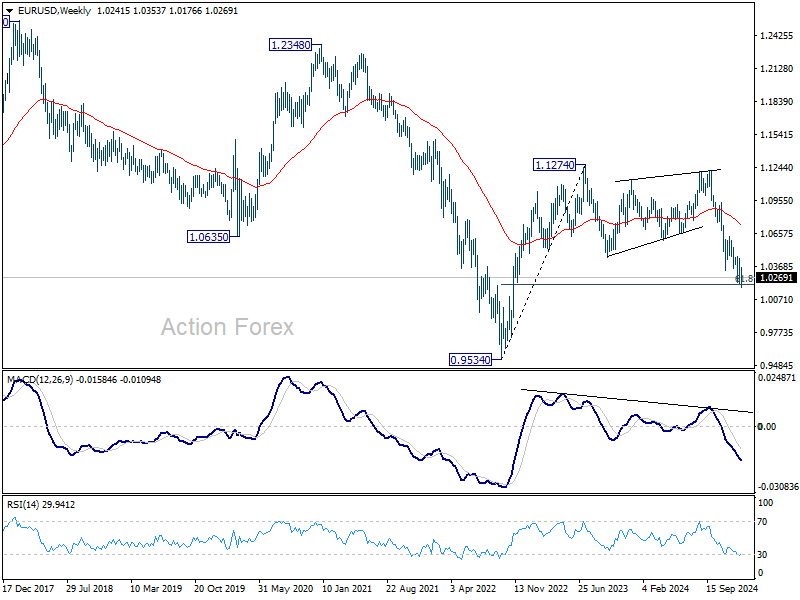
In the bigger picture, fall from 1.1274 (2023 high) should either be the second leg of the corrective pattern from 0.9534 (2022 low), or another down leg of the long term down trend. In both cases, sustained break of 61.8 retracement of 0.9534 to 1.1274 at 1.0199 will pave the way back to 0.9534. For now, outlook will stay bearish as long as 1.0629 resistance holds, even in case of strong rebound.
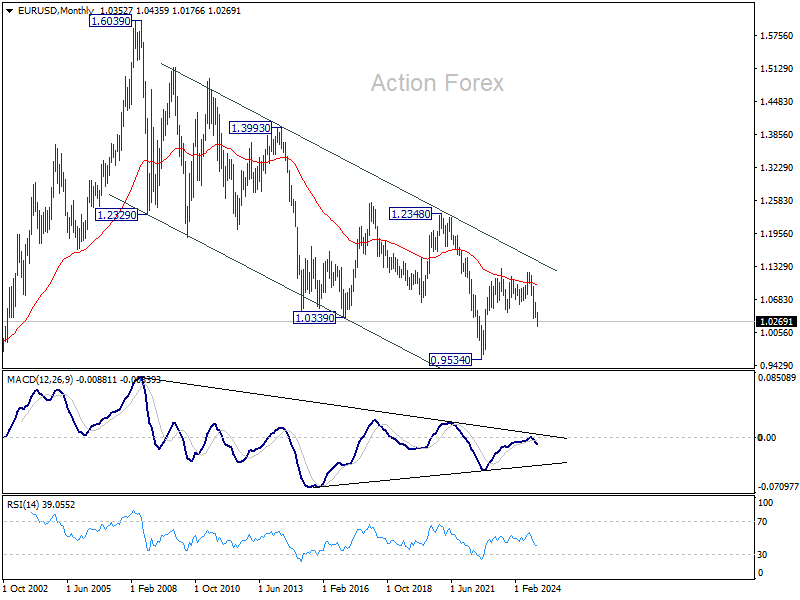
In the long term picture, down trend from 1.6039 remains in force with EUR/USD staying well inside falling channel, and upside of rebound capped by 55 M EMA (now at 1.0973). Consolidation from 0.9534 could extend further and another rising leg might be seem. But as long as 1.1274 resistance holds, eventual downside breakout would be mildly in favor.
USD/JPY Weekly Outlook
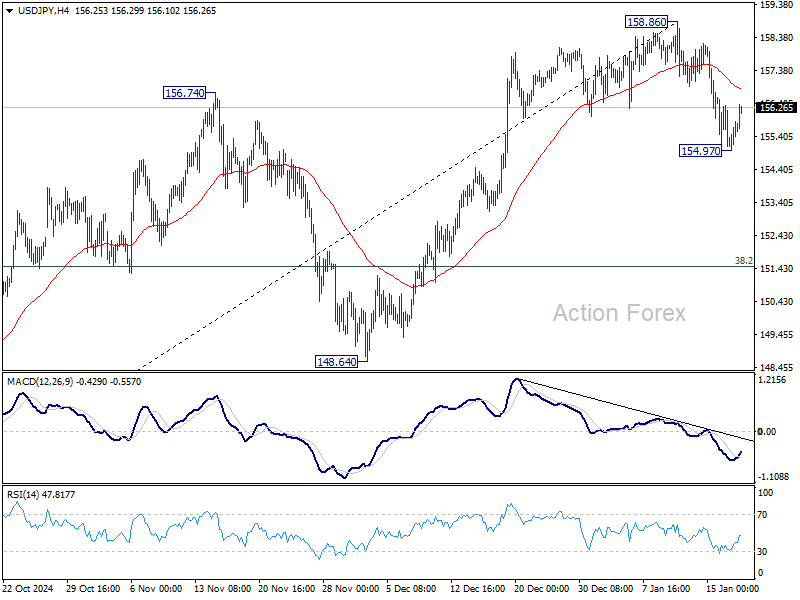
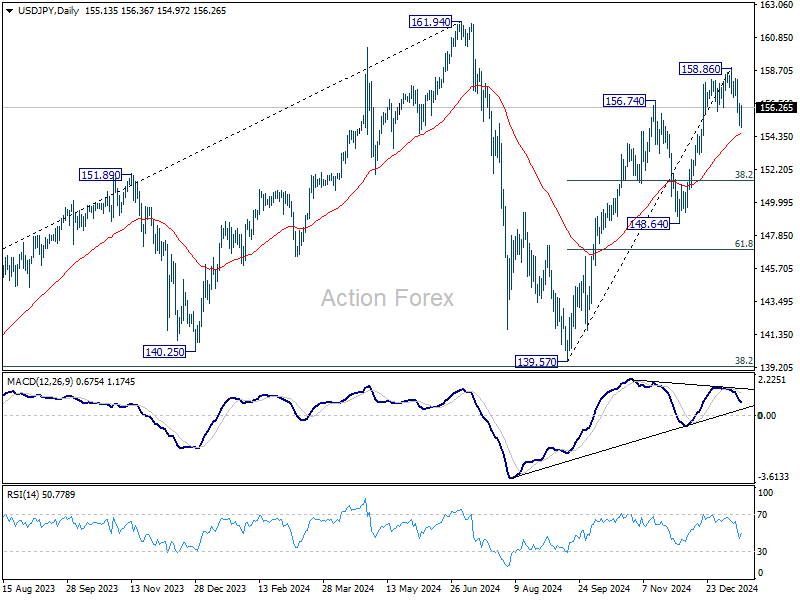
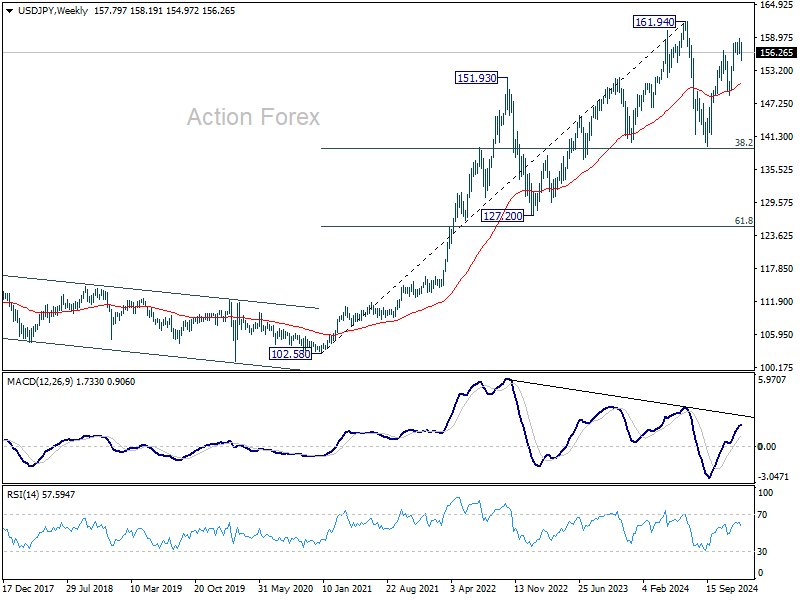
USD/JPY's extended fall last week confirmed short term topping at 158.86. But as a temporary low was formed at 154.97, initial bias is neutral this week first. Risk will stay on the downside as long as 158.86 resistance holds, in case of stronger recovery. Below 154.97 will target 55 D EMA (now at 154.53). Sustained break there will target 38.2% retracement of 139.57 to 158.86 at 151.49 next.
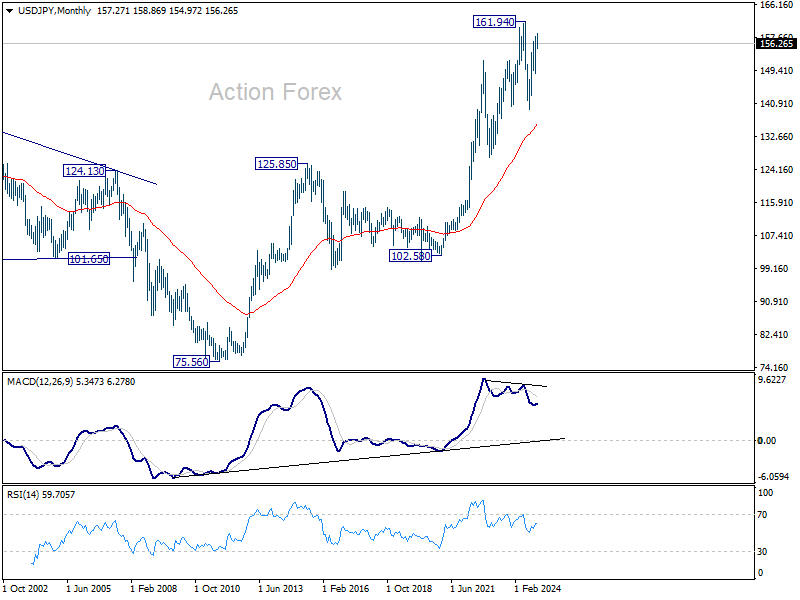
In the bigger picture, price actions from 161.94 are seen as a corrective pattern to rise from 102.58 (2021 low). The range of medium term consolidation should be set between 38.2% retracement of 102.58 to 161.94 at 139.26 and 161.94. Nevertheless, sustained break of 139.26 would open up deeper medium term decline to 61.8% retracement at 125.25.
In the long term picture, it's still early to conclude that up trend from 75.56 (2011 low) has completed. A medium term corrective phase should have commenced, with risk of deep correction towards 55 M EMA (now at 136.02).
GBP/USD Weekly Outlook
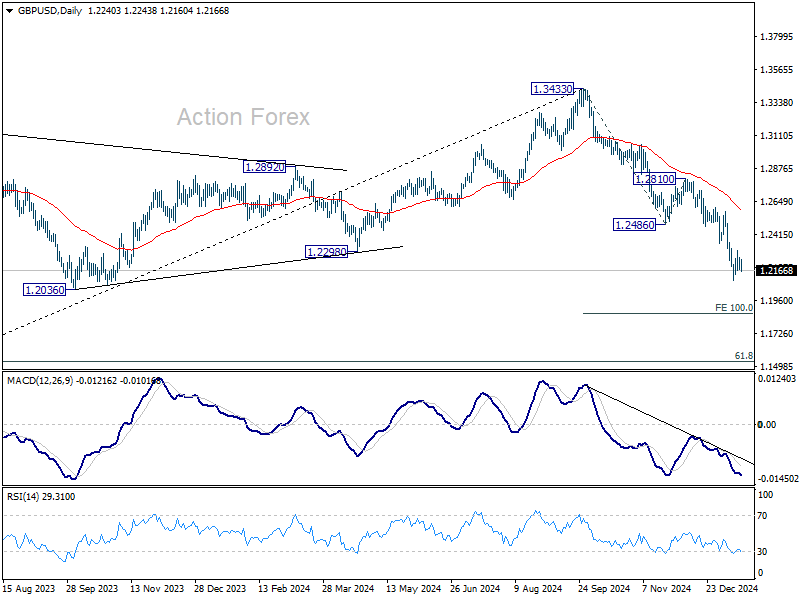
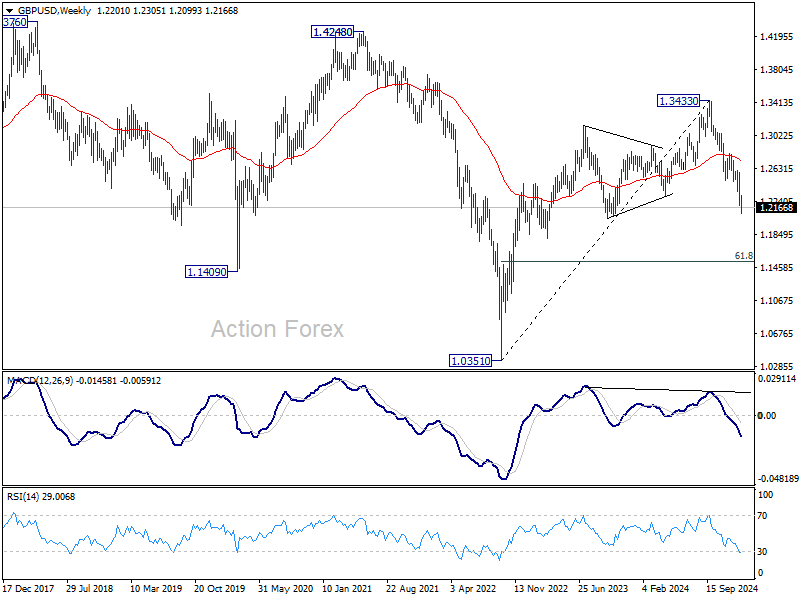
GBP/USD dipped to 1.2099 last week but recovered since then. Initial bias remains neutral this week for consolidations. While stronger recovery cannot be ruled out, outlook will remain bearish as long as 1.2486 support turned resistance holds. On the downside, break of 1.2099 will resume the fall from 1.3433 to 100% projection of 1.3433 to 1.2486 from 1.2810 at 1.1863.
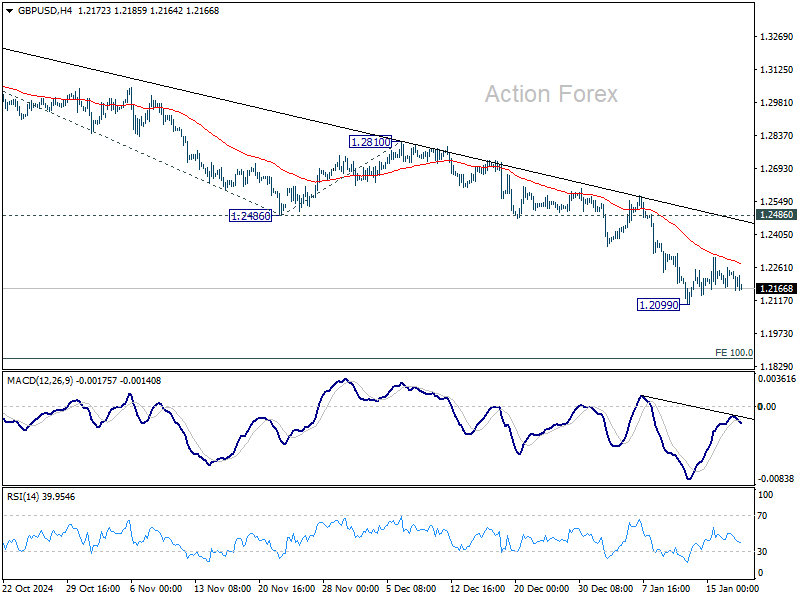
In the bigger picture, rise from 1.0351 (2022 low) should have already completed at 1.3433, and the trend has reversed. Further fall is now expected as long as 1.2810 resistance holds. Deeper decline should be seen to 61.8% retracement of 1.0351 to 1.3433 at 1.1528, even as a corrective move.
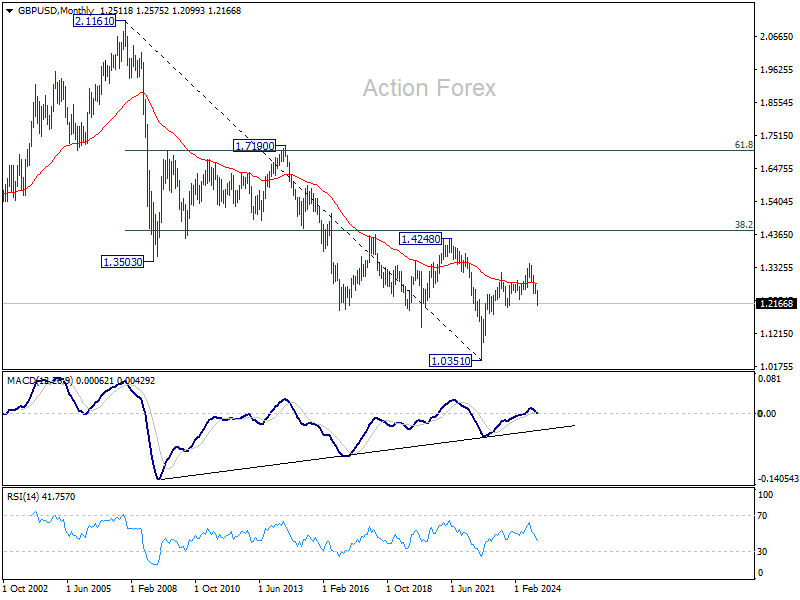
In the long term picture, price actions from 1.0351 (2022 low) are seen as a corrective pattern to the long term down trend from 2.1161 (2007 high) only. Outlook will be neutral at best as long as 1.4248 structural resistance holds, even in case of strong rebound.
USD/CHF Weekly Outlook
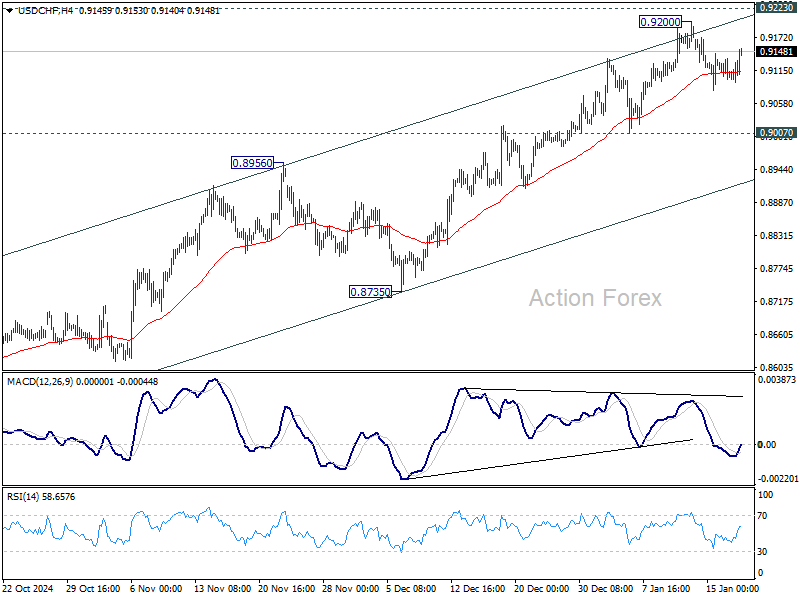
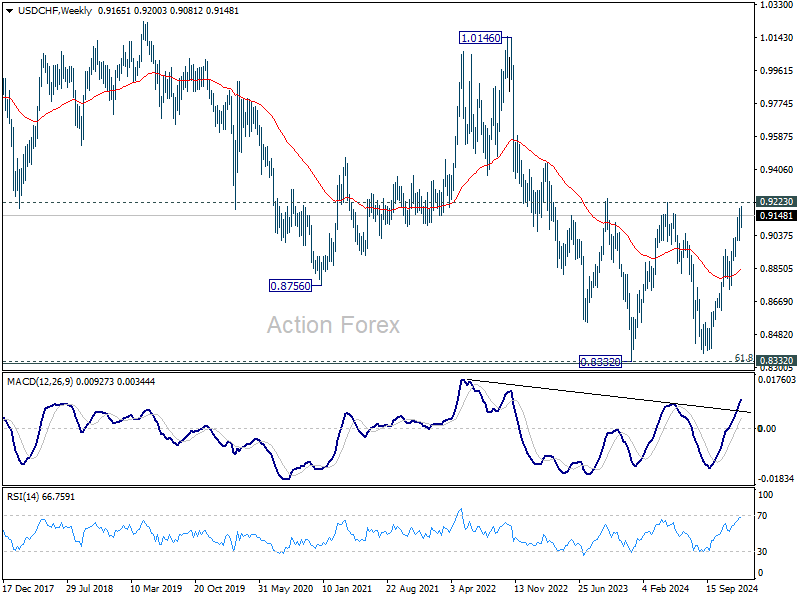
USD/CHF edged higher to 0.9200 last week but lost momentum ahead of 0.9223 key resistance and retreated. Initial bias remains neutral this week for more consolidations. As long as 0.9007 support holds, near term outlook remains bullish. On the upside, decisive break of 0.9223 will carry larger bullish implications. However, break of 0.9007 will confirm short term topping, and turn bias back to the downside for 55 D EMA (now at 0.8937).
In the bigger picture, as long as 0.9223 resistance holds, price actions from 0.8332 (2023 low) are seen as a medium term corrective pattern. That is, long term down trend is in favor to resume through 0.8332 at a later stage. However, sustained break of 0.9223 will be an important sign of bullish trend reversal.
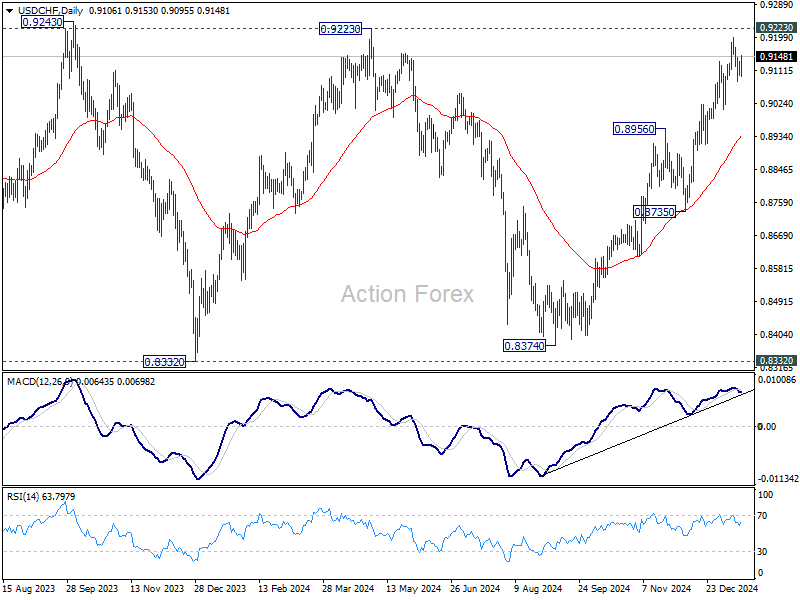
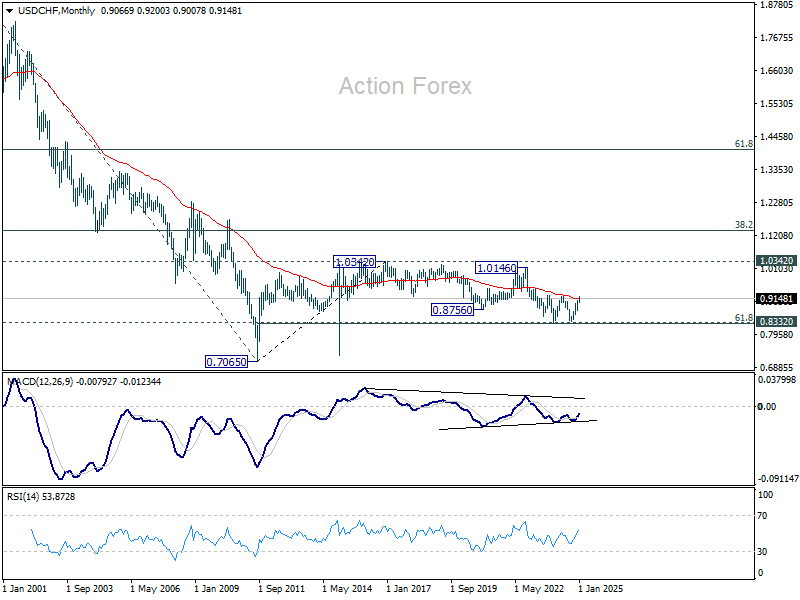
In the long term picture, price action from 0.7065 (2011 low ) are seen as a corrective pattern to the multi-decade down trend from 1.8305 (2000 high). Fall from 1.0342 (2016 high) is seen as the second leg. Sustained break of 55 M EMA (now at 0.9131) will indicate that the third leg has already started. However, rejection by 55 M EMA again, followed by break of 61.8% retracement of 0.7065 to 1.0342 at 0.8317, will pave the way back to 0.7065.
AUD/USD Weekly Report
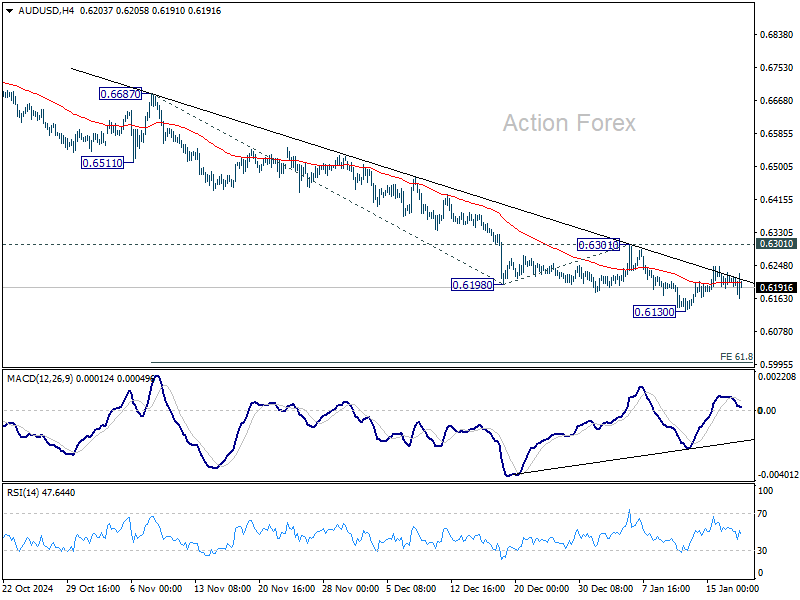
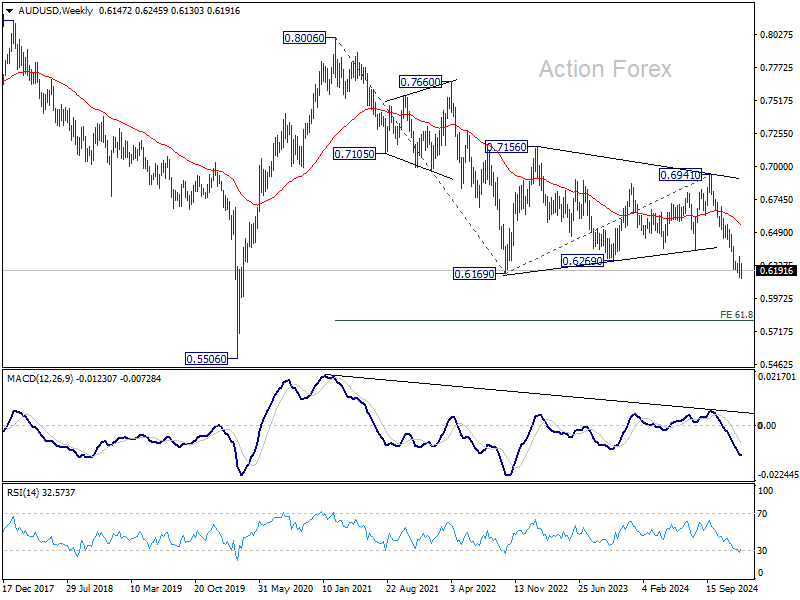
AUD/USD recovered after edging lower to 0.6130 last week. Initial bias stays neutral this week for consolidations. Outlook will remain bearish as long as 0.6301 resistance holds. Break of 0.6130 will resume the fall from 0.6941 and target 61.8% projection of 0.6687 to 0.6198 from 0.6301 at 0.5999. However, considering bullish convergence condition in 4H MACD, break of 0.6310 will indicate short term bottoming, and turn bias back to the upside for stronger rebound.
In the bigger picture, down trend from 0.8006 (2021 high) is resuming with break of 0.6169 (2022 low). Next medium term target is 61.8% projection of 0.8006 to 0.6169 from 0.6941 at 0.5806, In any case, outlook will stay bearish as long as 55 W EMA (now at 0.6545) holds.
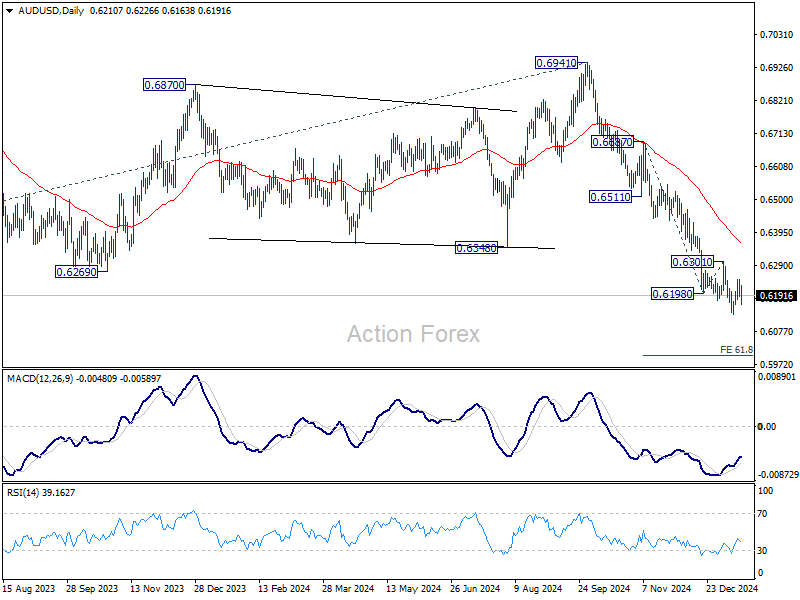
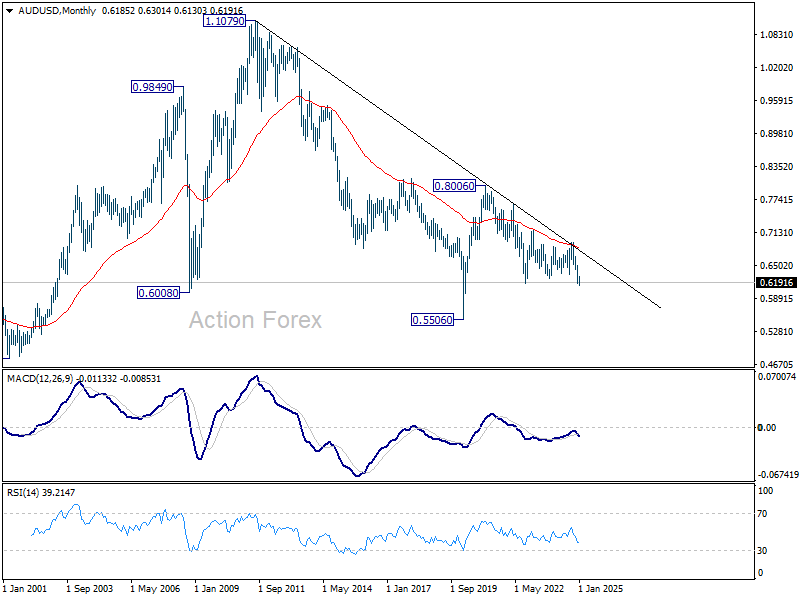
In the long term picture, prior rejection by 55 M EMA (now at 0.6846) is taken as a bearish signal. But for now, fall from 0.8006 is still seen as the second leg of the corrective pattern from 0.5506 long term bottom (2020 low). Hence, in case of deeper fall, strong support should emerge above 0.5506 to contain downside to bring reversal. However, this view is subject to adjustment if current decline accelerates further.
Global Markets Look Beyond Trump’s Inauguration as Local Drivers Take the Lead
Global markets are buzzing in anticipation of Donald Trump’s inauguration on January 20, yet the latest developments suggest investors may already be looking past the immediate impact. Despite speculation surrounding Trump’s policies—particularly tariffs—various benchmarks and asset classes are charting their own directions based on localized drivers and monetary policy expectations.
In the US, the strong bounce in major stock indexes owes something to hopes of expansive fiscal stimulus under Trump. However, a significant portion of the rally can be traced to an improving inflation outlook and the view that Fed remains on track to further monetary easing. Additionally, the lack of significant concern over tariffs impacting inflation suggests that investors may not see Trump's trade policies as an immediate threat to the US economy.
Meanwhile record-breaking runs in FTSE and DAX signal distinct optimism. UK investors are banking on additional BoE easing after disappointing GDP, retail sales, and CPI data highlighted ongoing struggles. Germany’s DAX is supported by ECB’s dovish leanings as well as hopes of a political turnaround after snap elections in Germany in February. Market enthusiasm for Europe clearly isn’t driven by any expectation of beneficial tariffs; rather, local factors are in control.
Japan, not a prime target of Trump’s tariff rhetoric, saw Nikkei weighed down by intensifying speculation about a looming Bank of Japan rate hike. This dynamic stands in sharp contrast to the overarching risk-on atmosphere elsewhere.
In the currency markets, Yen emerged as the strongest performer last week, propelled by bets on BoJ action. Australian and New Zealand dollars followed suit, aided by the broader risk-on mood. On the weaker side of the spectrum, Canadian Dollar was the worst-performing currency, finally something reflecting potential vulnerability to Trump's trade policies as BoC may have underestimated the economic risks posed by tariffs. Sterling also underperformed while Dollar was similarly subdued. Euro and Swiss Franc ended the week in middle positions.
Risk Appetite Returns: DOW, S&P 500, NASDAQ End Week with Solid Gains
Risk-on sentiment returned to US equity markets this week, with all three major indexes posting strong gains. DOW surged 3.69% for the week, S&P 500 rose 2.91%, and NASDAQ climbed 2.45%. Technically, the robust rebound eased fears of an imminent bearish reversal, affirming that recent pullbacks were likely just corrections within a broader uptrend.
Market attention was drawn to Fed Governor Christopher Waller’s remarks at CNBC's "Squawk on the Street", interpreted by some as a dovish tilt. He expressed confidence that the inflationary stickiness seen in 2024 will begin to "dissipate" in 2025 and described himself as "more optimistic" about inflation than many of his Fed colleagues. Waller indicated the potential for three or four 25bps rate cuts this year, contingent on favorable inflation data.
However, it should emphasized that Waller also tempered this optimism with caution, acknowledging that “If the data doesn’t cooperate, then you’re going to be back to two, maybe even one”.
Waller left the door open for a rate cut in March, remarking that such a move "cannot be completely ruled out." However, the message underlying was still consistent with market expectation that May or June might be more likely.
Overall, despite the dovish interpretation by some, Waller's comments suggest a flexible, data-dependent approach rather than a clear commitment to easing. The comments also largely aligned with market pricing.
Nonetheless, inflation data for December did provide some relief. While, headline CPI rose from 2.7% to 2.9% yoy, core CPI edged down from 3.3% to 3.2%. This incremental progress reduces pressure on the Fed to maintain restrictive policy for an extended period. More importantly, that makes a return to tightening less likely.
Futures pricing didn't change much over the week, reflecting a 97.9% chance that Fed will hold rates steady at 4.25–4.50% at the January meeting, with a 72.4% chance of another hold in March. The probability of a May rate cut stands at 44%, rising to 66% by June. By year-end, markets still project a 52.1% chance of just one rate cut, reducing rates to 4.00–4.25%.
Technically, DOW's break of 55 D EMA (now at 43038.33) suggests that pullback from 45073.63 has completed at 41844.98 already. The medium term channel holds intact, as well as the up trend. Whether DOW is ready for another record run through 45073.63 would depend on the momentum of the next rise.
But even in case that corrective pattern from 45073.63 is going to extend with another falling leg, downside looks more likely than not to be contained by cluster support level at around 40k, with 39889.05 resistance turned support, and 38.2% retracement of 32327.20 to 45073.63 at 40204.49.
NASDAQ's price actions from 20204.58 are also clearly corrective looking so far, with notable support from 18671.06 resistance turned support. With this support intact, larger up trend should resume through 20204.58 sooner rather than later.
Yields and Dollar Index Form Short-Term Top With Improved Risk Sentiment
Improved risk sentiment in US markets has triggered pullback in both 10-year Treasury yield and the Dollar Index, suggesting a temporary pause in their recent rally.
Technically, a short term top is likely in place at 4.809 in 10-year yield, considering that D MACD has crossed below signal line. More consolidations should follow in the near term below 4.809, with risk of deeper pull back to 55 D EMA (now at 4.434). But outlook will continue to stay bullish as long as 38.2% retracement of 3.603 to 4.809 at 4.348 holds. Another rally through 4.809 to retest 4.997 high is expected, though breaking the psychological 5% level may prove challenging without stronger momentum.
Dollar Index could have formed a short term top at 110.17 too, just ahead of 61.8% projection of 100.15 to 108.87 from 105.42 at 110.31, with D MACD crossed below signal line. Deeper retreat could be seen to 108.07 resistance turned support, or even further to 55 D EMA (now at 107.15). But near term outlook will stay bullish as long as 38.2% retracement of 100.15 to 110.17 at 106.34 holds. Firm break of 110.17 will resume the rally to 100% projection at 113.34.
FTSE and DAX Surge to Record Highs
Risk-on sentiment was also evident in the European equity markets, with FTSE 100 and DAX surged to new record highs. The optimism was fueled by expectations of rate cuts, positive economic projections, and hopes for political stability.
In the UK, a trio of softer economic data—GDP, retail sales, and CPI—reinforced market expectations for BoE easing. Markets now anticipate more than 75 basis points of rate cuts throughout 2025, compared to just 50 basis points priced in the prior week. A 25bps rate cut in February is now universally expected.
Supporting this sentiment, IMF upgraded its UK growth forecast for 2025 by 0.1 percentage points to 1.6%, making the UK the third-fastest-growing G7 economy after the US and Canada. IMF attributed this optimism to increased government investment, improved household finances, and anticipated rate cuts.
That's a strong nod to the Labour government despite wide criticism on its Autumn Budget. Meanwhile, IMF also projects BoE’s headline rate to fall from 4.75% to 3.75% by year-end.
Technically, FTSE's break of 8474.41 confirmed that triangle consolidation from there has completed at 8002.34, and larger up trend has resumed. Next target is 61.8% projection of 7404.08 to 8474.41 from 8002.34 at 8663.80.
In Germany, DAX surged to new record on improving risk appetite and expectations of continued ECB easing.
ECB’s December meeting minutes leaned towards the dovish side, and revealed discussions about a more aggressive 50-basis-point cut. The central bank ultimately favored a measured approach, with consensus on a more controlled pace of easing, to allow for checkpoints to confirm that disinflation remains on track.
While IMF downgraded its 2025 growth forecasts for Germany and France, the outlook still points to modest recovery. Germany, previously expected to grow by 0.8%, is now forecasted to expand by just 0.3%, marking a slow rebound from two years of contraction. France’s growth forecast was also reduced by 0.3 percentage points to 0.8%. The positive side of the forecasts is that both economies are expected to regain some footing this year.
It should also be noted that markets are probably pricing in a degree of optimism around the February 23 snap elections, which could lead to greater political stability and more consistent economic policies in Germany.
Technically, DAX should now be on track to 100% projection of 14630.21 to 18892.92 from 17024.82 at 21287.52 next.
Nikkei Weighed by BoJ Hike Risks, SSE Struggles to Rebound
Investor sentiment in Asia, however, was much less optimistic, with Japan facing headwinds from growing expectations of Bank of Japan policy normalization, while China’s economic recovery struggles to inspire confidence amid external pressures.
In Japan, speculation over a rate hike at the upcoming January 23–24 BoJ meeting has intensified. Governor Kazuo Ueda and Deputy Governor Ryozo Himino have repeatedly hinted at the possibility of policy tightening, with analysts interpreting their comments as preparation for market adjustments.
Additionally, reports suggest BoJ is likely to raise its inflation forecasts in its quarterly outlook, highlighting upside risks fueled by the persistently weak Yen and elevated import costs. Internally, BoJ policymakers believe that stabilizing inflation expectations around the 2% target could allow short-term rates to rise as high as 1% without hindering economic growth.
Traders are pricing in an 80% chance of a rate hike from 0.25% to 0.50%.
Nikkei weakened for the week on expectations of BoJ's normalization move, but stayed above 37651.07 support.
Outlook is unchanged that price action from 42426.77 are developing in to a medium term three wave consolidation pattern, with rebound from 31156.11 as the second leg.
For now, another rally cannot be ruled out, but strong resistance should emerge below 42426.77 to limit upside. Firm of 37651.07 support will in turn indicate that the third leg has likely commenced, and bring deeper fall to 35253.43 support and below
In China, Shanghai SSE Composite struggled to generate meaningful gains other than a mild recovery.
China'seconomy grew 5.4% yoy in Q4, lifting full-year GDP growth to 5.0%, matching the government’s target.Meanwhile, market rumors suggest Beijing is hesitant to use Yuan depreciation as a tool to counter tariffs from a second Trump presidency. Analysts believe sharp currency depreciation, as seen during Trump’s first term, could harm the struggling economy more than it would help.
However, market confidence remains subdued, and the stock market recovery appeared technical rather than driven by fundamentals.
SSE found support at the 50% retracement level of 2,635.09 to 3,674.40 at 3154.74, but remained capped below 55 D EMA (now at 3279.16).
Risk remains on the downside for the near term for SSE. Break of 3140.90 will extend the corrective fall from 3674.40 to 61.8% retracement at 3032.11. Nevertheless, sustained break above the 55 D EMA will indicate that stronger near term rebound is underway back towards 3494.86 resistance.
USD/CAD Weekly Outlook
USD/CAD's late break of 1.4466 resistance confirms larger up trend resumption. Initial bias is back on the upside this week for 1.4667/89 long term resistance zone. For now, outlook will stay bullish as long as 1.4302 support holds, in case of retreat.
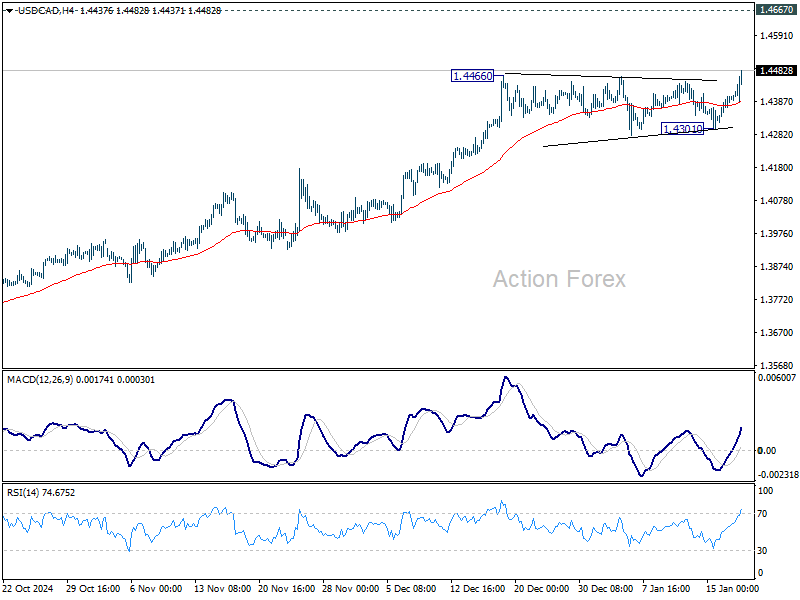
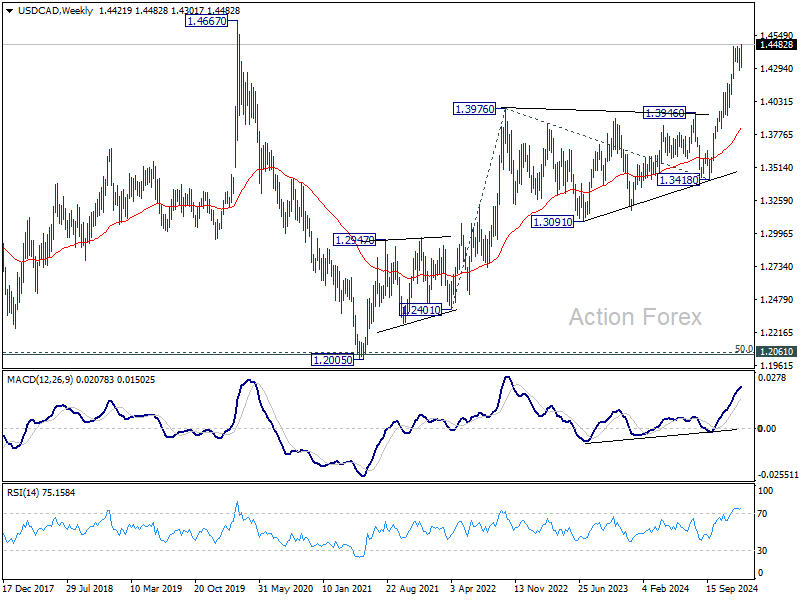
In the bigger picture, up trend from 1.2005 (2021) is in progress for retesting 1.4667/89 key resistance zone (2020/2015 highs). Decisive break there will confirm long term up trend resumption. Next target is 100% projection of 1.2401 to 1.3976 from 1.3418 at 1.4993. Medium term outlook will remain bullish as long as 1.3976 resistance turned holds (2022 high), even in case of deep pullback.
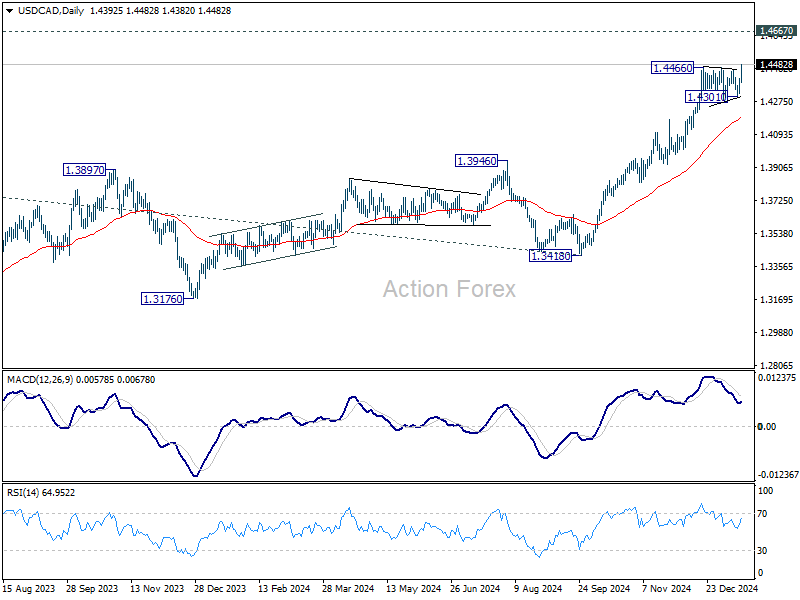
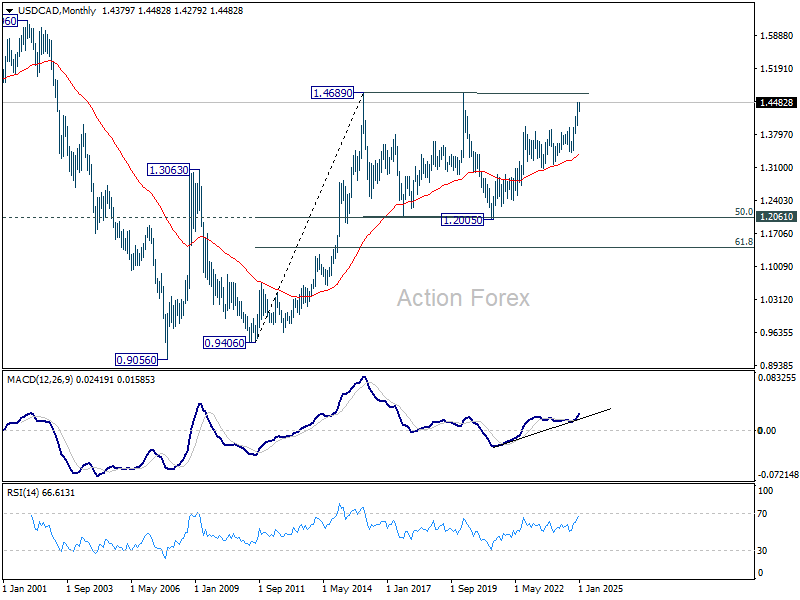
In the longer term picture, price actions from 1.4689 (2016 high) are seen as a consolidation pattern, which might have completed at 1.2005. That is, up trend from 0.9506 (2007 low) is expected to resume at a later stage. This will remain the favored case as long as 1.3418 support holds.
USD/CAD Weekly Outlook
USD/CAD's late break of 1.4466 resistance confirms larger up trend resumption. Initial bias is back on the upside this week for 1.4667/89 long term resistance zone. For now, outlook will stay bullish as long as 1.4302 support holds, in case of retreat.
In the bigger picture, up trend from 1.2005 (2021) is in progress for retesting 1.4667/89 key resistance zone (2020/2015 highs). Decisive break there will confirm long term up trend resumption. Next target is 100% projection of 1.2401 to 1.3976 from 1.3418 at 1.4993. Medium term outlook will remain bullish as long as 1.3976 resistance turned holds (2022 high), even in case of deep pullback.
In the longer term picture, price actions from 1.4689 (2016 high) are seen as a consolidation pattern, which might have completed at 1.2005. That is, up trend from 0.9506 (2007 low) is expected to resume at a later stage. This will remain the favored case as long as 1.3418 support holds.
GBP/JPY Weekly Outlook
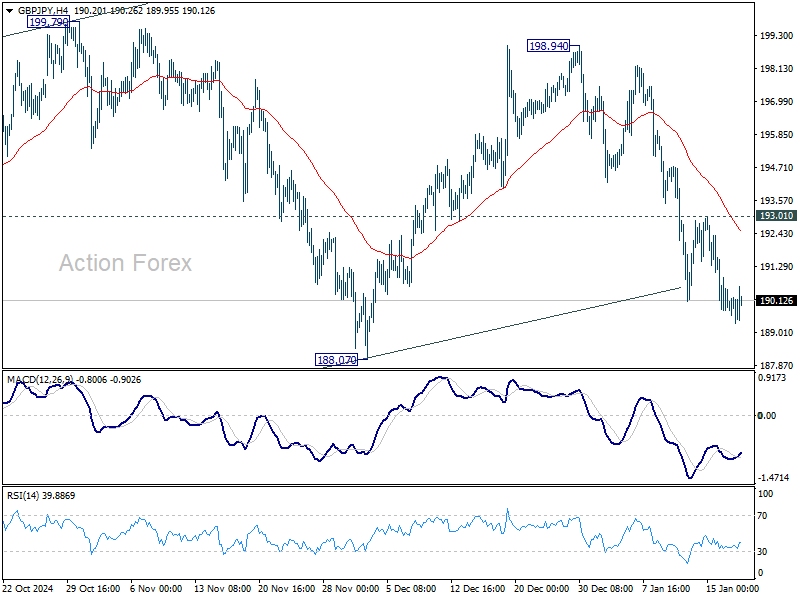
GBP/JPY's fall from 198.94 continued last week despite some loss of downside momentum. Further fall is expected to 188.07 support this week. Firm break there will argue that corrective pattern from 180.00 has finished too, and larger decline from 208.09 might be ready to resume. On the upside, above 193.01 resistance will turn intraday bias neutral first.
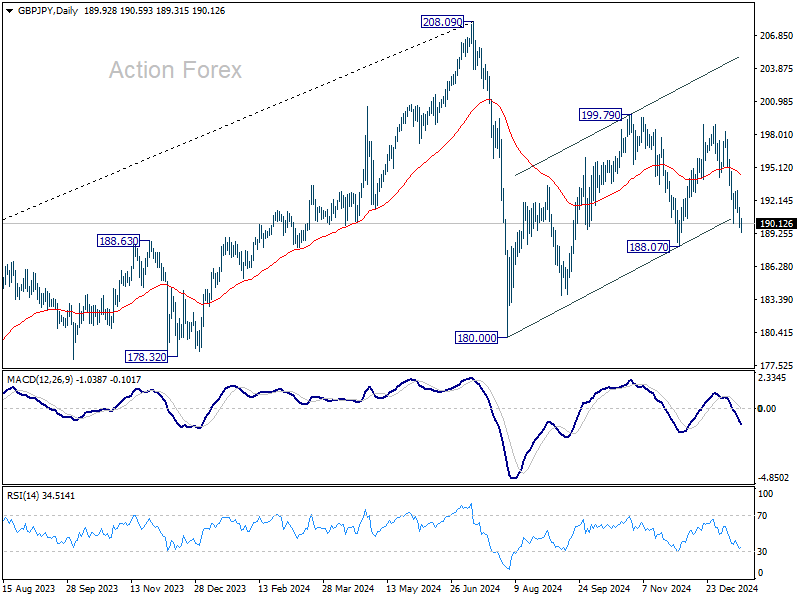
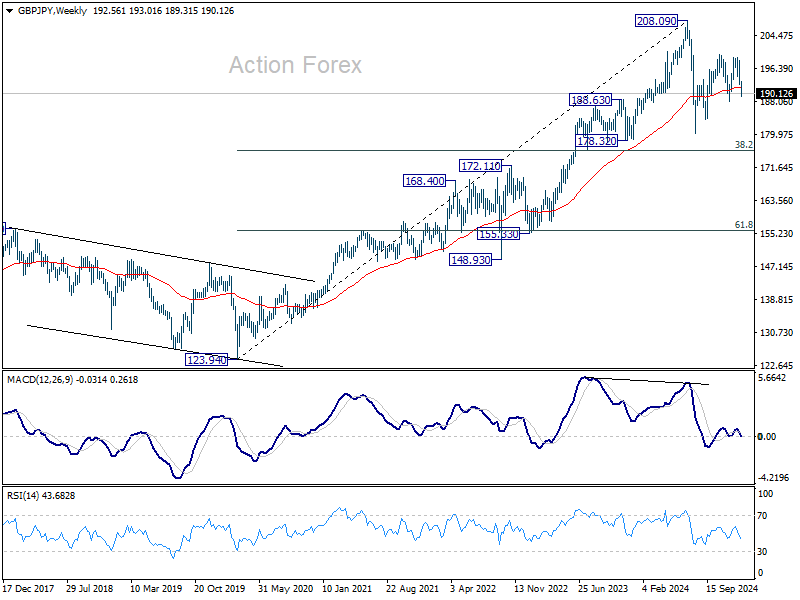
In the bigger picture, price actions from 208.09 are seen as a correction to whole rally from 123.94 (2020 low). The range of consolidation should be set between 38.2% retracement of 123.94 to 208.09 at 175.94 and 208.09. However, decisive break of 175.94 will argue that deeper correction is underway.
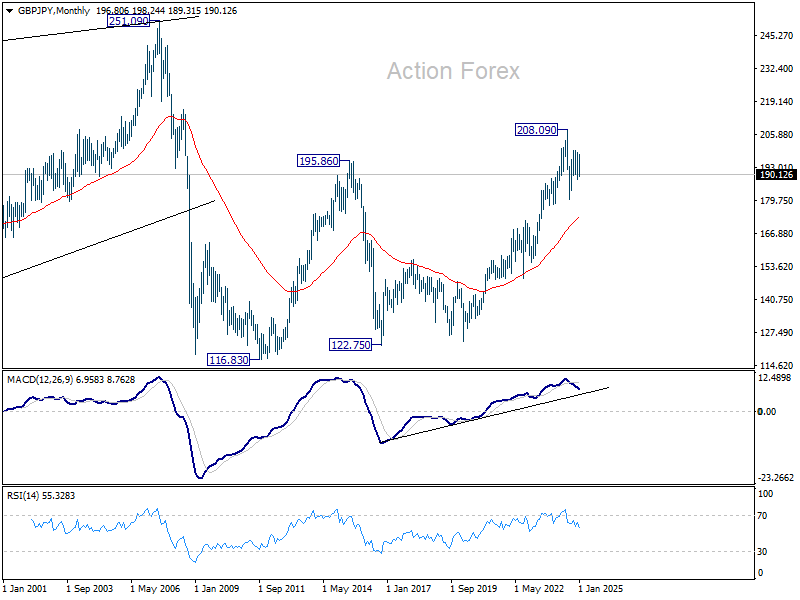
In the longer term picture, while a medium term top was formed at 208.09 (2024 high), it's still early to conclude that the up trend from 122.75 (2016 low) has completed. But GBP/JPY is at least in a medium term corrective phase, with risk of correction to 55 M EMA (now at 173.41).
EUR/JPY Weekly Outlook
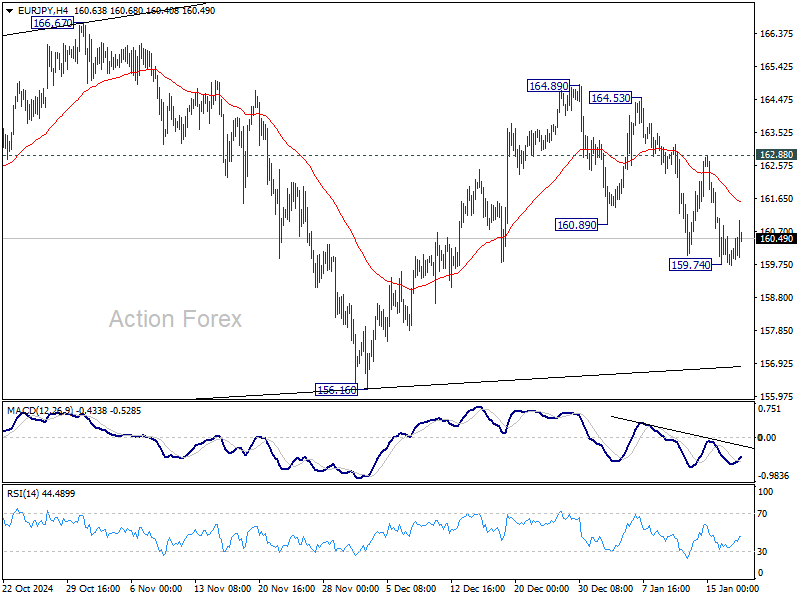
EUR/JPY's extended decline last week suggests that rebound from 156.16 has already completed at 164.89. But downside momentum remained unconvincing. Also, with a temporary low formed at 159.74, initial bias is neutral this week first. On the downside, below 159.74 will target 156.16 support. On the upside, break of 162.89 will bring retest of 164.89 instead.
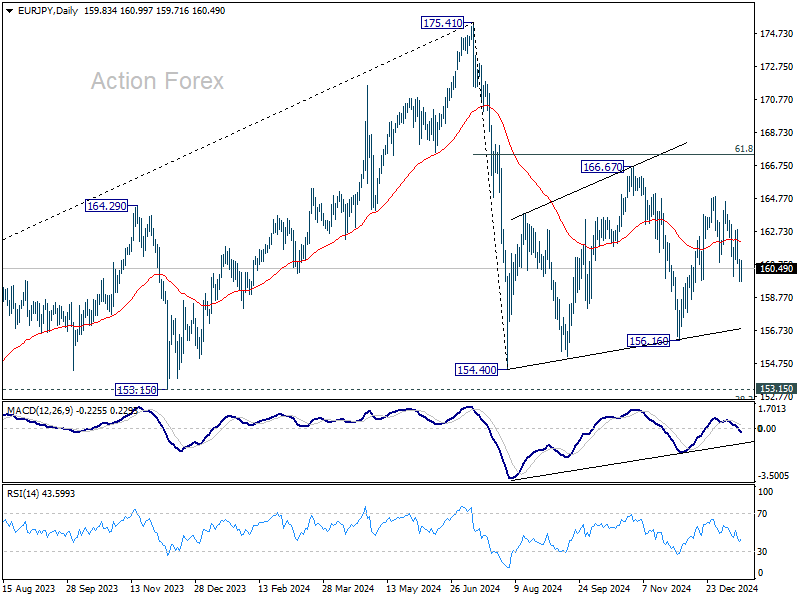
In the bigger picture, price actions from 175.41 are seen as correction to rally from 114.42 (2020 low). The range of consolidation should have been set between 38.2% retracement of 114.42 to 175.41 at 152.11 and 175.41 high. However, decisive break of 152.11 would argue that deeper correction is underway.
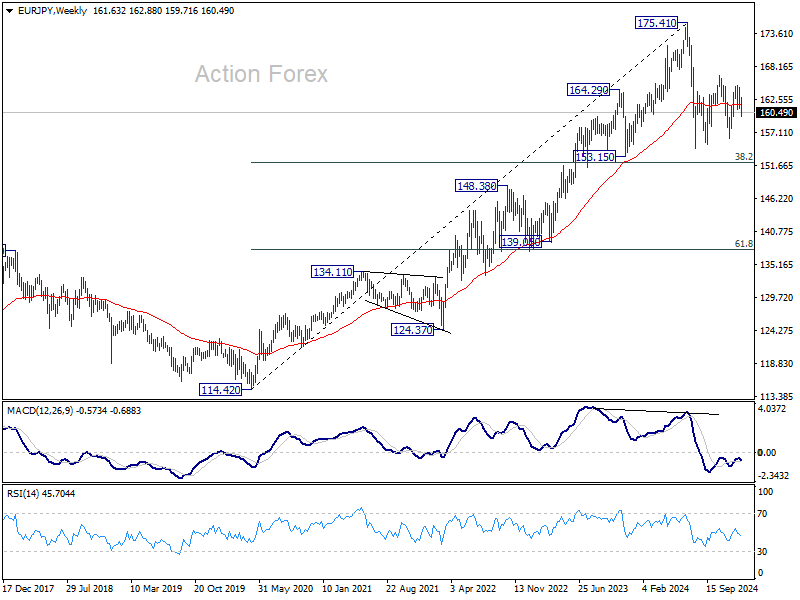
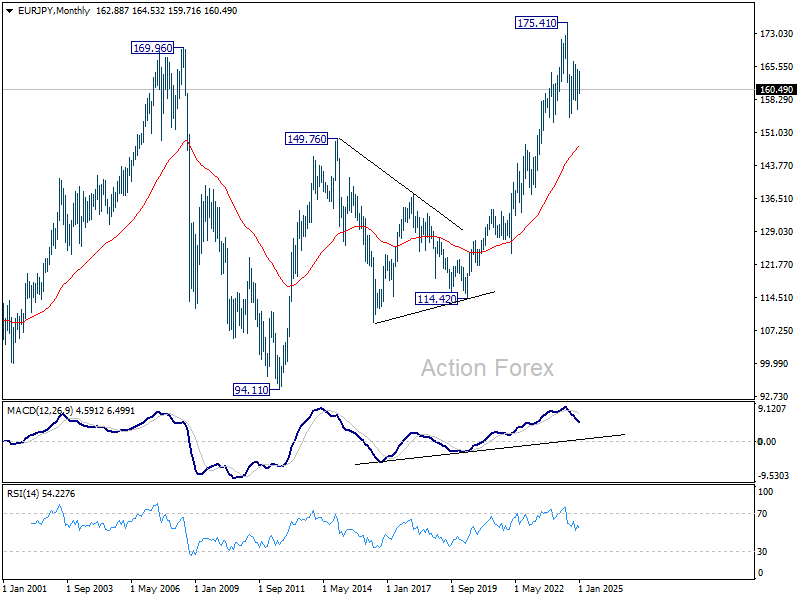
In the long term picture, while 175.41 is at least a medium term top, it's still early to conclude that up trend from 94.11 (2012 low) has completed. A medium term corrective phase is in progress with risk of deeper fall back to 55 M EMA (now at 148.21).
EUR/GBP Weekly Outlook
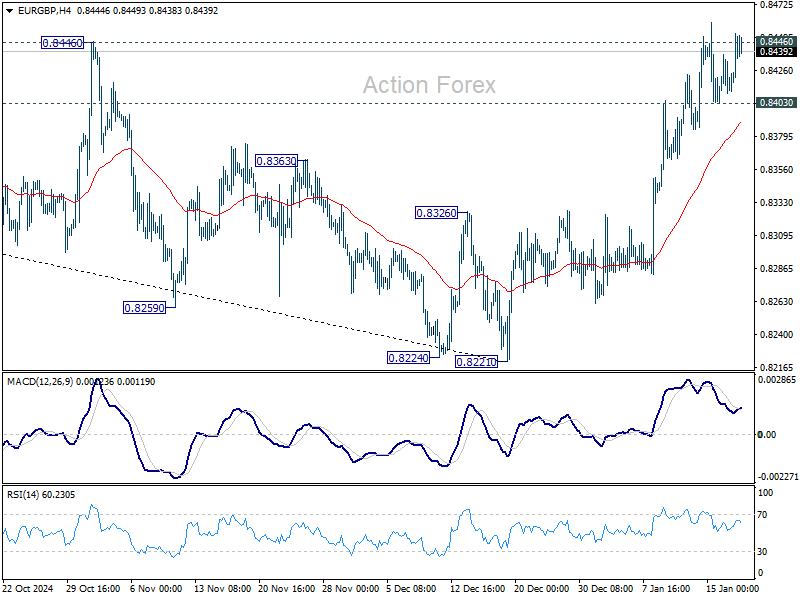
EUR/GBP's rally from 0.8221 continued last week but failed to sustain above 0.8446 resistance and turned sideway. Initial bias remains neutral this week first. On the upside, decisive break of 0.8446 will target 0.8624 key cluster resistance zone. However, break of 0.8403 support will indicate short term topping after rejection by 0.8446. Intraday bias will be back on the downside for 55 D EMA (now at 0.8335).
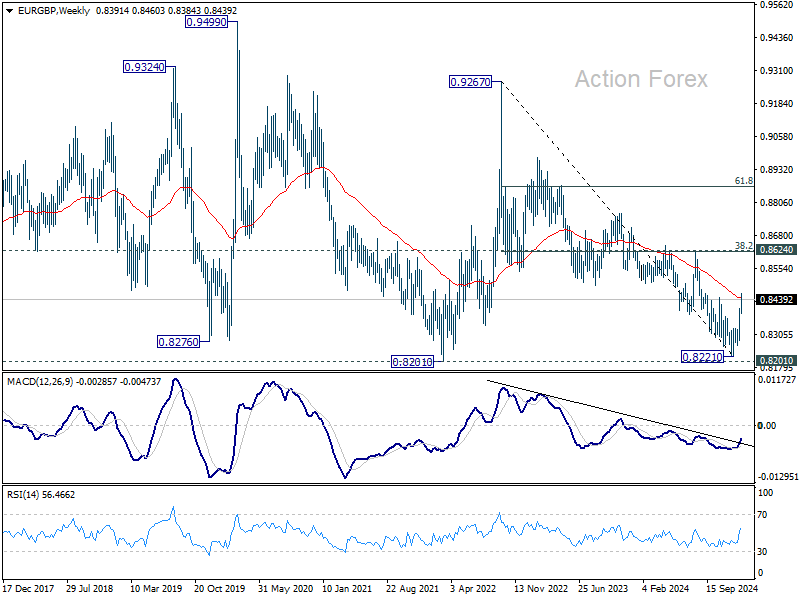
In the bigger picture, considering bullish convergence condition in D MACD, decisive break of 0.8446 resistance and 55 W EMA (now at 0.8446) should confirm medium term bottoming at 0.8221, just ahead of 0.8201 key support (2022 low). Further rally should be seen towards 0.8624 key resistance, even as a correction to the down trend from 0.9267 (2022 high). Overall, however, medium term outlook will be neutral at best until decisive break of 0.8624 cluster zone (38.2% retracement of 0.9267 to 0.8221 at 0.8621). Risk will stay on the downside even in case of strong rebound.
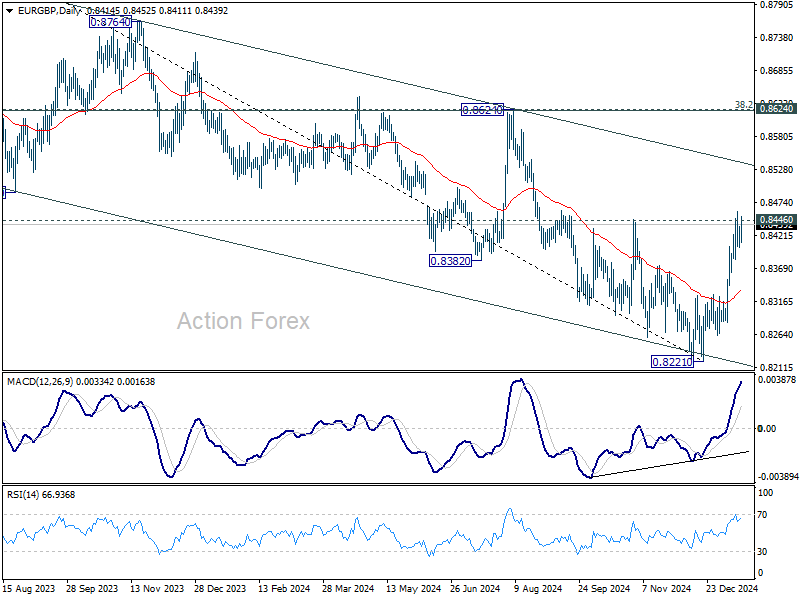
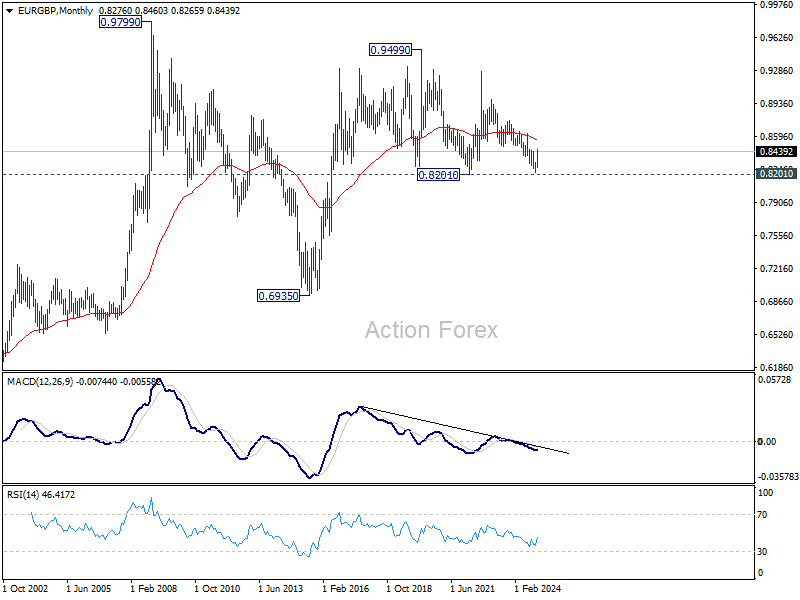
In the long term picture, price action from 0.9499 (2020 high) is seen as part of the long term range pattern from 0.9799 (2008 high). Range trading should continue between 0.8201 and 0.9499, until there is clear signal of imminent breakout.