Sample Category Title
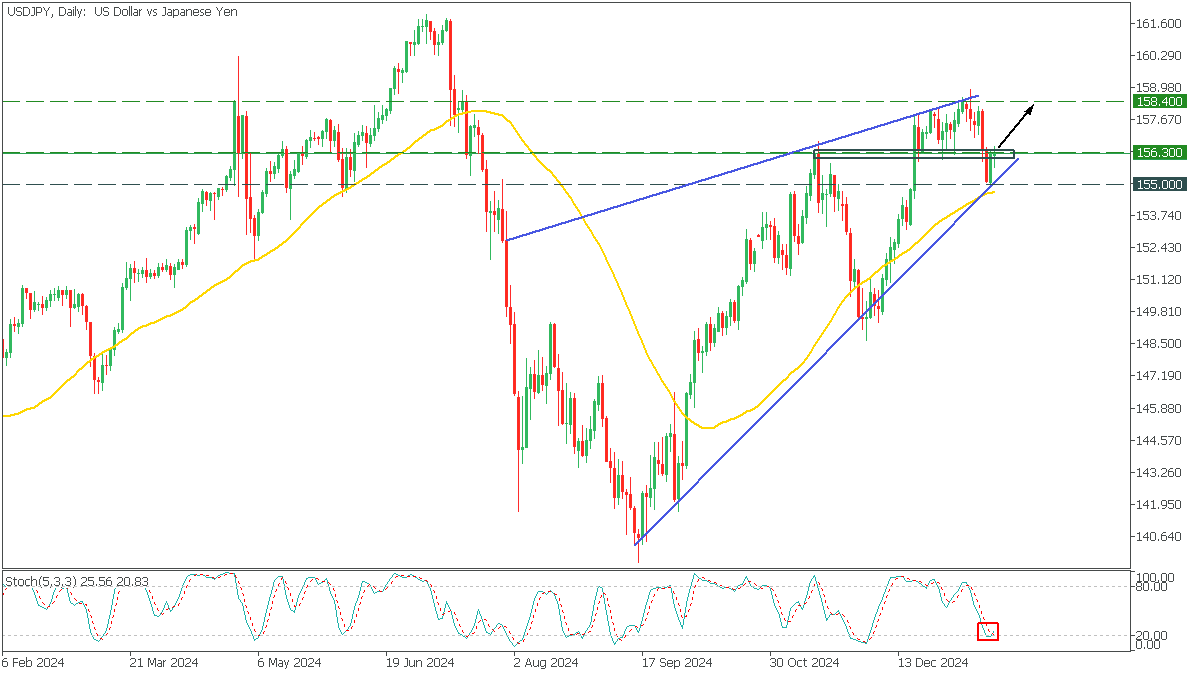
USDJPY: 2000 Point Move
USDJPY, Daily
In the Daily timeframe, USDJPY has formed a rising wedge pattern. The price bounced off the lower trend line and MA50. The Stochastic is out of oversold range and indicates a possible upside.
- We may consider buying USDJPY on consolidation above 156.300 with a target to 158.400;
SPX Perfectly Reacting Higher From The Blue Box Area
In this technical blog, we will look at the past performance of the 4-hour Elliott Wave Charts of SPX. We presented to members at the elliottwave-forecast. In which, the rally from the October 2022 low unfolding as an impulse structure. Also showed a higher high sequence with a bullish sequence stamp. Suggested that index should see more upside extension to complete the impulse sequence. Therefore, we advised members not to sell the index & buy the dips in 3, 7, or 11 swings at the blue box areas. We will explain the structure & forecast below:
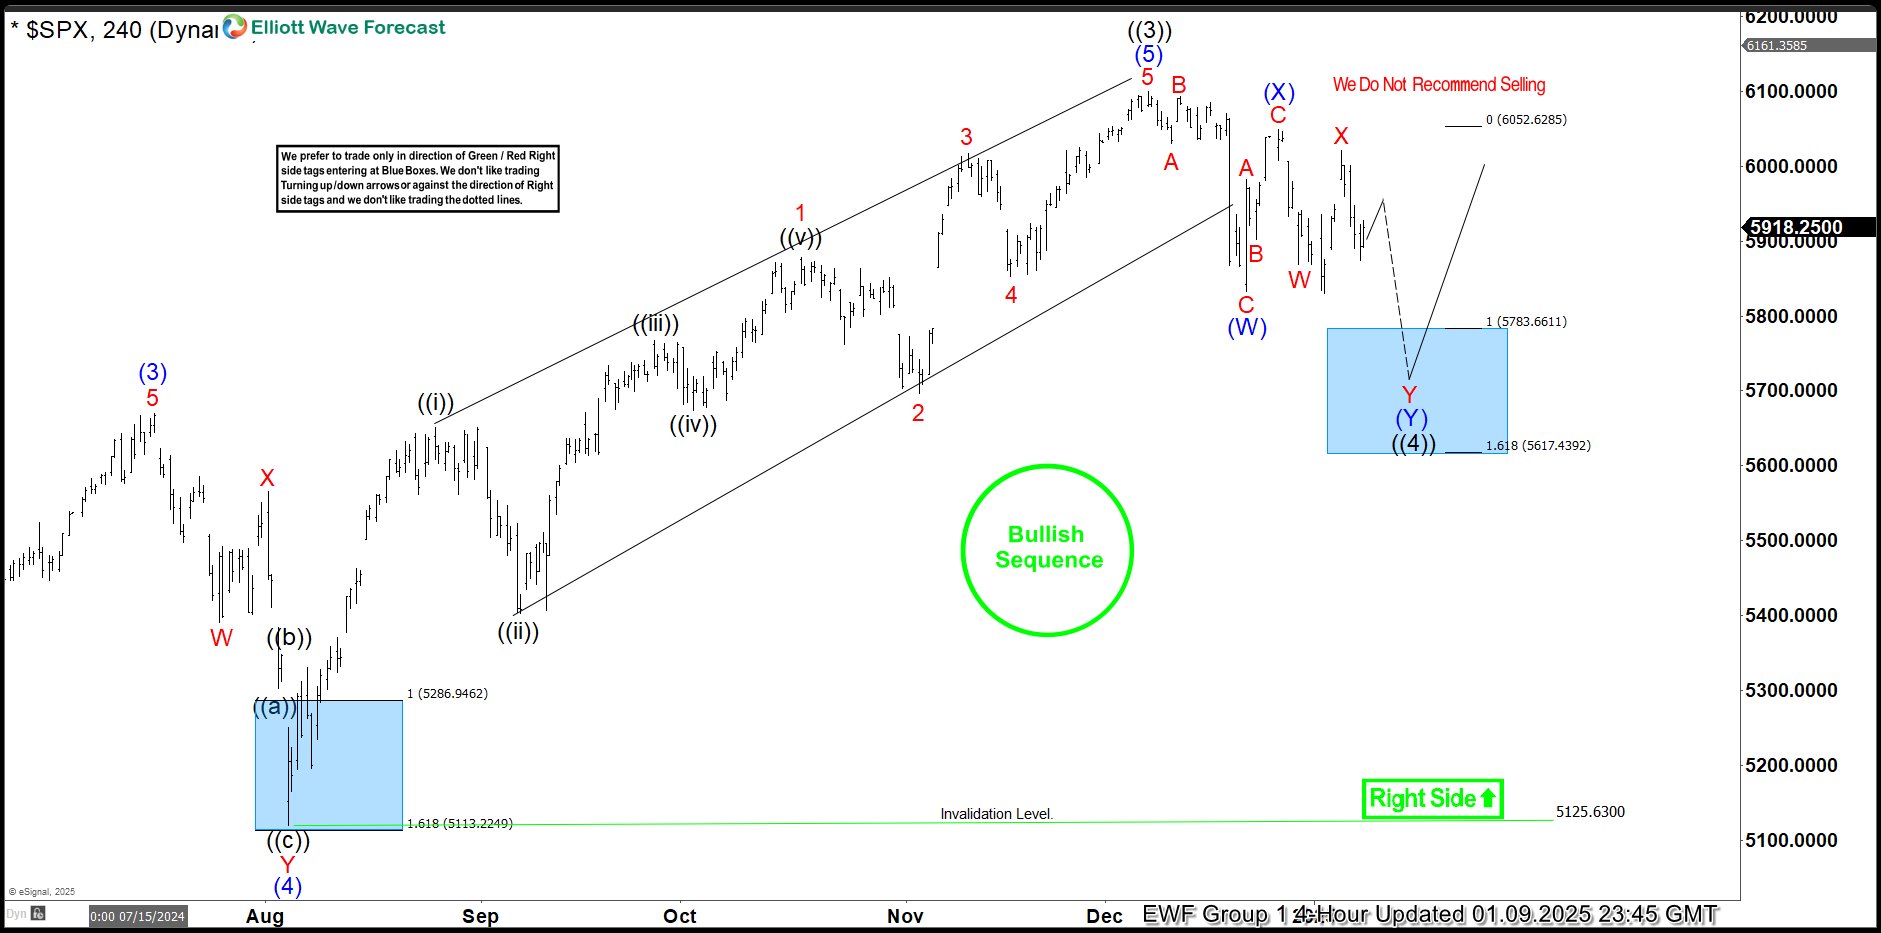
SPX 4-Hour Elliott Wave Chart From 1.09.2025
Here’s the 4-hour Elliott wave chart from the 1.09.2025 update. In which, the short-term cycle from the 8.05.2024 low ended impulse sequence & larger wave ((3)) at $6099.97 high. Down from there, the index made a pullback in wave ((4)) to correct that cycle. The internals of that pullback unfolded as Elliott wave double three structure where wave (W) ended at $5832.30 low. Wave (X) bounce ended at $6049.75 high. Then wave (Y) managed to reach the blue box area at $5783.66- $5617.43. From there, buyers were expected to appear looking for the next leg higher or for a 3 wave bounce minimum.
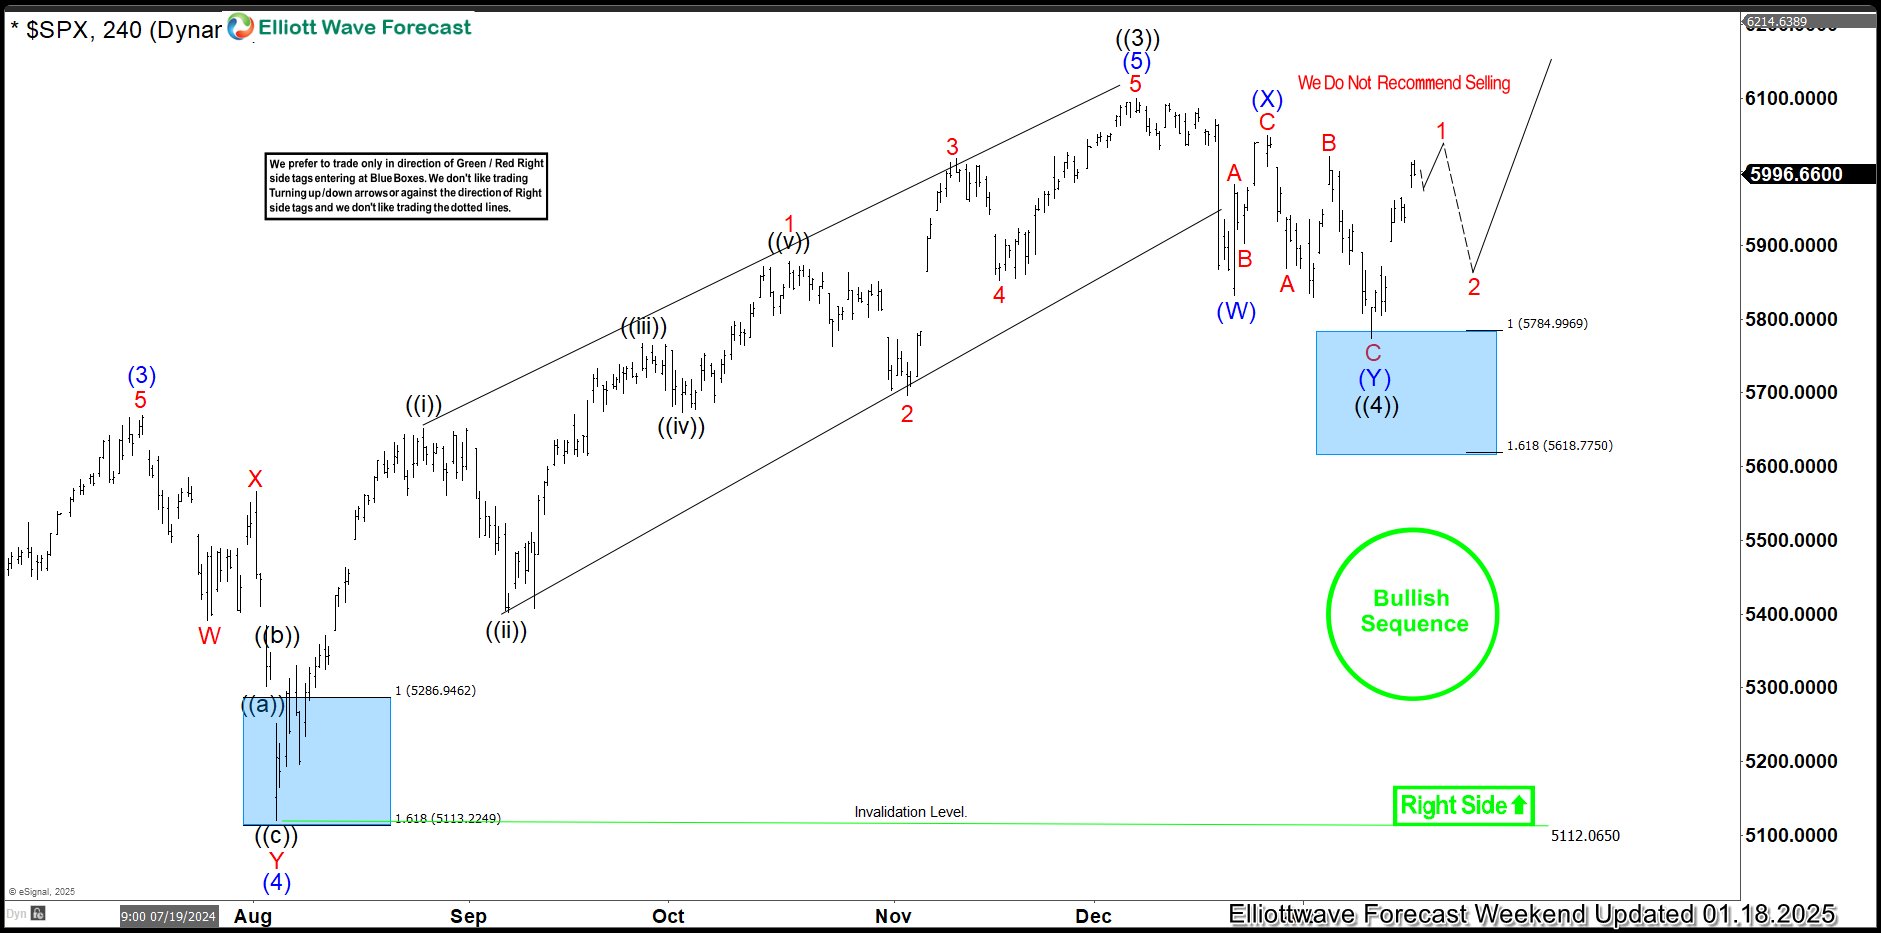
SPX Latest 4-Hour Elliott Wave Chart From 1.18.2025
This is the latest 4-hour Elliott wave Chart from the 1.18.2025 Weekend update. In which the SPX is showing a reaction higher taking place, right after ending the double correction within the blue box area. Allowed members to create a risk-free position shortly after taking the long position at the blue box area. However, a break above $6099.97 high is yet to be seen to confirm the next extension higher in wave 5 towards minimum extension target at $6179.13- $6304.44 area.
GBP/JPY Daily Outlook
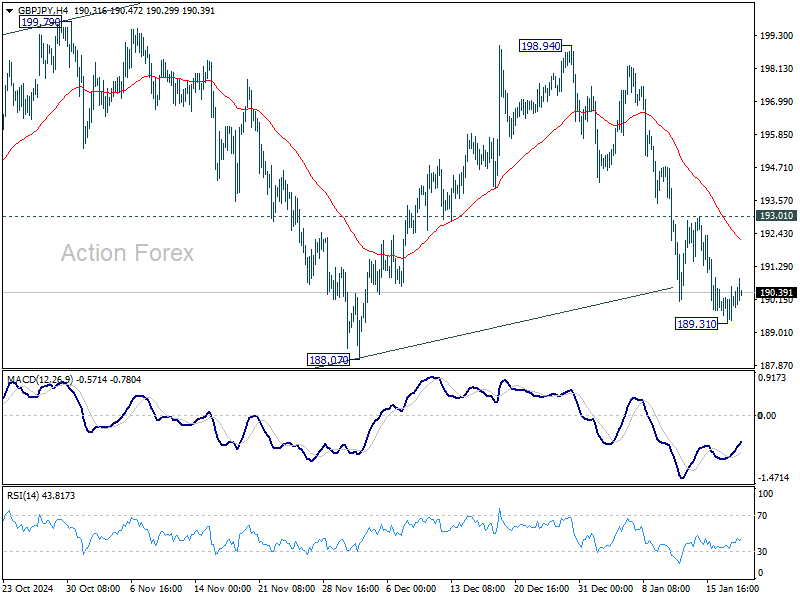
Daily Pivots: (S1) 189.48; (P) 190.05; (R1) 190.75; More...
A temporary low is formed at 189.31 with current recovery. Intraday bias in GBP/JPY is turned neutral first. Some consolidations would be seen but risk will stay on the downside as long as 193.01 resistance holds. On the downside, below 189.31 will target 188.07 support. Firm break there will argue that corrective pattern from 180.00 has finished too, and larger decline from 208.09 might be ready to resume.
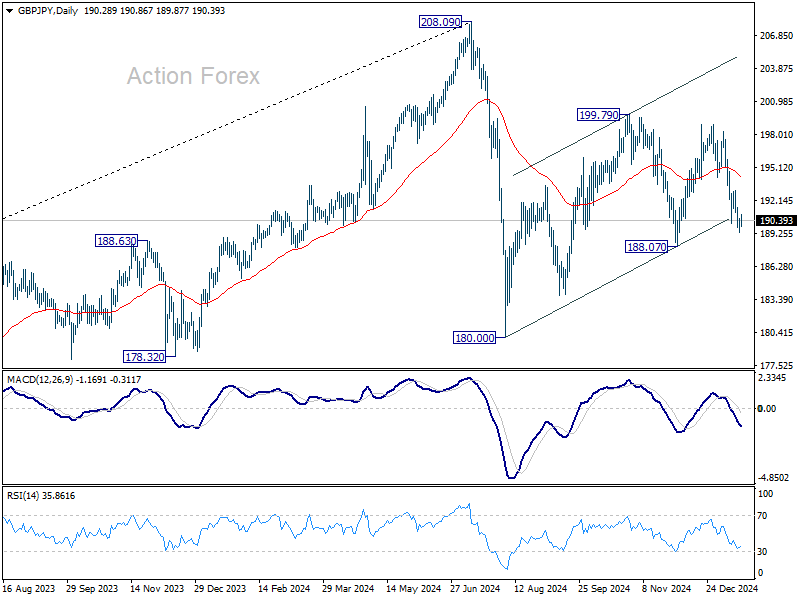
In the bigger picture, price actions from 208.09 are seen as a correction to whole rally from 123.94 (2020 low). The range of consolidation should be set between 38.2% retracement of 123.94 to 208.09 at 175.94 and 208.09. However, decisive break of 175.94 will argue that deeper correction is underway.
EUR/JPY Daily Outlook
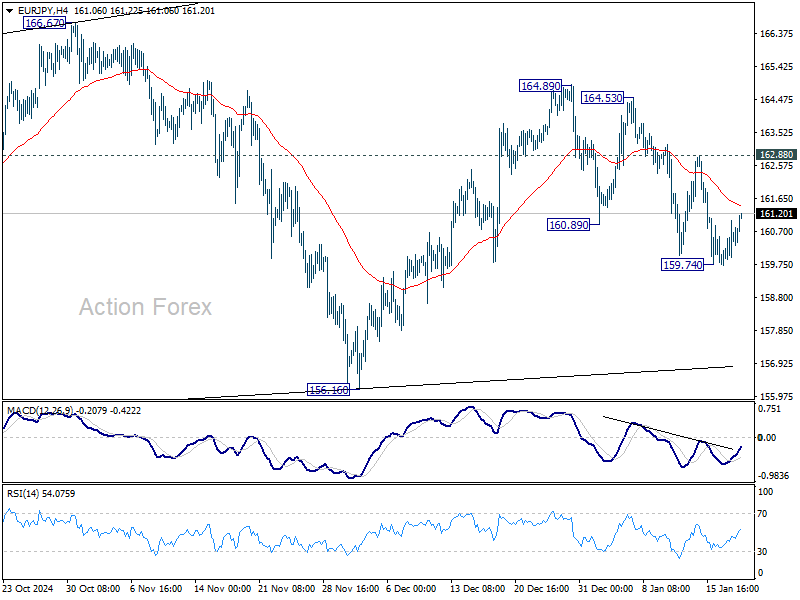
Daily Pivots: (S1) 159.82; (P) 160.42; (R1) 161.12; More...
Intraday bias in EUR/JPY remains neutral for the moment. Recovery from 159.74 might extend, but further decline will remain in favor as long as 162.88 resistance holds. On the downside, below 159.74 will target 156.16 support. On the upside, however, break of 162.88 will bring retest of 164.89 instead.
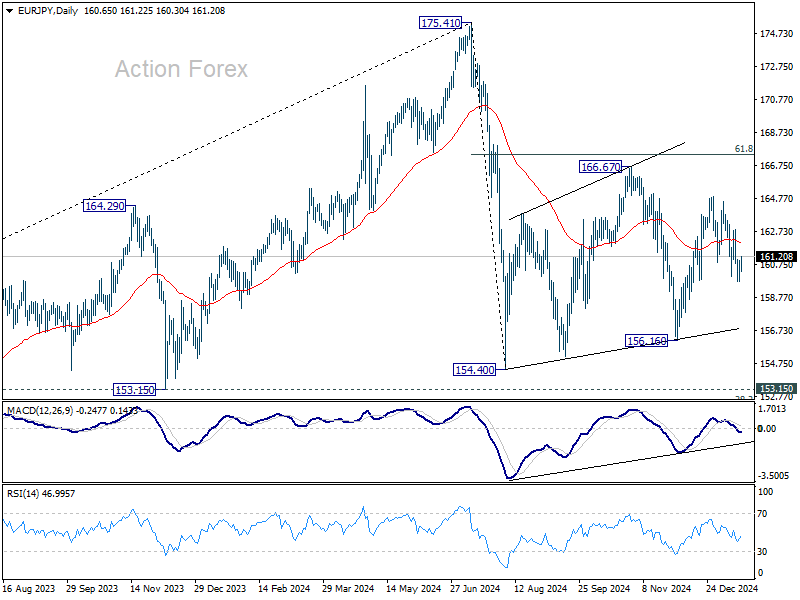
In the bigger picture, price actions from 175.41 are seen as correction to rally from 114.42 (2020 low). The range of consolidation should have been set between 38.2% retracement of 114.42 to 175.41 at 152.11 and 175.41 high. However, decisive break of 152.11 would argue that deeper correction is underway.
EUR/GBP Daily Outlook
Daily Pivots: (S1) 0.8417; (P) 0.8436; (R1) 0.8458; More...
EUR/GBP's rally from 0.8221 picks up momentum again. With break of 0.8446 resistance, next target is 0.8624 key cluster resistance zone. For now, outlook will remain bullish as long as 0.8403 support holds, in case of retreat.

In the bigger picture, a medium term bottom was formed at 0.8221, just ahead of 0.8201 key support (2022 low). But outlook will be neutral as best as long as 0.8624 cluster resistance (38.2% retracement of 0.9267 to 0.8221 at 0.8621) holds. That is, larger down trend from 0.9267 (2022 high) might still extend lower. However, decisive break of 0.8621/4 should confirm trend reversal and turn outlook bullish.

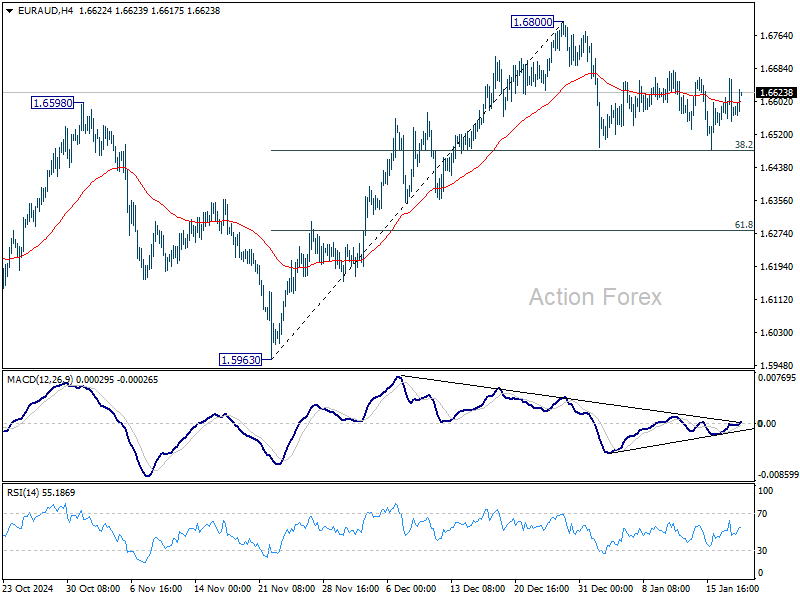
EUR/AUD Daily Outlook
Daily Pivots: (S1) 1.6541; (P) 1.6601; (R1) 1.6650; More...
Range trading continues in EUR/AUD and intraday bias remains neutral. Strong support is still expected from 38.2% retracement of 1.5963 to 1.6800 at 1.6480 to contain downside. On the upside, firm break of 1.6800 will resume the rally from 1.5963. However, sustained break of 1.6480 will bring deeper correction 61.8% retracement at 1.6283 instead.
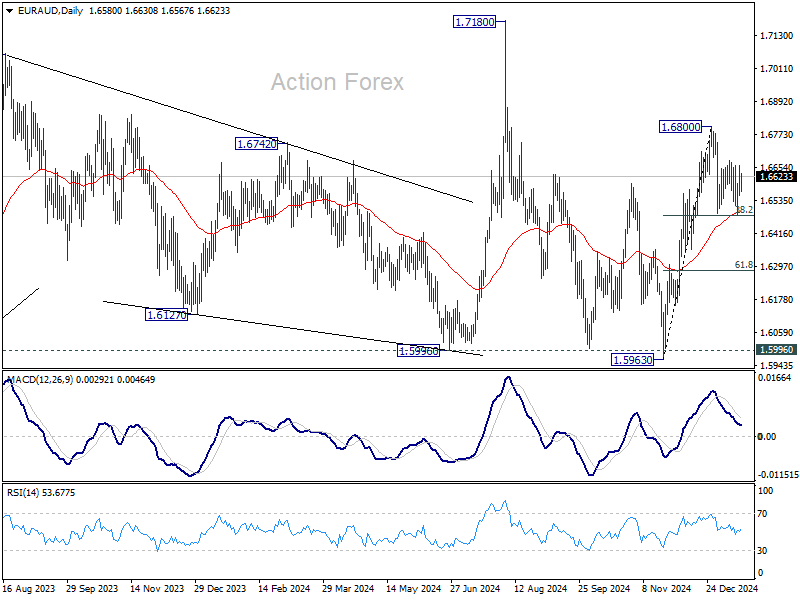
In the bigger picture, EUR/AUD is holding on to 1.5996 key support despite brief breach. Larger up trend from 1.4281 (2022 low) is still in favor to resume through 1.7180 at a later stage. Nevertheless, sustained break of 1.5995 will indicate that such up trend has completed and deeper decline would be seen.
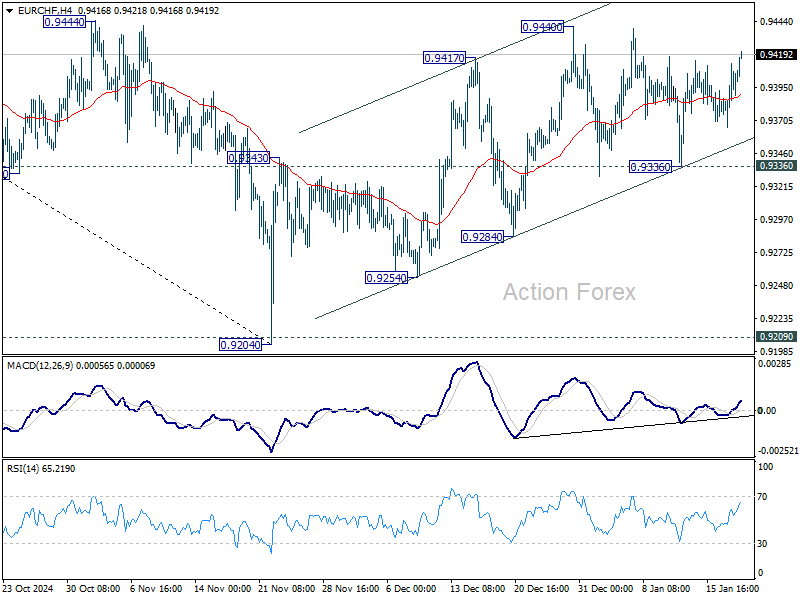
EUR/CHF Daily Outlook
Daily Pivots: (S1) 0.9371; (P) 0.9393; (R1) 0.9419; More....
EUR/CHF bounces today but stays inside range below 0.9440. Intraday bias remains neutral for the moment. Rebound from 0.9204 is seen as a corrective move and could extend above 0.9440 But upside should be limited by 0.9481 fibonacci resistance. On the downside, firm break of 0.9336 support will argue that the correction has completed, and turn bias back to the downside for 0.9284 support first.
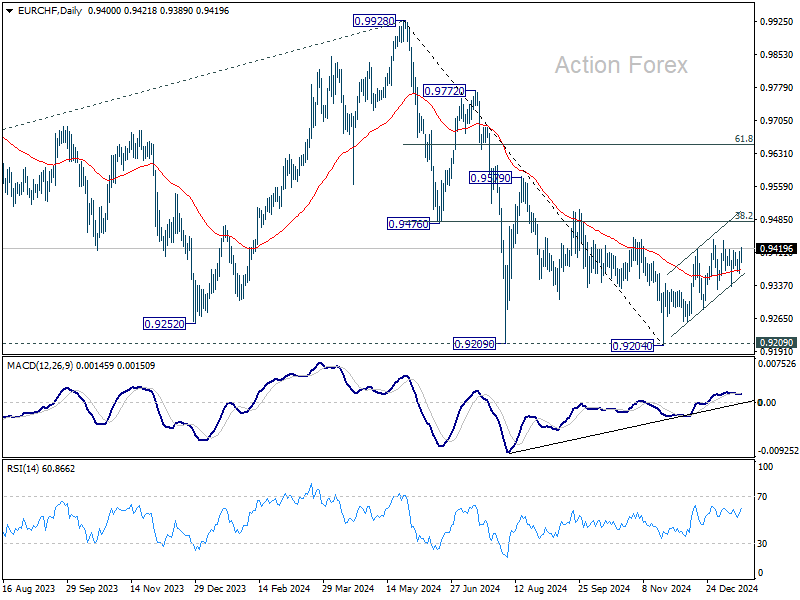
In the bigger picture, while corrective rebound from 0.9204 might extend higher, strong resistance could be seen from 38.2% retracement of 0.9928 to 0.9204 at 0.9481 to limit upside. Down trend from 0.9928 (2024 high) is still in favor to resume through 0.9204/9 support zone at a later stage.
Bitcoin and Solana Reach New Heights
Market picture
The cryptocurrency market witnessed a significant surge in volatility, reaching an all-time high of $3.72 trillion in total capitalisation on Monday morning. This growth was driven by the successful launch of meme coins associated with Trump and his wife, Melania, whose substantial capitalisation growth positively impacted the entire market.
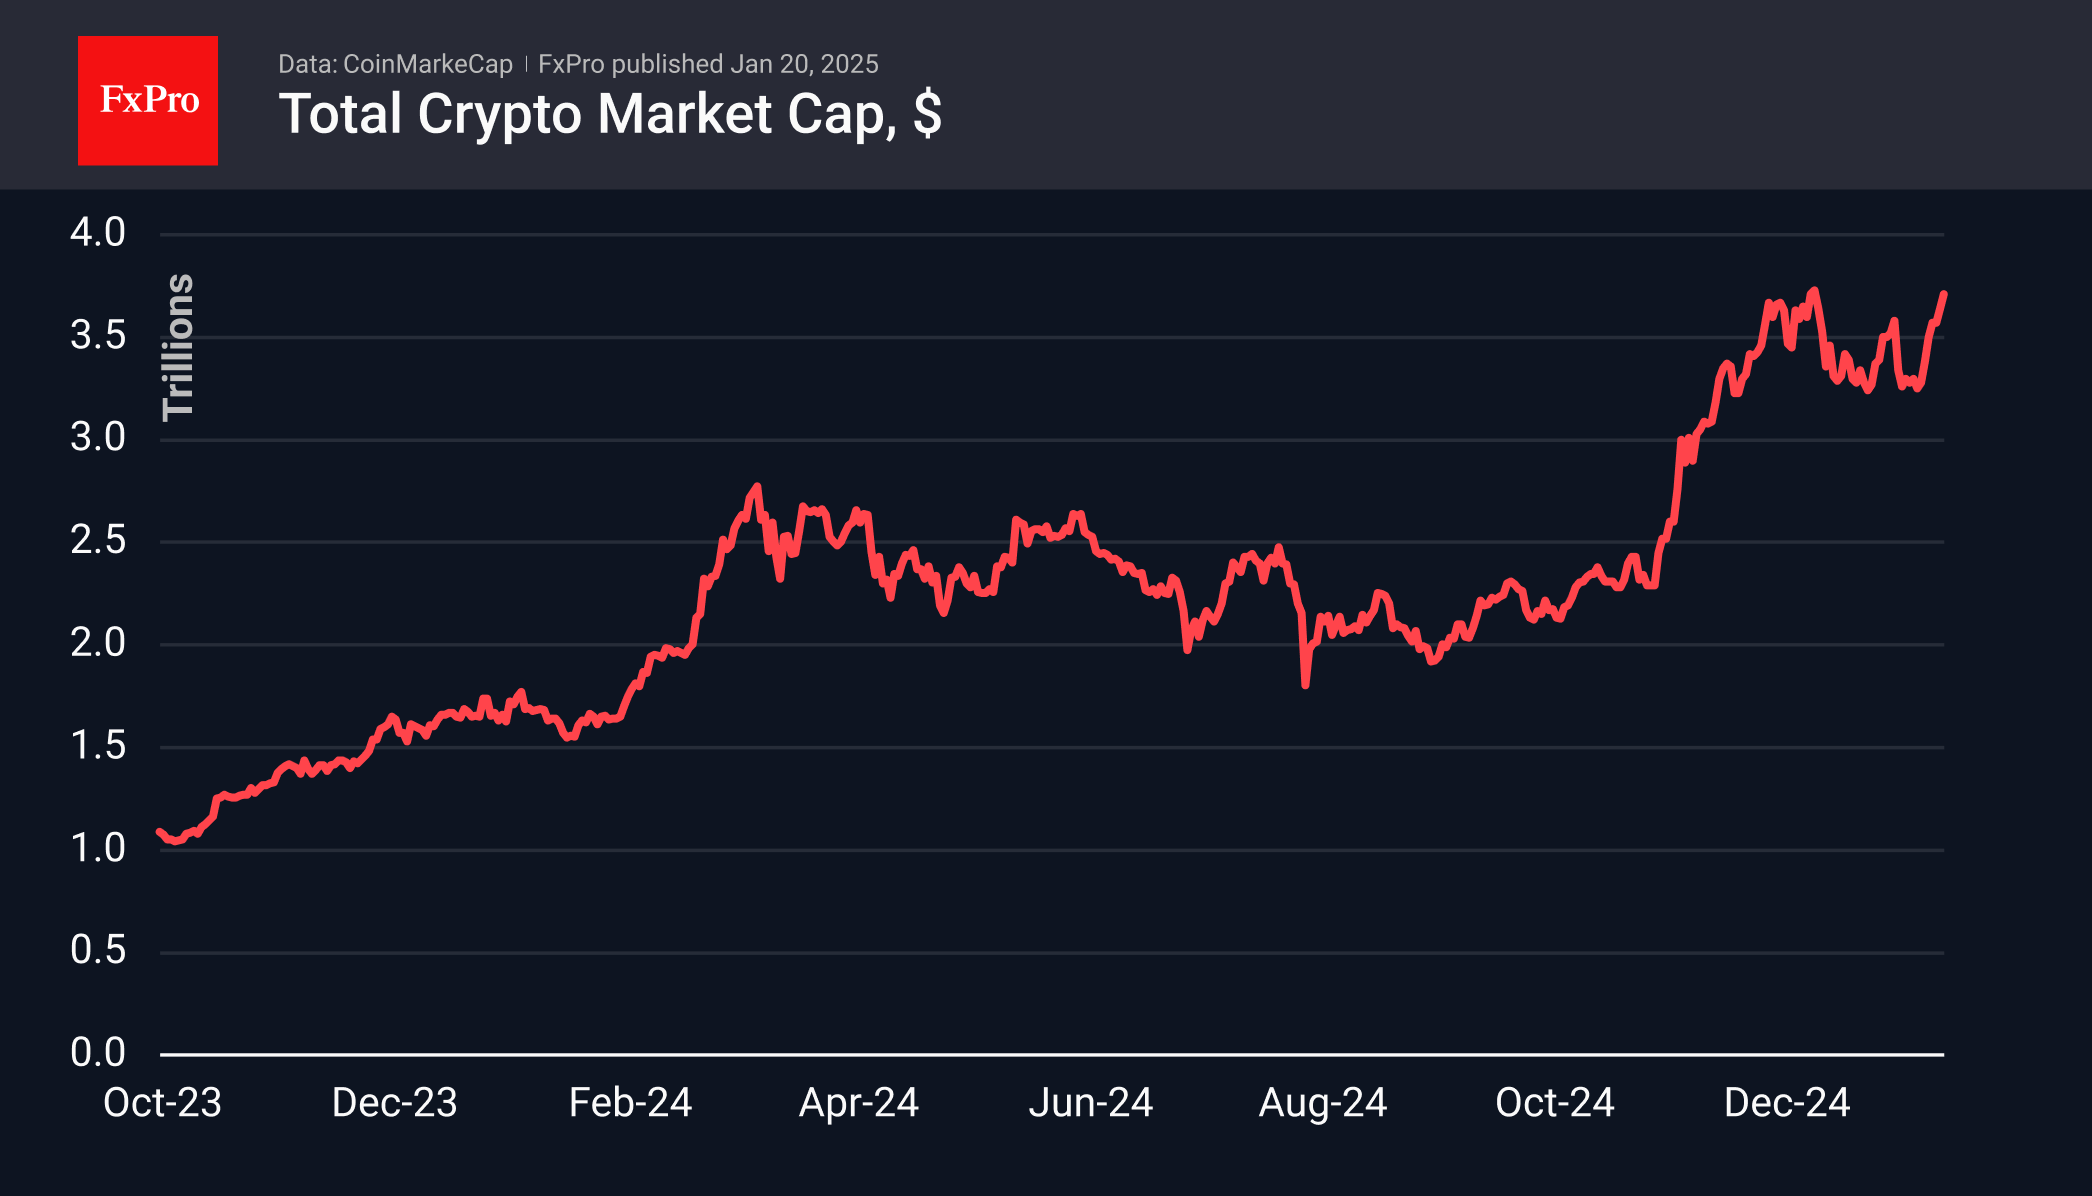
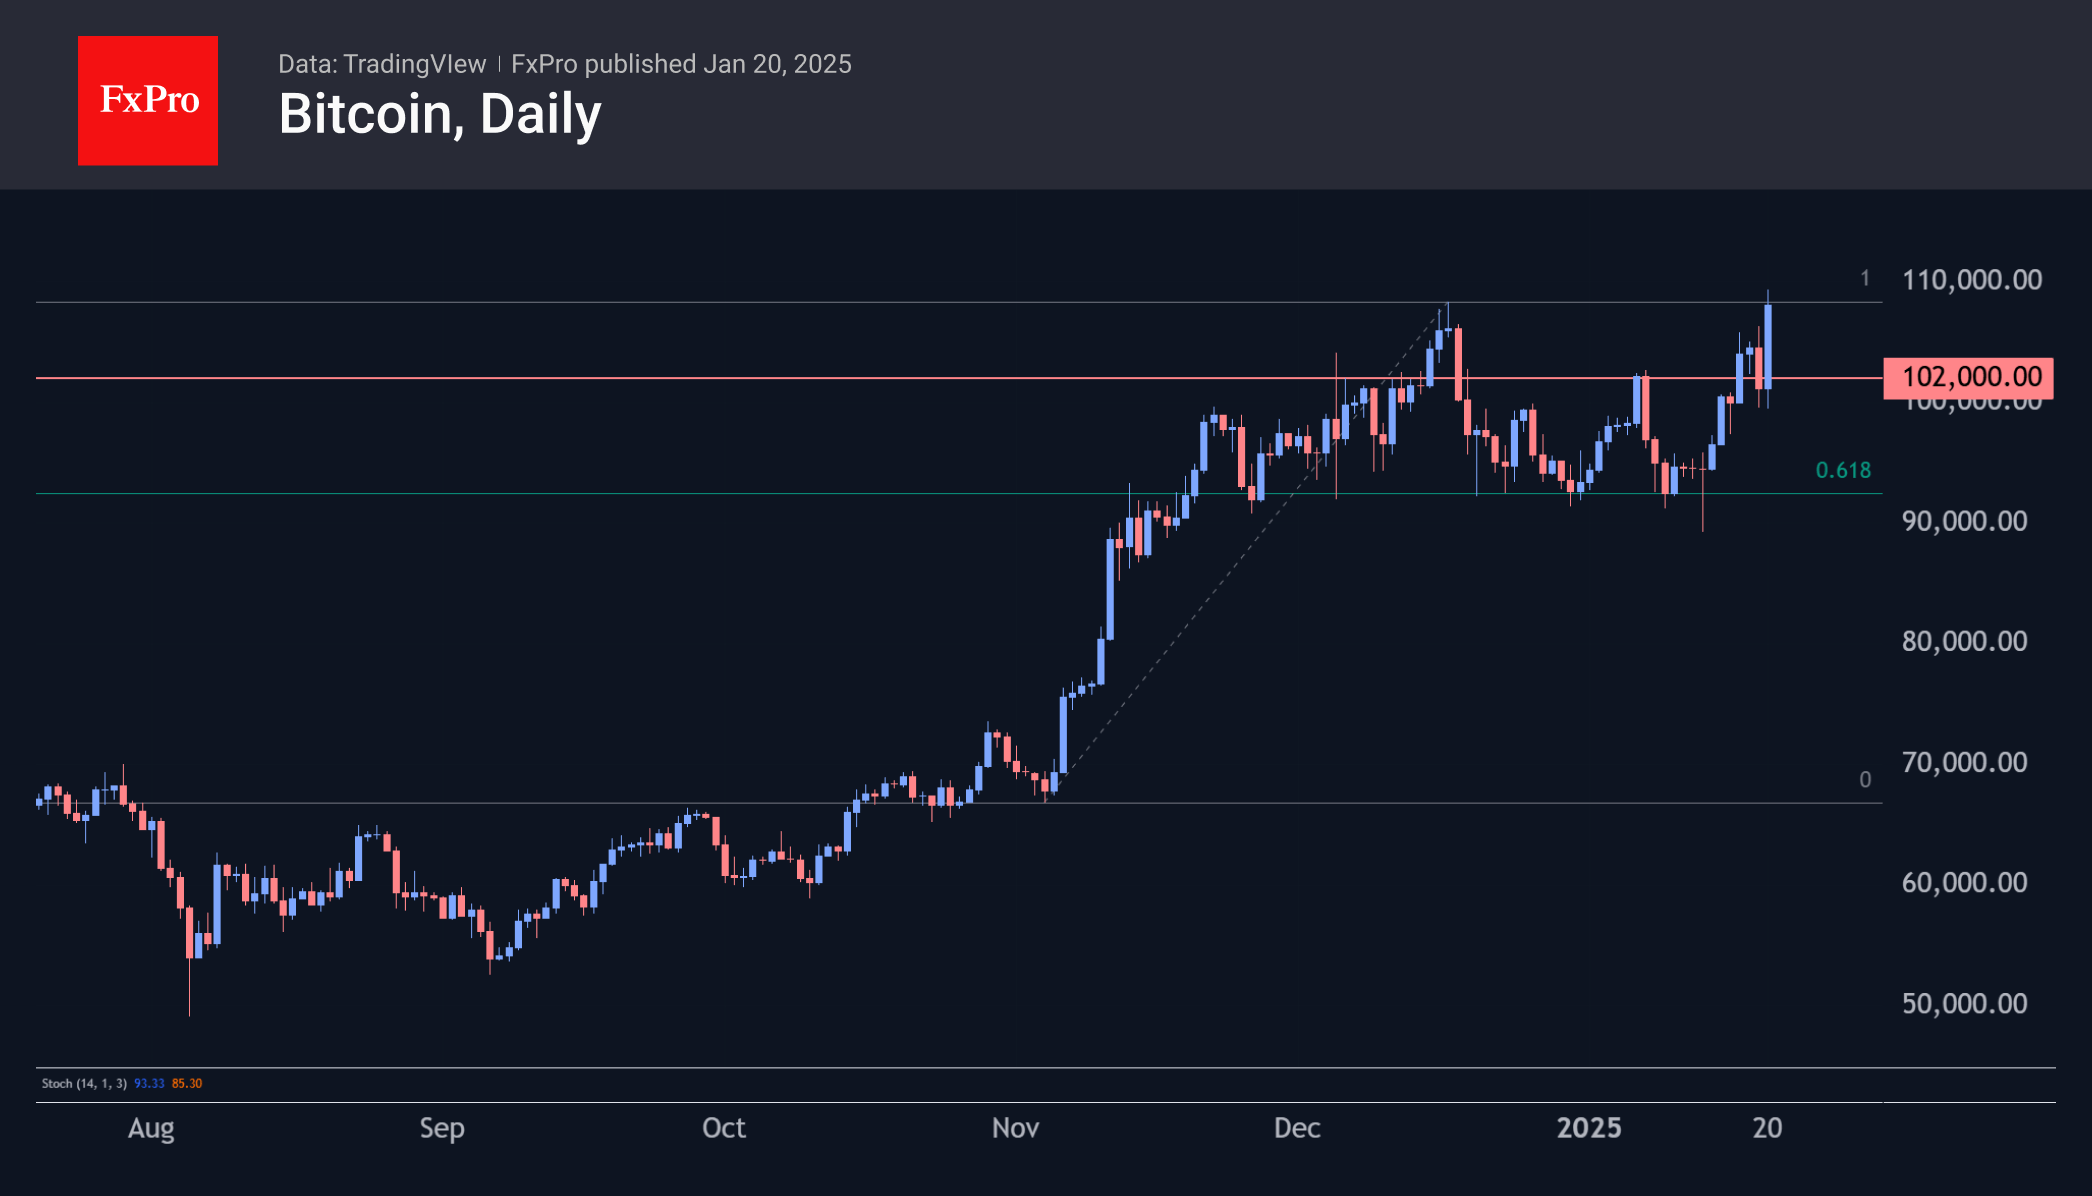
On Monday, prior to the commencement of the active European session, Bitcoin soared to $109.9K, setting a new record high. Subsequently, the price stabilised around $108K. Consolidation at this level may initiate a new growth phase with a potential target of $133K.
Solana emerged as an indirect beneficiary of the recent meme-coin wave. Its price peaked at nearly $300 on Sunday, later stabilising at $270 on Monday. Despite the pullback, these levels exceed the peaks observed in late November and August 2021, dispelling speculation that the recent spike resulted from low weekend liquidity. The current scenario suggests further gains towards all-time highs and increased market enthusiasm (FOMO) with the issuance and trading of meme coins.

News background
Activity in the XRP options and futures markets has surged significantly due to the underlying asset’s meteoric rise. Key metrics indicate investor optimism, as noted by Nansen. On Friday, XRP reached an all-time high above $3.40, spurred by rumours of its inclusion in the US cryptocurrency reserve.
According to calculations by TheMiningMag, public mining companies held more than 92,000 BTC on their balance sheets as of December 2024, marking an all-time high. This figure represents a 136% increase over the year, largely attributed to MicroStrategy’s BTC acquisition strategy.
Ethereum developers have scheduled the Pectra hardfork for the main network in early to mid-March. This significant upgrade will implement a comprehensive list of improvements to the Ethereum platform.
Bloomberg reports that on January 20, the day of his inauguration, Trump intends to issue an executive order designating cryptocurrency as a national priority. This status will require government agencies to collaborate with the industry. Additionally, there are plans to establish a digital asset advisory council to advocate for the industry’s policy priorities.
Market maker Wintermute reported a fourfold increase in over-the-counter (OTC) trading volume on its platform in 2024, primarily driven by strong demand from institutional investors.
USD/CAD Daily Outlook
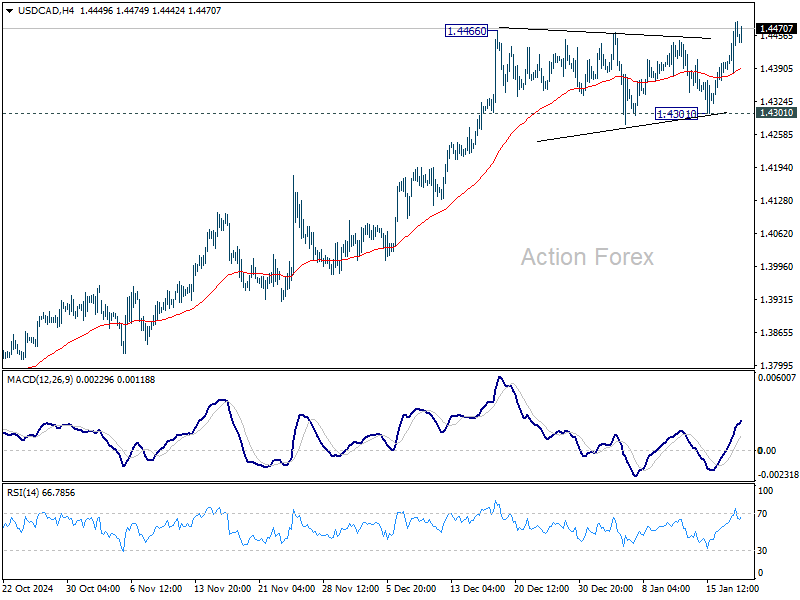
Daily Pivots: (S1) 1.4406; (P) 1.4446; (R1) 1.4520; More...
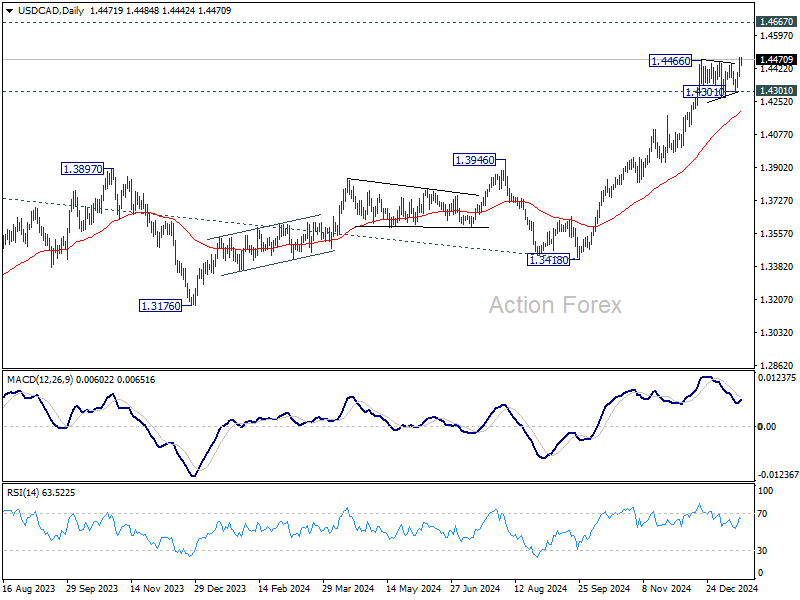
Intraday bias in USD/CAD remains on the upside for the moment. Current up trend should target 1.4667/89 long term resistance zone. For now, outlook will stay bullish as long as 1.4302 support holds, in case of retreat.
In the bigger picture, up trend from 1.2005 (2021) is in progress for retesting 1.4667/89 key resistance zone (2020/2015 highs). Decisive break there will confirm long term up trend resumption. Next target is 100% projection of 1.2401 to 1.3976 from 1.3418 at 1.4993. Medium term outlook will remain bullish as long as 1.3976 resistance turned holds (2022 high), even in case of deep pullback.
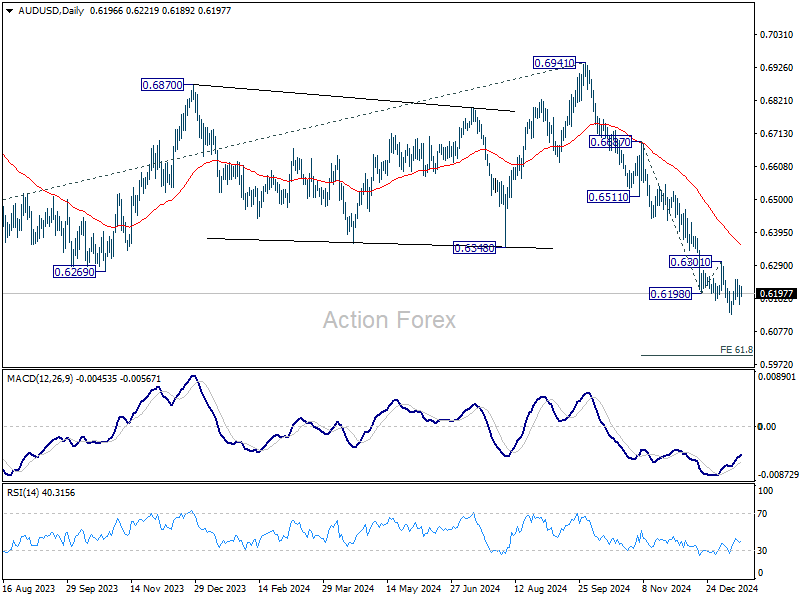
AUD/USD Daily Report
Daily Pivots: (S1) 0.6163; (P) 0.6195; (R1) 0.6226; More...
Intraday bias in AUD/USD remains neutral as consolidations continue above 0.6130 support. Outlook will remain bearish as long as 0.6301 resistance holds. Break of 0.6130 will resume the fall from 0.6941 and target 61.8% projection of 0.6687 to 0.6198 from 0.6301 at 0.5999. However, considering bullish convergence condition in 4H MACD, break of 0.6310 will indicate short term bottoming, and turn bias back to the upside for stronger rebound.
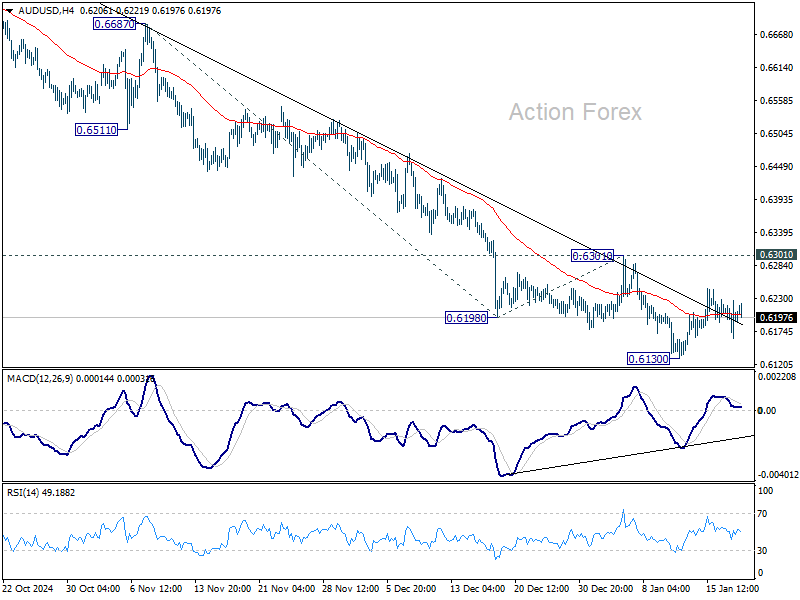
In the bigger picture, down trend from 0.8006 (2021 high) is resuming with break of 0.6169 (2022 low). Next medium term target is 61.8% projection of 0.8006 to 0.6169 from 0.6941 at 0.5806, In any case, outlook will stay bearish as long as 55 W EMA (now at 0.6545) holds.