
Sample Category Title
Elliott Wave View on GBPJPY Looking to Extend Lower in Wave 5
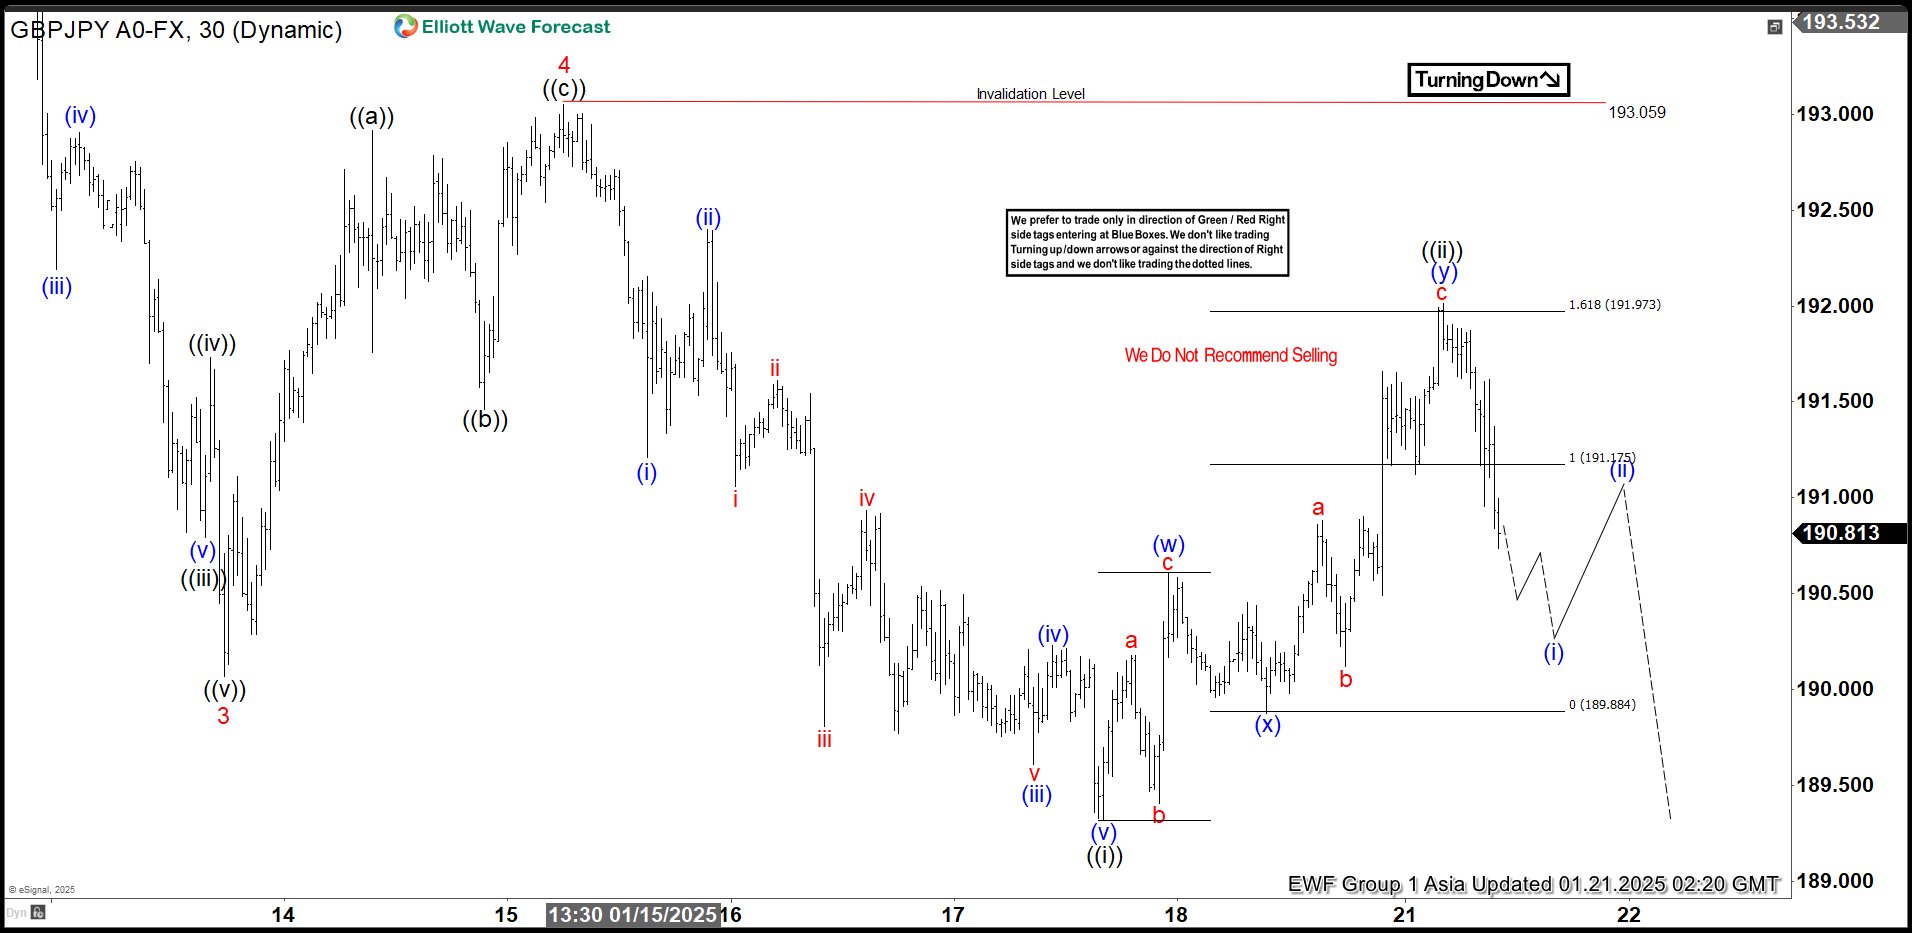
Short Term Elliott Wave view in GBPJPY shows the decline from 12.30.2024 high is in progress as a 5 waves impulse. Down from 12.30.2024 high, wave 1 ended at 195.72 and wave 2 rally ended at 198.25. Pair has resumed lower in wave 3 towards 190.06 as the 30 minutes chart below shows. Wave 4 unfolded as a zigzag Elliott Wave structure. Up from wave 3, wave ((a)) ended at 192.91, wave ((b)) ended at 191.46 and wave ((c)) ended at 193.05. This completed wave 4 in higher degree.
Pair has turned lower in wave 5. Down from wave 4, wave (i) ended at 191.21 and wave (ii) ended at 192.4. Wave (iii) lower ended at 189.6 and wave (iv) ended at 190.2. Final leg wave (v) ended at 189.323 which completed wave ((i)) of 5. Pair corrected higher in wave ((ii)) with internal subdivision of a double three. Up from wave ((i)), wave (w) ended at 190.61 and wave (x) ended at 189.87. Final leg wave (y) ended at 192.01 which completed wave ((ii)) in higher degree. Near term, as far as pivot at 193.05 high stays intact, expect pair to extend lower.
GBPJPY 30 Minutes Elliott Wave Chart
GBPJPY Elliott Wave Video
https://www.youtube.com/watch?v=qYg1wlTynjg
CADJPY Price Action Breakdown
The USDJPY pair fluctuated around the 156.15-156.20 level on Monday. The pair recently bounced off the lower boundary of a long-term upward channel but faced resistance near 156.55-156.60. If the pair breaks above this level, it could rise toward 157.00 and potentially higher to 158.00 or the recent high of 158.85. On the downside, strong support is seen near 155.25 and 155.00, with a break below these levels possibly triggering further declines toward 154.00 or lower. The Japanese Yen gained some support from improving machinery orders and expectations of a Bank of Japan rate hike. At the same time, uncertainty around US trade policies and upcoming events keeps traders cautious.
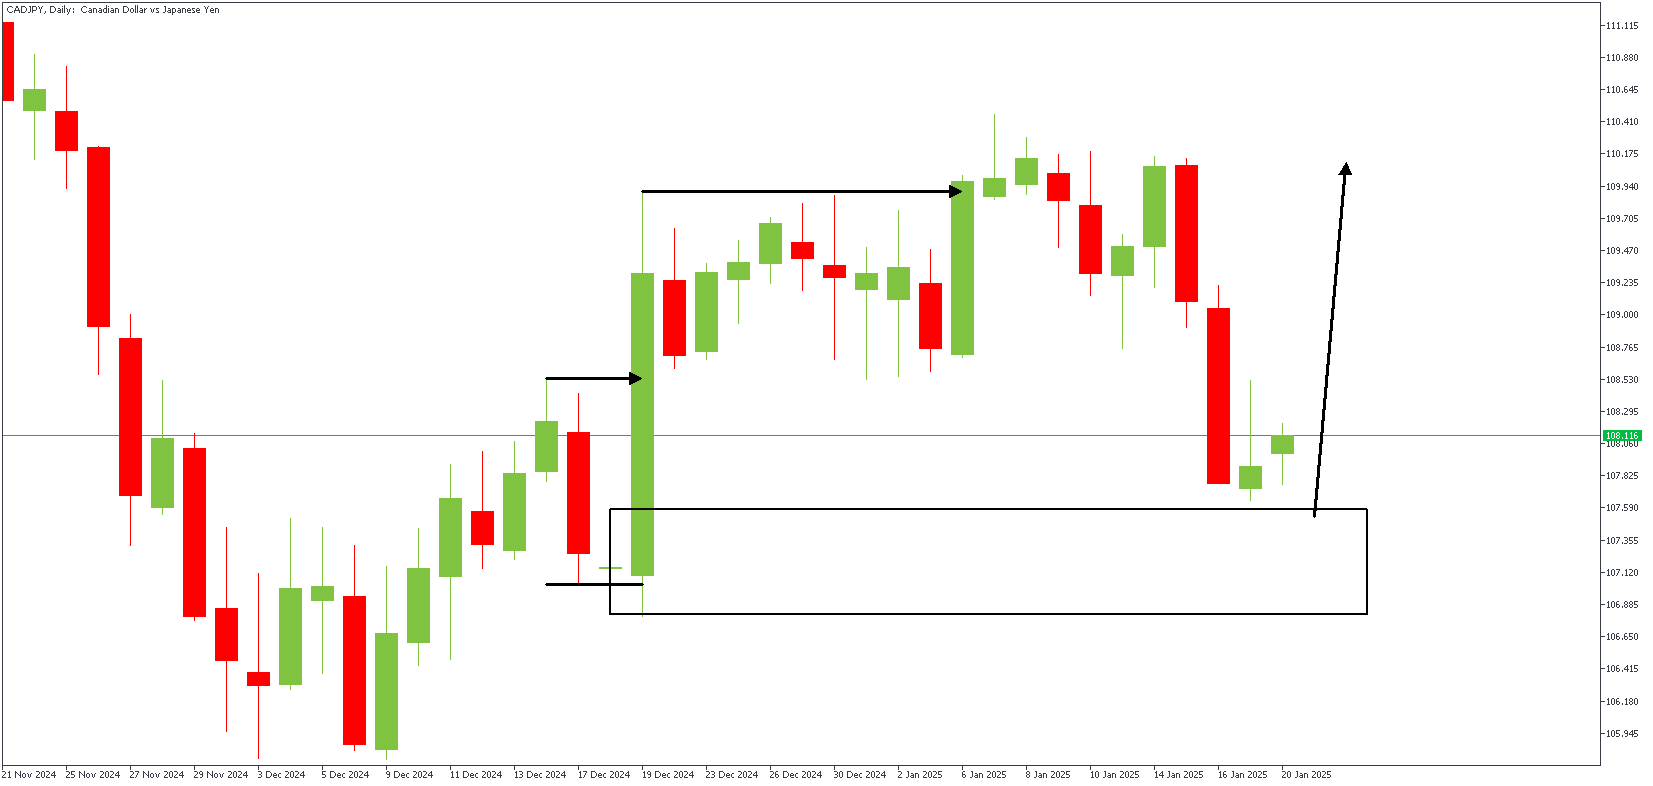
CADJPY – D1 Timeframe
Having an SBR (Sweep-Break-Retest) pattern on the daily timeframe chart often indicates a long-term opportunity. This case is fascinating because of a fair-value gap at the initial break of structure. In any case, the retest of the demand zone is necessary for the bullish sentiment.
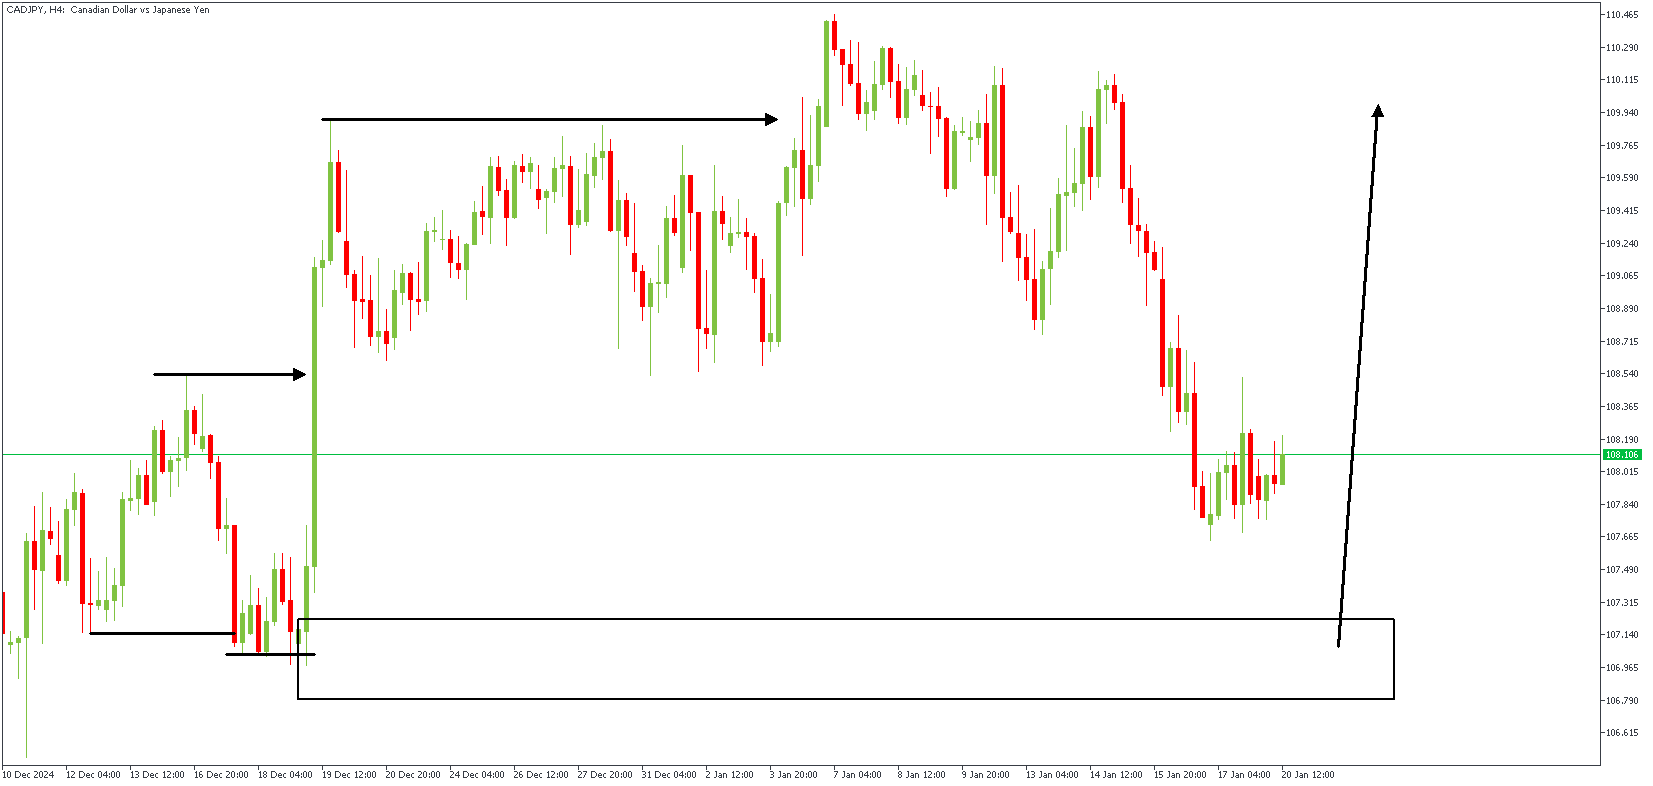
CADJPY – H4 Timeframe
The price action on the 4-hour timeframe chart shows a much clearer picture of the price action. At this point, the SBR pattern is a lot clearer, too. As mentioned earlier, the trigger for the bullish entry is the demand zone, as highlighted by the rectangular shape.
Analyst’s Expectations:
- Direction: Bullish
- Target: 109.919
- Invalidation: 106.193
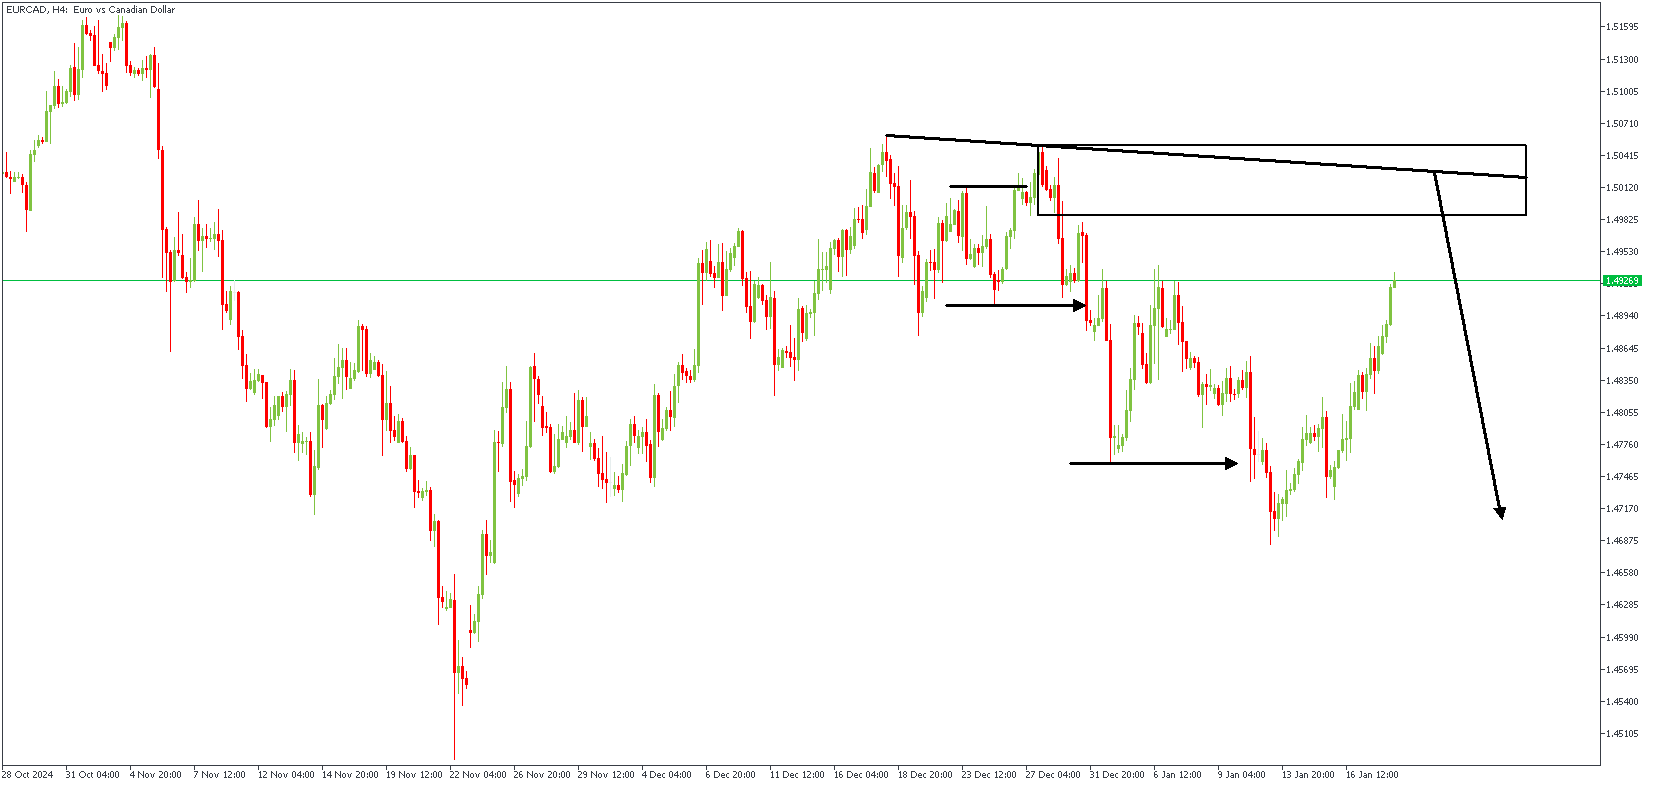
EURCAD Price Action Breakdown
The EURUSD pair remains weak, with key support levels at 1.0176 and the significant parity level at 1.0000. On the upside, resistance is at 1.0436 and 1.0486, while the broader downtrend will likely continue unless the pair breaks above 1.0775. The US Dollar has been under pressure due to disappointing economic data and uncertainty around Federal Reserve policies, while the Euro struggles with weak growth in Europe, especially in Germany. Both central banks—the Fed and ECB—are expected to tread cautiously, with potential rate changes depending on inflation and economic conditions. Investors will watch closely for updates on financial data and policy shifts to gauge the pair’s next moves.
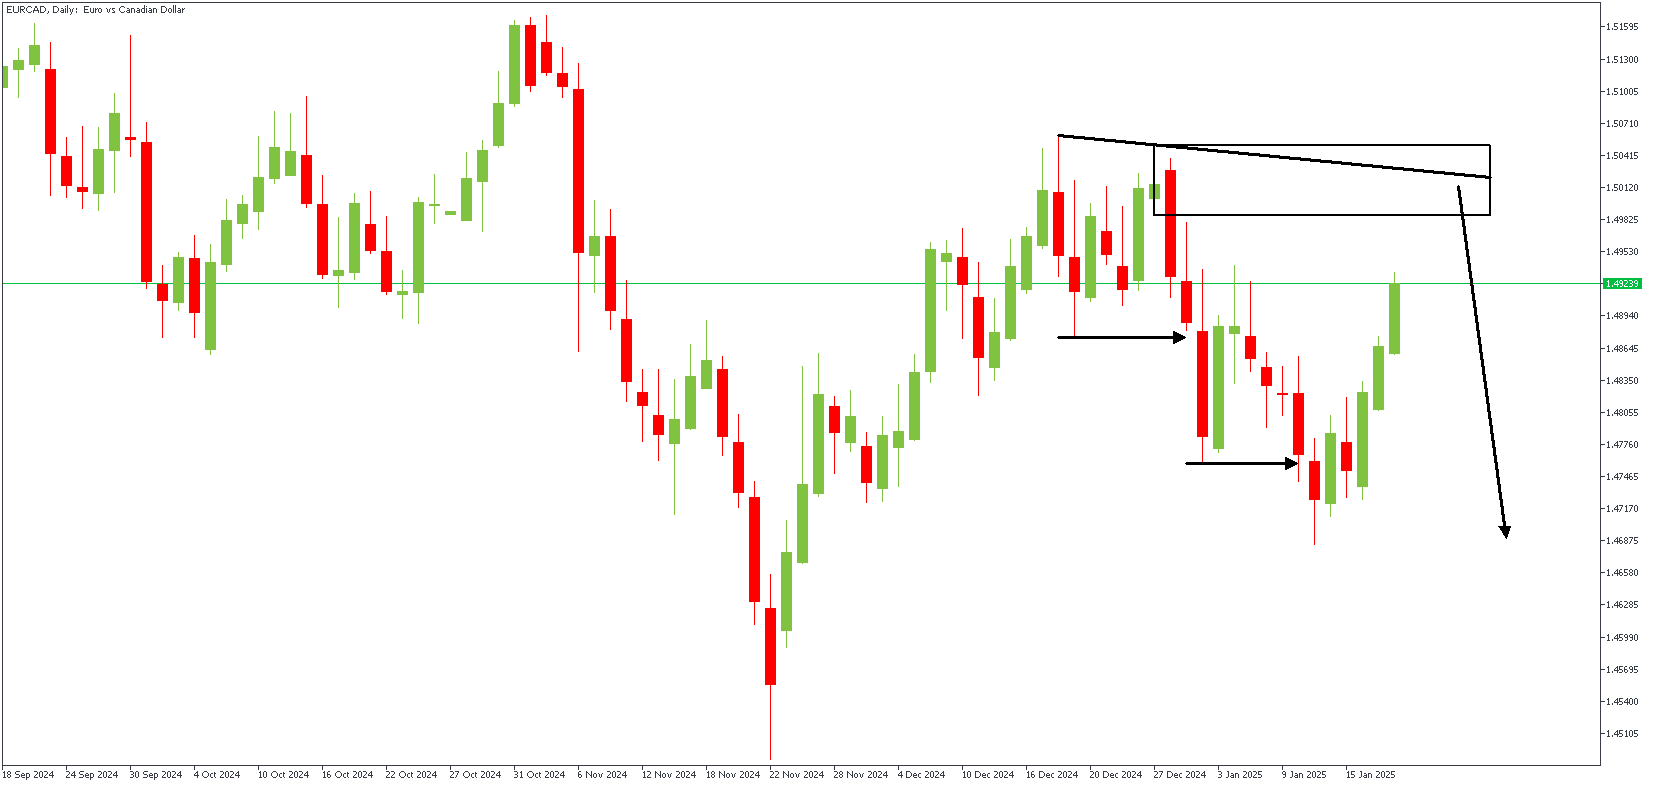
EURCAD – D1 Timeframe
Typically, when price breaks structure on the higher timeframe with a Fair Value Gap, it tends to climb back towards the gap in an attempt to fill it. Currently, on the daily timeframe chart of EURCAD, we find prices inching back towards the FVG region, with further confluence from the rally-base-drop supply zone at the origin of the impulsive move. Let’s see the lower timeframe now.
EURCAD – H4 Timeframe
On the 4-hour timeframe chart, we are presented with an SBR pattern arising from the sweep above the previous high, followed immediately by a break of structure. The retest of the supply zone is the preferred point of entry since it enjoys further confluence from the trendline resistance and is located at the 88% Fibonacci retracement level.
Analyst’s Expectations:
- Direction: Bearish
- Target: 1.47235
- Invalidation: 1.50865
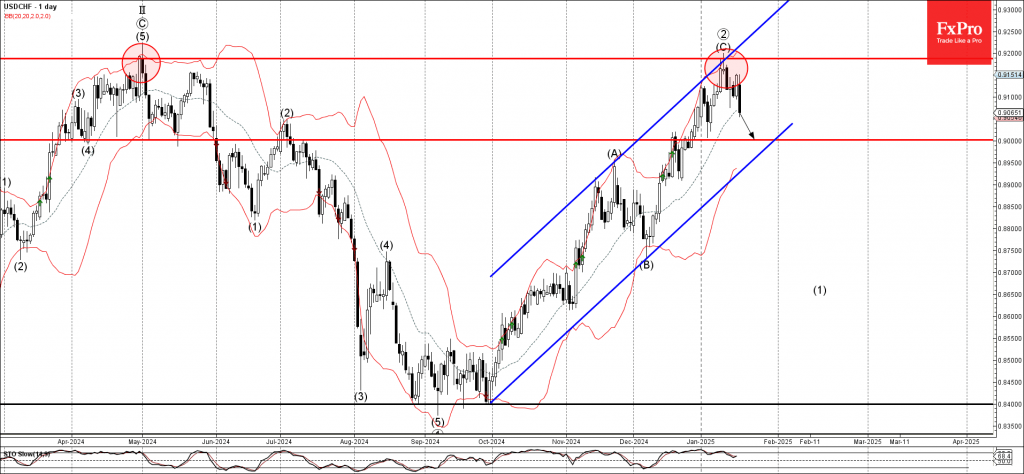
USDCHF Wave Analysis
- USDCHF reversed from the resistance zone
- Likely to fall to support level 0.9000
USDCHF currency pair recently reversed from the resistance zone located between the key multi-month resistance level 0.9185 (which stopped the daily uptrend last April), the resistance trendline of the daily up channel from September and the upper daily Bollinger Band.
The downward reversal from this resistance zone created the daily Evening Star, which stopped the previous sharp upward impulse sequence (C) from December.
USDCHF currency pair can be expected to fall to the next round support level 0.9000, the former resistance from December.
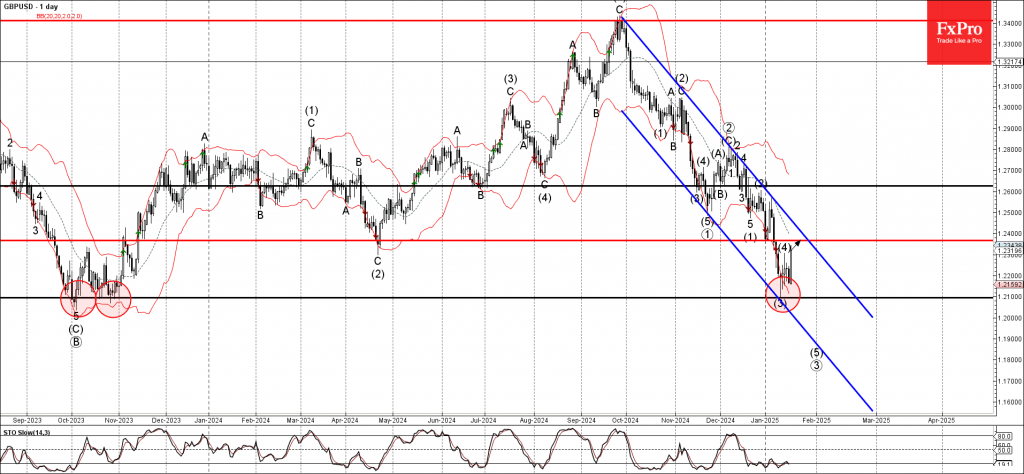
GBPUSD Wave Analysis
- GBPUSD reversed from support area
- Likely to rise to resistance level 1.2365
GBPUSD currency pair recently reversed up with the daily Hammer from the support area located between the long-term support level 1.2095 (former Double Bottom from October), lower daily Bollinger Band and the support trendline of the daily down channel from September.
The upward reversal from this support area started the active medium-term upward correction (4).
Given the strength of the nearby support level 1.2095 and the significant US bearish sentiment, GBPUSD currency pair can be expected to rise to the next resistance level 1.2365.
ECB’s Vujcic sees market pricing of rate cuts as “reasonable”
Croatian ECB Governing Council member Boris Vujcic commented on market expectations for rate cuts during a webinar today, noting that the recent repricing from four to five cuts this year to three to four cuts seems “reasonable.”
He added, “I don’t feel uncomfortable with the current market pricing,” acknowledging the alignment between market sentiment and economic conditions.
However, Vujcic emphasized ECB’s data-driven approach, stating, “Markets have to make these predictions, we don’t. We can always wait for the data and then decide.”
Vujcic also highlighted ECB’s achievement in taming inflation without triggering a recession, often referred to as a “soft landing.” However, he cautioned that while the worst-case economic outcomes have been avoided, the lack of significant growth momentum raises concerns about stagnation.
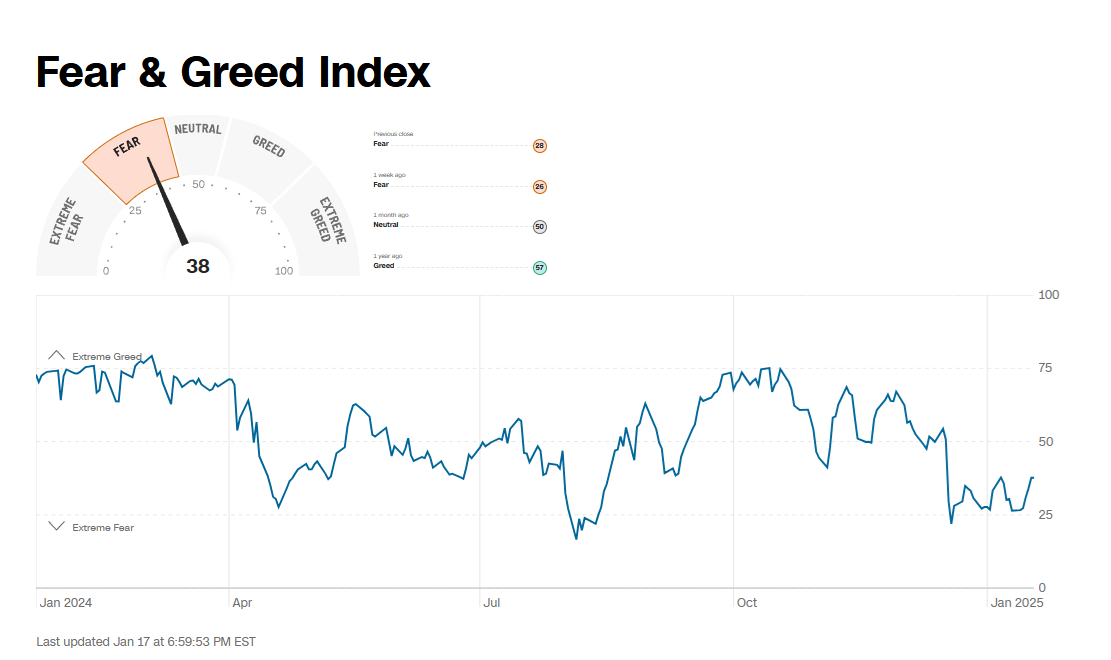
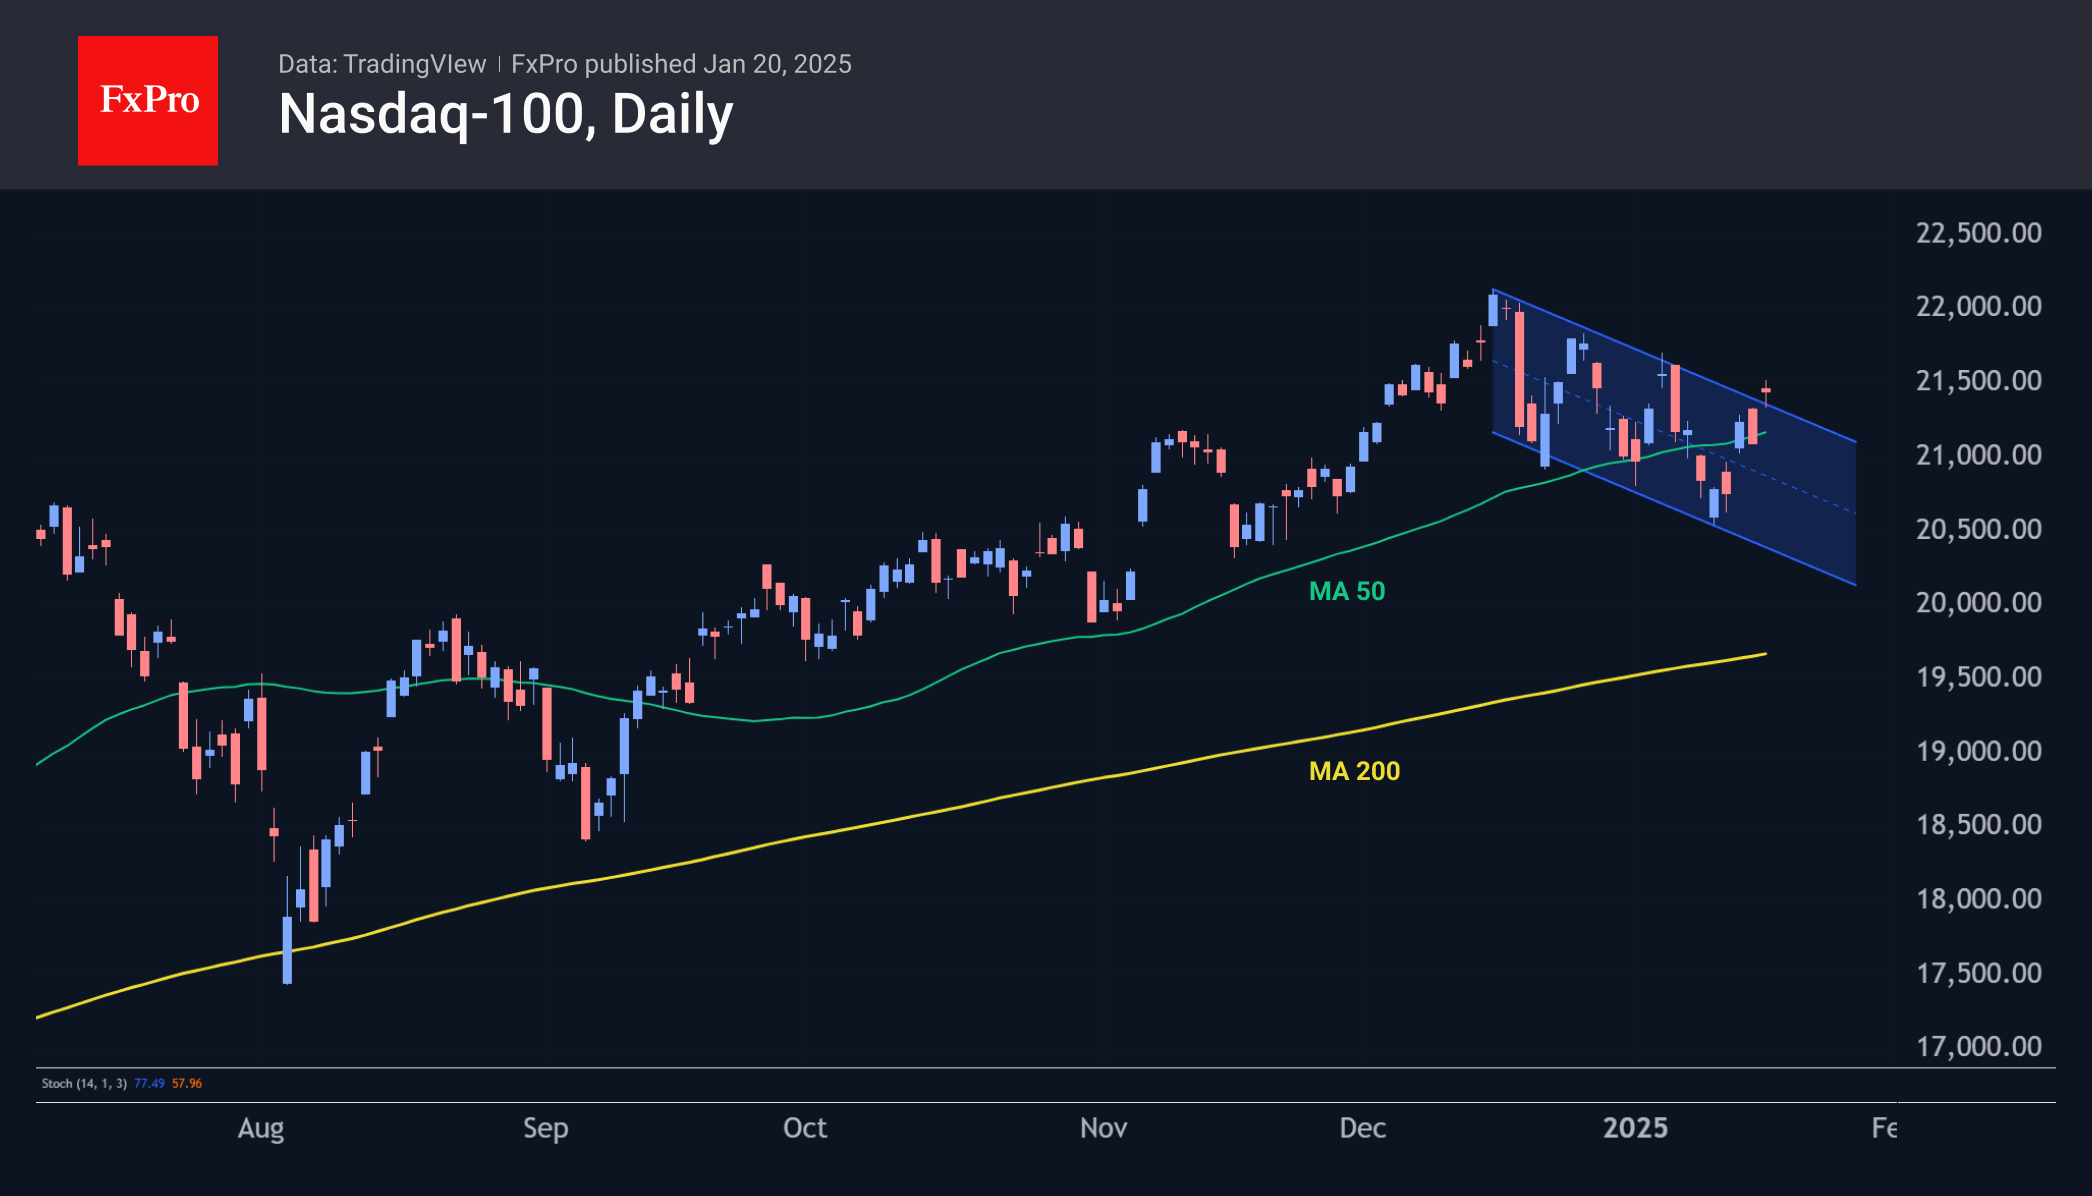
Stock Gains Potentially Poised for Extension, Building Momentum
Nasdaq-100 futures are currently approximately 3% below their all-time highs, while the S&P 500 is down by less than 2% from its highs. However, fear has been driving stock markets for over a month now, according to a widely recognised sentiment index. This divergence suggests further potential upside for stocks rather than indications of a problem.
In the latter half of December, the sentiment index entered fear territory, reaching extreme levels. Despite this, equity indices have been on an upward trajectory, although the sentiment index continues to lag behind.
We attribute much of the pressure in equities to the accumulated need to release pressure after a substantial run-up through 2024. The stated reason was the hawkish shift from the Federal Reserve, which began to soften somewhat last week.
Strong heavyweights led the charge as the S&P 500 and Nasdaq-100 added 4.3% and 5% from the lows at the start of last week, respectively. Meanwhile, the ‘breadth’ and ‘strength’ components of stock gains remain in ‘extreme fear’ territory. This is a common theme at turning points, where robust companies are the first to rebound from the bottom.
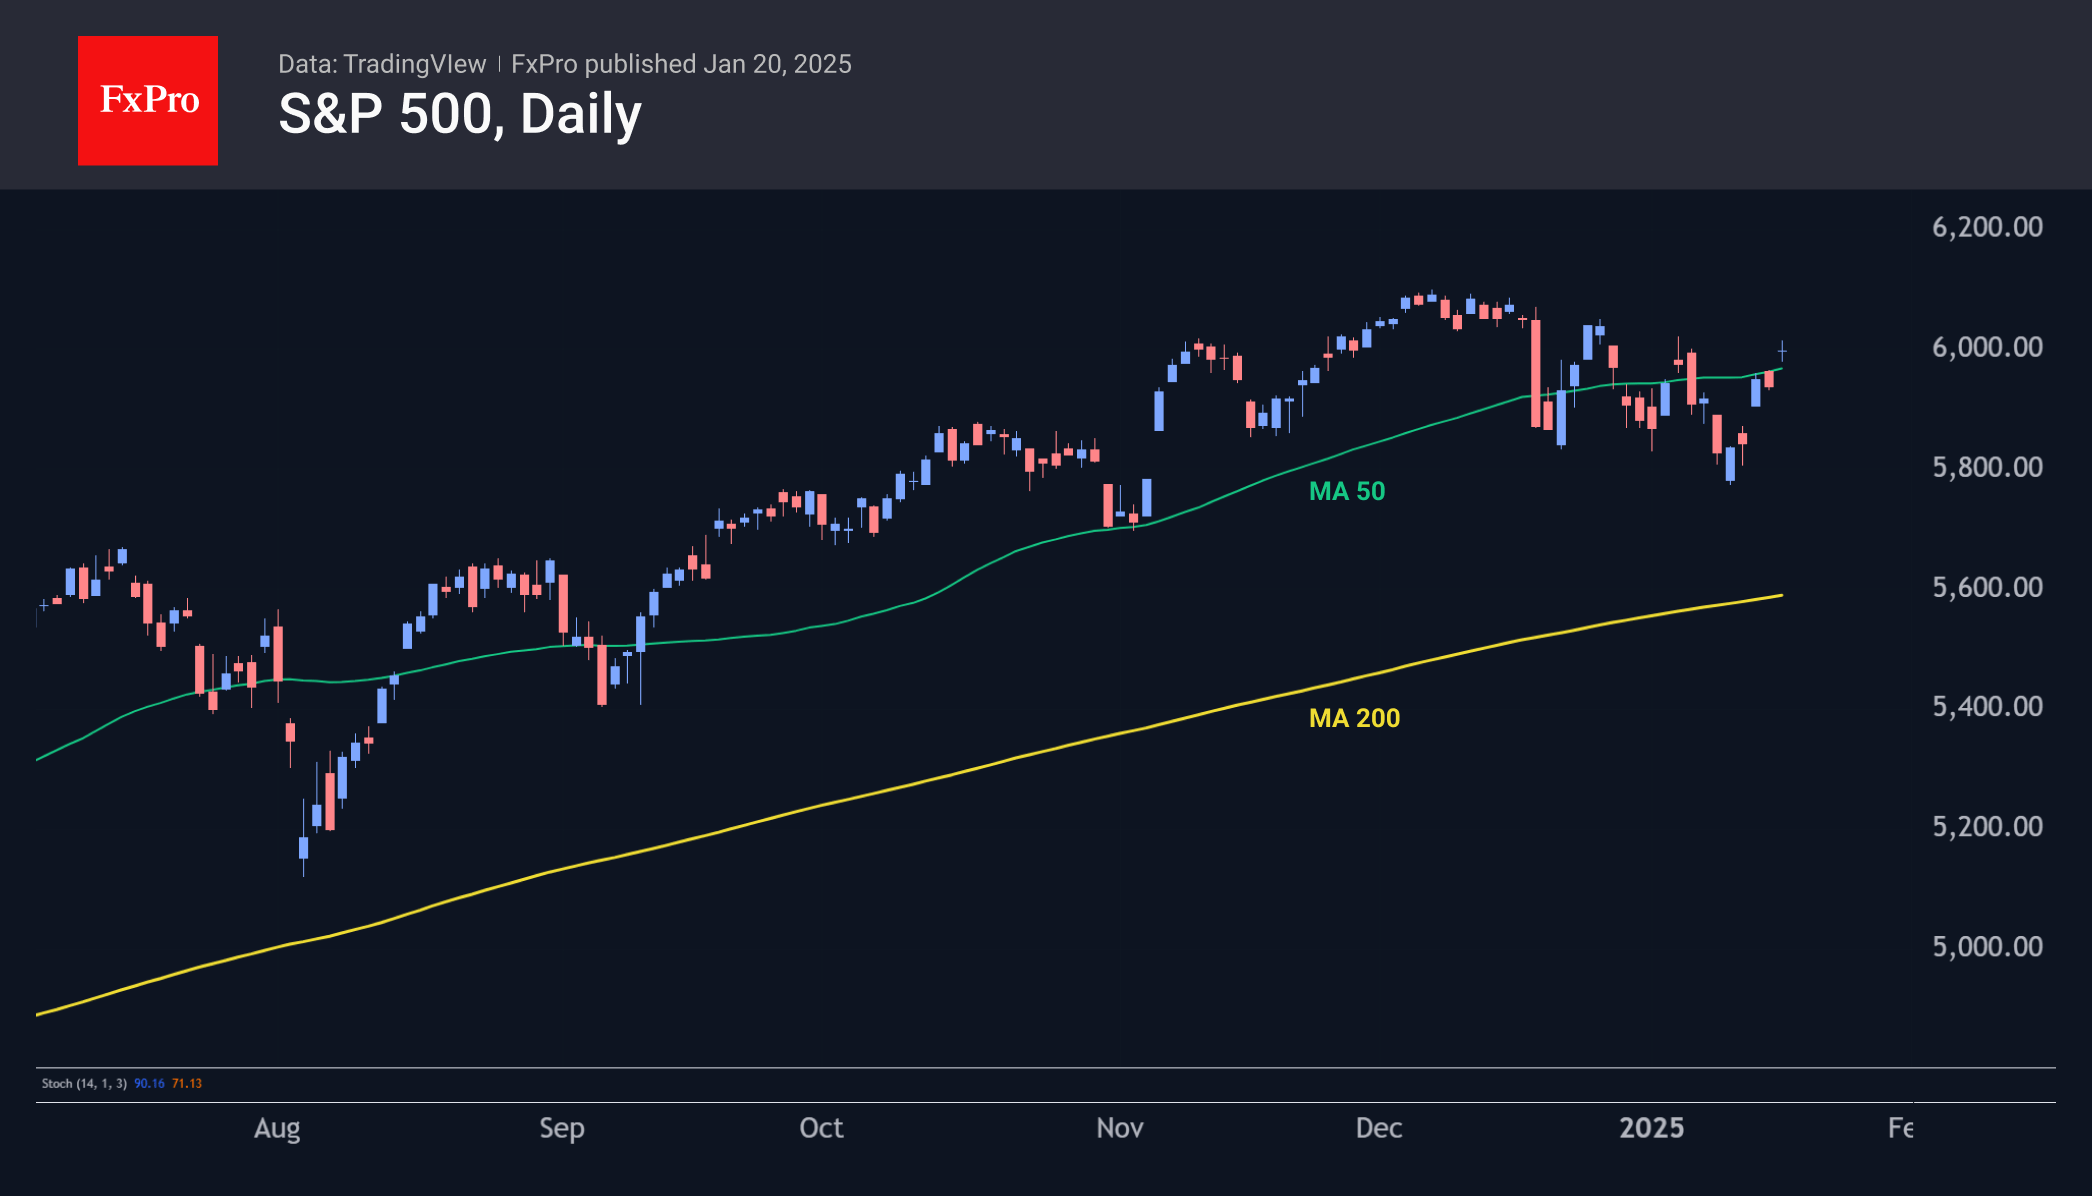
With the latest momentum, the market is demonstrating that the growth drivers—AI stocks and high-value stocks—from the previous year remain in place. Simultaneously, the Nasdaq-100, currently above the 21500 level, is close to breaking the recent downtrend and has already made a solid recovery above its 50-day moving average as of Friday.
The full occupancy of the White House under Trump’s administration promises numerous sudden surprises and frequent shifts in trends based on his comments. However, we believe that upside and downside risks are well balanced, and it is an opportune moment for the term ‘risk’ not to carry exclusively negative connotations.
Stronger stocks typically precede broader market movement, and the low values of the breadth and strength components, which have been rising steadily over the past week, indicate a high potential for such a scenario.
The strong rally in European indices shows evidence that the market is in a bullish phase and not significantly impacted by Trump. For instance, the German DAX40 and British FTSE100 both increased by over 4.5% over the week, confidently entering their all-time high territories. Their growth on Monday was also unaffected by the dollar’s decline of more than 1% against the euro and the pound.
In summary, the growth of key US indices may continue in the coming days due to increasing risk appetite across a wider range of stocks. Under these conditions, the Russell 2000 index and the Dow Jones may exhibit outperformance as they attempt to catch up.
Dollar Dips Across the Board on Signals US Tariffs May Not Be Imposed Immediately
The dollar index was sharply down in early US trading on Monday (losing 1% so far) in immediate reaction on media report, saying that new US President will stop short on imposing new tariffs on his first day.
Tariffs were among other measures on Trump’s list to be executed as soon as he officially becomes the President and current decision could be seen rather as a temporary delay, which brought a dash of optimism, than any other scenario.
Trump’s administration has an investigation of trade issues (deficits and unfair trade practices) as a top priority and tariffs are likely to be used in a carrot and stick scenario, until target is reached.
The US economy faces strong gap in trade exchange with the Eurozone and sees China as a major threat, though Trump may react differently this time and try to achieve the goals more diplomatic way.
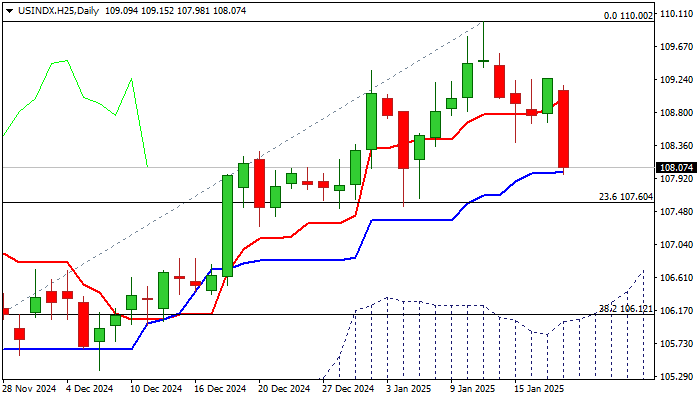
Daily studies are weaker, as the latest pullback broke some technical supports and completed Head and Shoulders pattern on daily chart.
Bears pressure support at 108.00 (daily Kijun-sen) and eye next pivot at 107.60 (Fibo 23.6% of 99.84/110.00 rally / former higher base), violation of which to validate bearish signal and open way for deeper pullback towards 106.12 (top of rising daily Ichimoku cloud / Fibo 38.2%).
On the other hand, larger bulls remain in play and current easing could be seen as a healthy correction, preceding fresh push higher.
The notion is supported by expectations that Trump won’t move significantly away from his initial (dollar supportive) plan but would rather be more flexible in some situations.
Res: 108.40; 109.00; 109.25; 110.00
Sup: 107.60; 106.97; 106.70; 106.12
Sunset Market Commentary
Markets
Markets today ‘enjoyed’ some final calm before the expected storm. US markets are closed for Martin Luther King Day, given investors an additional day to reassess their strategy before Donald Trump later takes office as president of the US. Already at its first working day, he is expected to kickstart a policy U-turn with a barrage of sweeping executive orders on everything ranging from migration and boarder control, over US energy production and broad deregulation. Trump also was expected to announce multiple layers of trade tariffs. However, the Wall Street Journal today reported that Trump in a first step is planning to issue a broad Memorandum that directs federal agencies to study US trade policies and evaluate trade relationships with its neighbors and China. However, the action is said to stop short of already imposing new tariffs. This at least supported risk sentiment on European markets intraday. Already for quite some time, the expected US measures were some kind of a black box as investors were obliged to guess the potential impact on growth and inflation inside and outside the US. A high degree of unpredictability will probably remain the watermark of Trump policy, but of over the next 24 hours investors will get a first insight on the degree of disruptiveness of the new policy for actors inside and outside the US. Up until new, the ‘preamble Trump trade’ mostly consisted of higher US yields, a stronger dollar and US equities outperforming most of their ‘friends’/‘allies’. Even as quite some ‘Trumpism’ should already be discounted it would be a surprise for the first flood of voluntary Trump measures to already profoundly reverse the trends of higher (US) yields and a stronger dollar. Looking at the strong performance of European equity markets today and over the previous week, investors apparently consider(ed) a WSJ like scenario were tariffs on trade with Europe won’t be overly disruptive and/or that already quite some negative news is discounted from now.
Returning to day-to-day price action in Europe, the EuroStoxx 50 index (+0.6%) is trading at the highest level since September 2000! After having jumped to level north of $82 p/b last week, Brent oil today drops back below $80. As one of its first measures, US president Trump is rumoured to possibly declare an Energy Emergency in order to facilitate the production and export of US fossil energy and to take measures to decrease domestic US energy costs. EMU interest rate markets show yield changes of 1-2 bps max across the curve. Dollar moves initially also were limited but the US currency fell off a cliff after the WSJ headlines. DXY dropped about 1.0% to trade near 108.25. EUR/USD jumped from the 1.0315 area to 1.042.
News & Views
Slovakia kicked of this year’s debt issuance with a regular auction. Four bonds were on offer, raising a combined €812mn instead of the targeted €600mn with total demand almost reaching €2bn. The country has an estimated gross issuance need of €12bn this year. Debt agency Ardal intends to raise half of that amount via syndicated deals and half via auctions like today. Three new bonds will be launched in one of those processes: a 4-yr, a 12-yr and a 15-yr(+) one. Today’s auction was overshadowed by political developments over the weekend. Smer party member and deputy speaker Gasper suggested that Slovakia could in the future consider leaving the EU and NATO though that would be an extreme solution. Slovak PM Fico indirectly backed his opinion by saying that the country should prepare for any possible EU-crisis. PM Fico holds together a very fragile and narrow coalition government with snap elections before the autumn of 2027 not ruled out.
Several members of the Polish central bank hit the wires today, softening last week’s hawkish (solo?) by NBP President Glapinski. The chairman suggested unaltered policy rates over 2025. While today’s comments of NBP Tyrowicz, Wnorowski and Kotecki all suggest that it will be premature in March, despite updated growth and inflation forecasts, to put a policy rate cut on the table, they all leave more maneuvering room for the rest of the year. Energy regulations will obviously be key – without subsidy extension they’ll push inflation higher again in Q4 2025 - with NBP Kotecki also referring to the presidential ballot mid-May and early-June. Leading candidate of the ruling party of PM Tusk has criticized the hawkish Glapinski (confidant of previous PiS-government) turn as being politically motivated. The Polish presidency is more than a ceremonial function with current PiS-president Duda hampering the political decision making process. The Polish zloty holds strong, continuing the test of EUR/PLN 4.25 support.