
Sample Category Title
GBP/USD Daily Outlook
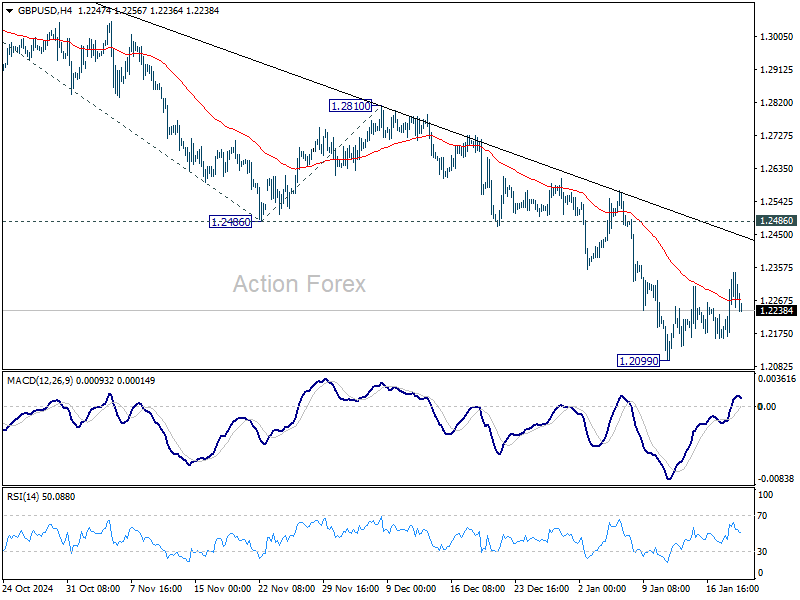
Daily Pivots: (S1) 1.2211; (P) 1.2278; (R1) 1.2395; More...
GBP/USD is still extending the consolidation pattern from 1.2099 and outlook is unchanged. Intraday bias stays neutral and further decline is expected with 1.2486 support turned resistance intact. On the downside, break of 1.2099 will resume the fall from 1.3433 to 100% projection of 1.3433 to 1.2486 from 1.2810 at 1.1863.
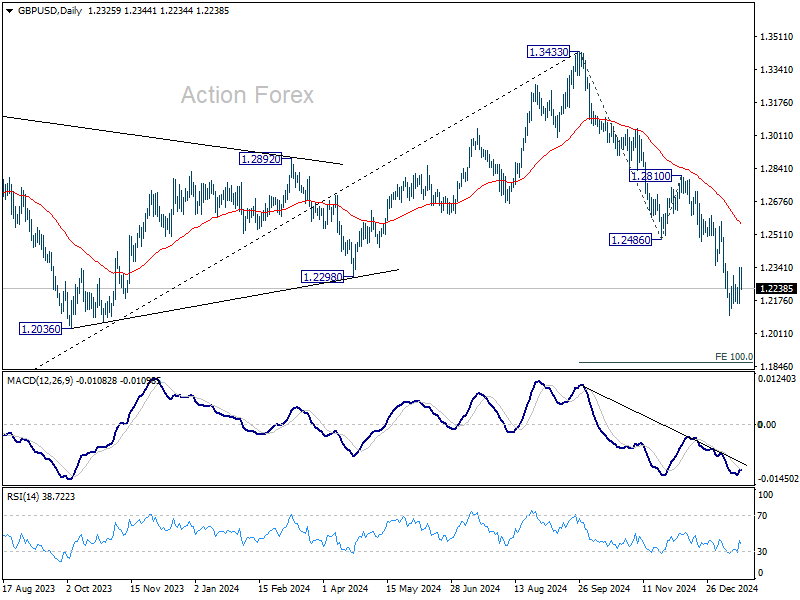
In the bigger picture, rise from 1.0351 (2022 low) should have already completed at 1.3433, and the trend has reversed. Further fall is now expected as long as 1.2810 resistance holds. Deeper decline should be seen to 61.8% retracement of 1.0351 to 1.3433 at 1.1528, even as a corrective move.
USD/CHF Daily Outlook
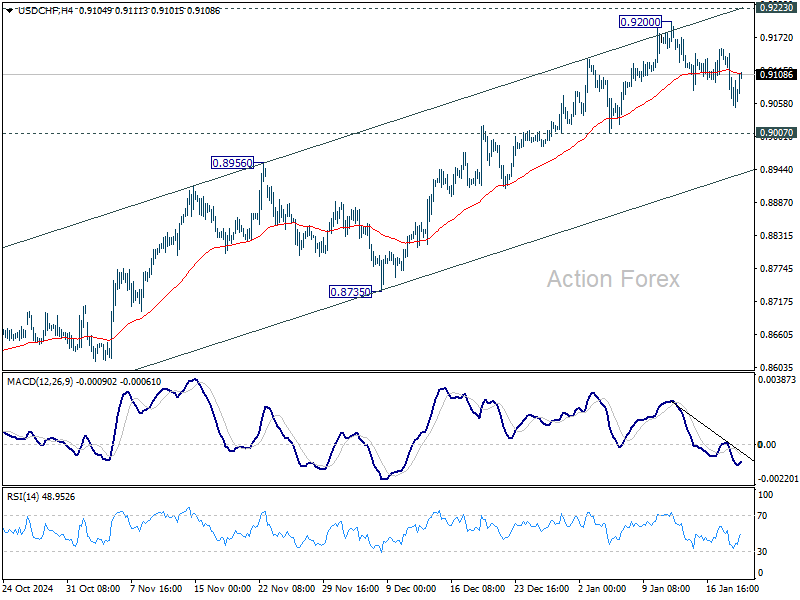
Daily Pivots: (S1) 0.9031; (P) 0.9092; (R1) 0.9128; More…
USD/CHF is still extending the consolidation pattern from 0.9200 and outlook is unchanged. Intraday bias remains neutral, and further rally is expected with 0.9007 support intact. On the upside, decisive break of 0.9223 will carry larger bullish implications. However, break of 0.9007 will confirm short term topping, and turn bias back to the downside for 55 D EMA (now at 0.8948).
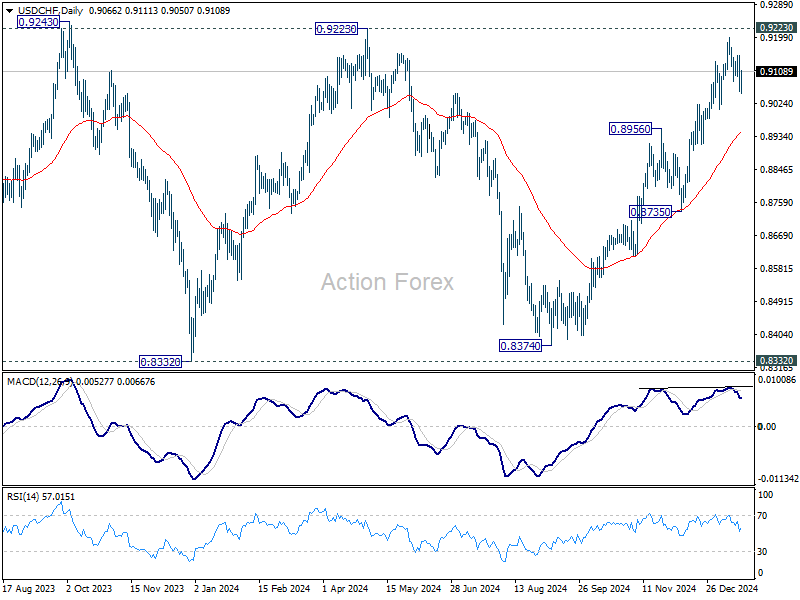
In the bigger picture, as long as 0.9223 resistance holds, price actions from 0.8332 (2023 low) are seen as a medium term corrective pattern. That is, long term down trend is in favor to resume through 0.8332 at a later stage. However, sustained break of 0.9223 will be an important sign of bullish trend reversal.
Japanese Yen Strengthens to a Monthly High as Markets Anticipate a Bank of Japan Rate Hike
The USD/JPY pair fell to 155.08 on Tuesday, close to the monthly low. The Japanese yen gained strength as speculation grew regarding a potential interest rate hike by the Bank of Japan (BoJ), driven by hawkish commentary from BoJ officials, which increased the likelihood of this action.
Key factors driving yen strength
A possible rate hike would raise Japan’s short-term borrowing costs to 0.5%, the highest level since the 2008 global financial crisis. This decision would align with recent optimism about the economy’s ability to achieve sustainable inflation. Markets also expect the BoJ to revise its core inflation forecast upwards, with confidence growing that wage increases will help maintain the 2% inflation target.
Additionally, Japan’s Finance Minister Katsunobu Kato reiterated the government’s readiness to take measures to support the yen, adding further strength to the currency.
In the broader market context, investors are also evaluating the actions of US President Donald Trump on his first day in office, which included signing several executive orders and discussing plans for trade tariffs. These developments contribute to broader uncertainty, indirectly favouring the yen as a safe-haven currency.
Technical analysis of USD/JPY
On the H4 chart, USD/JPY experienced a pullback from the 156.56 level and is extending its downward wave towards 154.20. After reaching this level, a growth wave back to 156.56 is possible. This scenario is supported by the MACD indicator, with its signal line below zero and pointing downwards.
On the H1 chart, the pair is consolidating near 155.40, with expectations of a downward breakout to 154.20. After hitting this target, a corrective wave to 156.56 (a test from below) is possible. Further development of the downward wave could push the pair to 154.00. The Stochastic oscillator confirms this scenario, with its signal line below 50 and trending sharply downwards.
Conclusion
The strength of the Japanese yen reflects the growing expectations of a BoJ rate hike and supportive government policy. While technical analysis points to a further downside potential for USD/JPY in the short term, the pair’s movement will hinge on the BoJ’s upcoming decisions and broader market dynamics. On the downside, key levels to watch are 154.20 and 154.00, with 156.56 acting as a potential corrective target.
CAD/JPY Technical: Trump’s Shock and Awe Trade Policy Manoeuvre Erased CAD Gains
- Yesterday’s ex-post Trump’s inauguration speech US dollar sell-off has started to reverse course.
- In less than 24 hours after adopting a milder trade tariffs plan towards US major trading partners, Trump has changed his stance to mention that 25% trade tariffs may be enacted on Canada and Mexico on 1 February.
- The CAD has erased almost all its earlier gains against the US dollar.
- The CAD/JPY may be on the brink of kickstarting a potential medium-term downtrend phase.
US President Trump has reverted to his usual “element of surprise with shock and awe” policy-making process.
The global markets had a moment of “joy and reprieve” during Monday, 20 January US session when Trump’s inauguration speech adopted a milder tone on trade tariffs targeted on US major trading partners, avoided any mention of the quantum amount on tariffs, and instead mentioned studies will be conducted on China, Canada, and Mexico to assess any form of unfair trade practices.
The US dollar tumbled across the board on the news that Trump would refrain from immediately implementing aggressive tariffs, and the US Dollar Index futures declined by 1.2% at the end of Monday’s US session to record its biggest daily slide since November 2023.
US dollar weakness has started to reverse in today’s Asia session
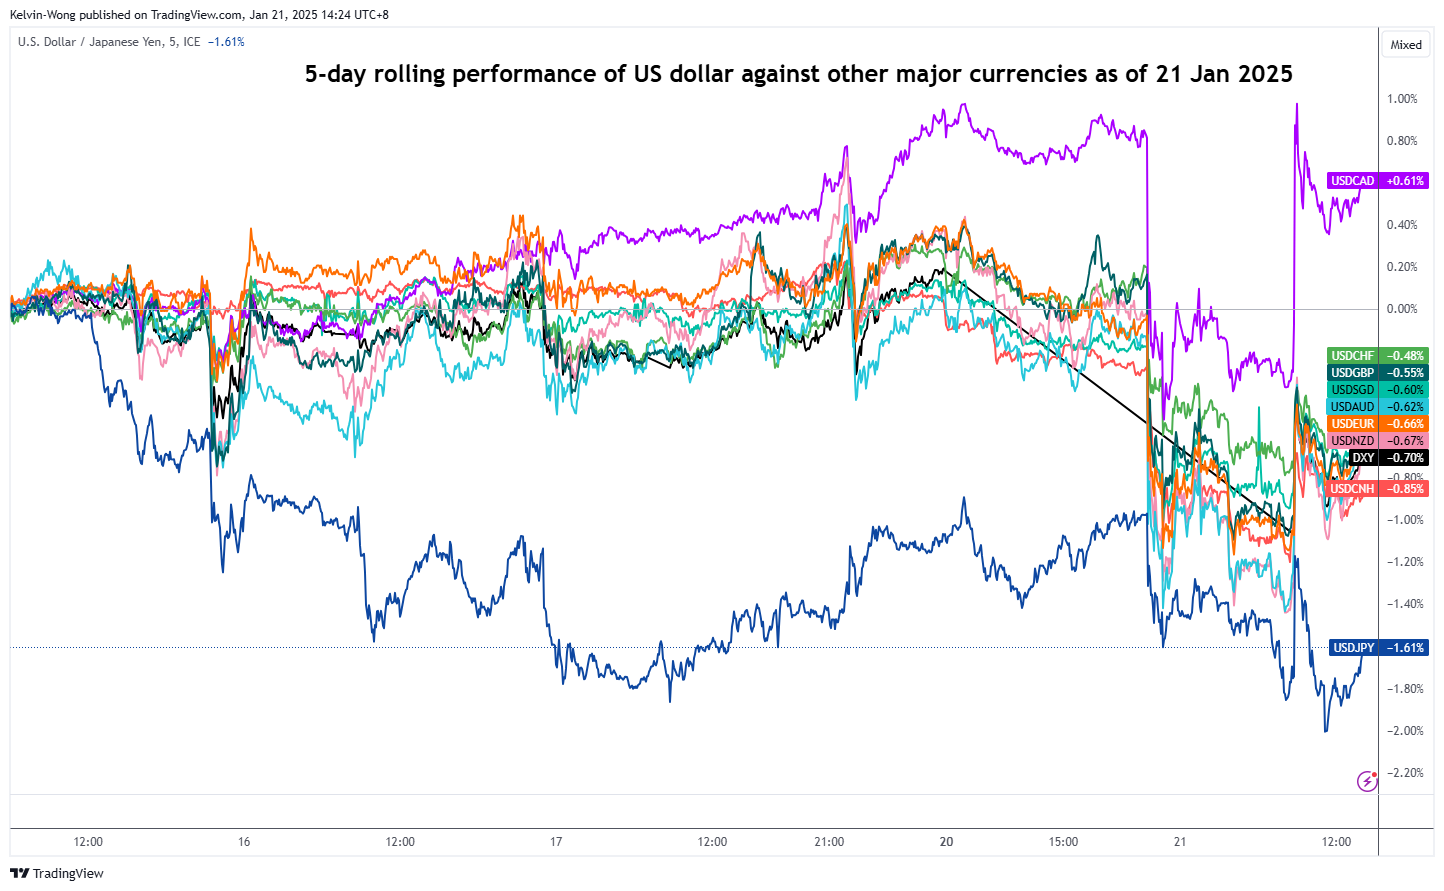
Fig 1: 5-day rolling performance of US dollar major pairs as of 21 Jan 2025 (Source: TradingView, click to enlarge chart)
On Tuesday, 21 January early Asian session, while signing off several executive orders in the Oval Office, President Trump rattled off to media reporters in an off-the-cuff press conference that he still planned to impose 25% trade tariffs on Mexico and Canada on 1 February.
The Lonnie reversed all its gains that materialized on Monday, US session to become the weakest major currency today against the US dollar.
Based on the five-day rolling performance basis, the USD/CAD has gained by 0.6% while the JPY is the weakest against the US dollar as the USD/JPY shed -1.6% at this time of the writing due to a potential Bank of Japan (BoJ) interest rate hike this Friday, 24 January (see Fig 1).
Bearish momentum remains intact for CAD/JPY
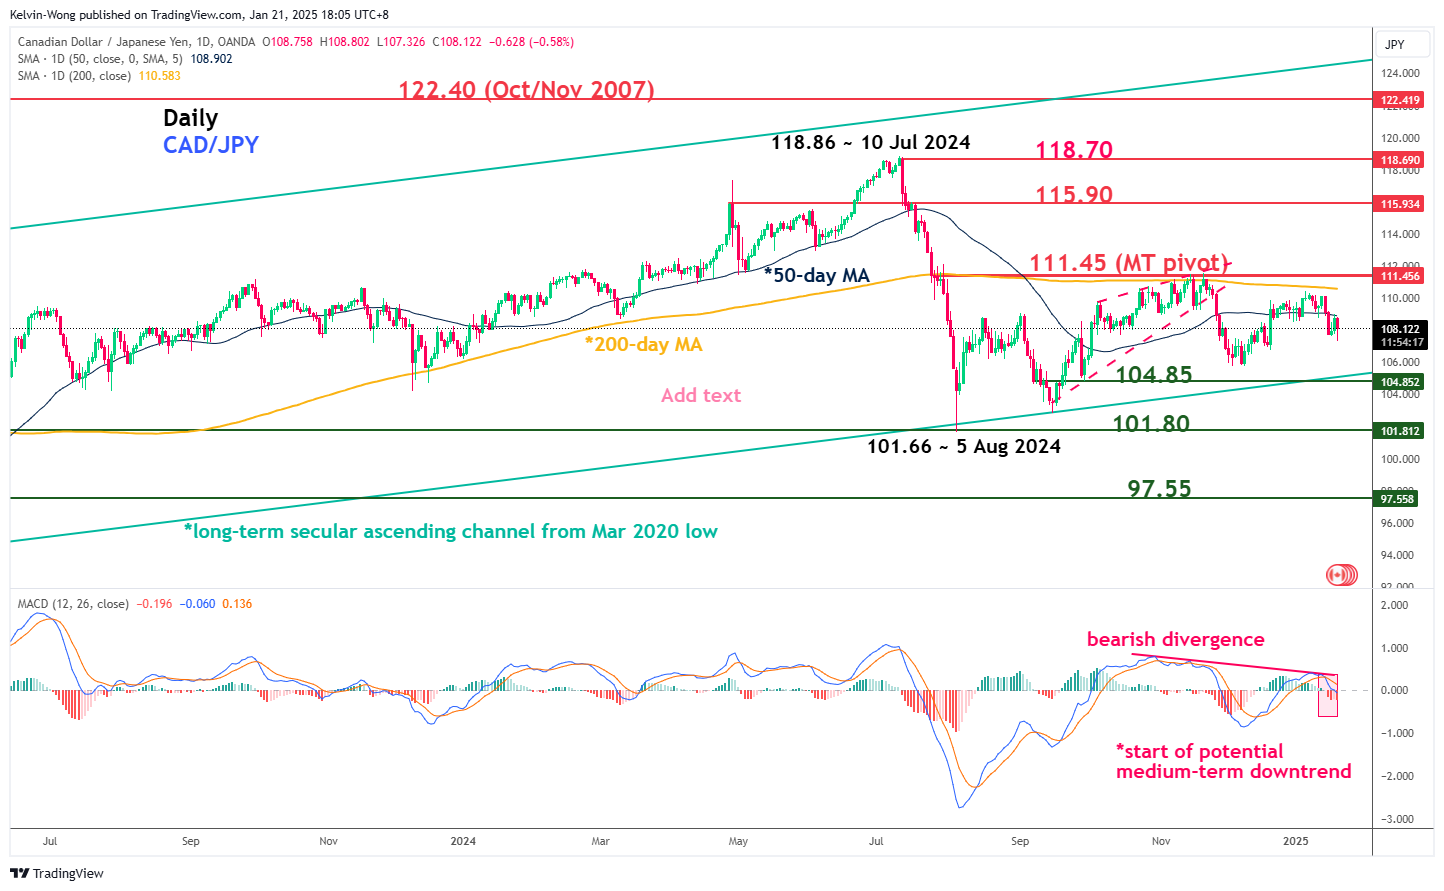
Fig 2: CAD/JPY medium-term trend as of 21 Jan 2025 (Source: TradingView, click to enlarge chart)
Since the start of the new year in 2025, the price actions of the CAD/JPY have failed to surpass its key 200-day moving average, retested, and staged a bearish reaction at the 50-day moving average acting as an intermediate resistance at 108.90 in today’s Asian session.
In addition, the daily MACD trend indicator has continued to inch downwards below its centreline today after a bearish divergence signal that was flashed out earlier on 14 November 2024.
These technical observations suggest the start of a potential medium-term (multi-week) downtrend phase for the CAD/JPY cross pair.
Watch the 111.45 key medium-term pivotal resistance and a breakdown with a daily close below 104.85 key intermediate support (also the lower boundary of the long-term secular ascending channel from the March 2020 low) exposes the medium-term supports of 101.80 and 97.55 next (see Fig 2).
However, a clearance above 111.45 invalidates the bearish scenario for a potential squeeze up toward the next medium-term resistances of 115.90 and 118.70.
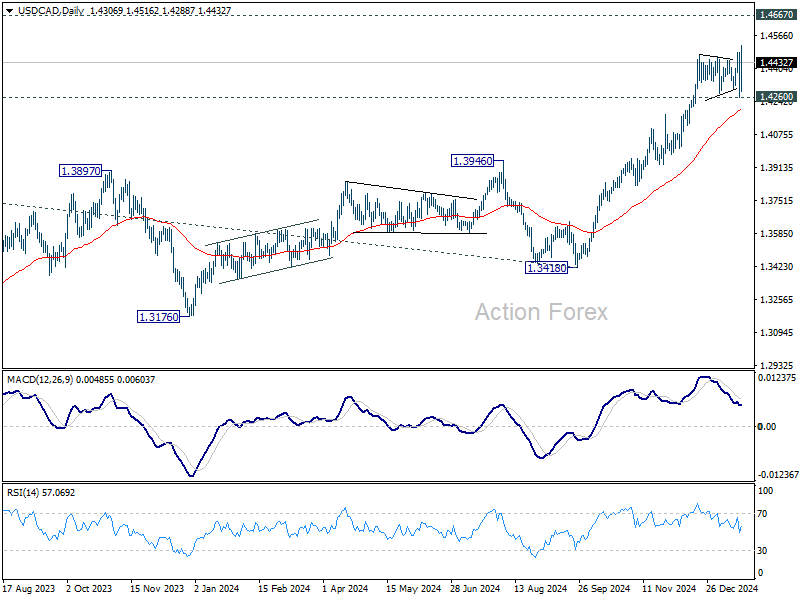
USDCAD: Sideways Movement
USDCAD, H4
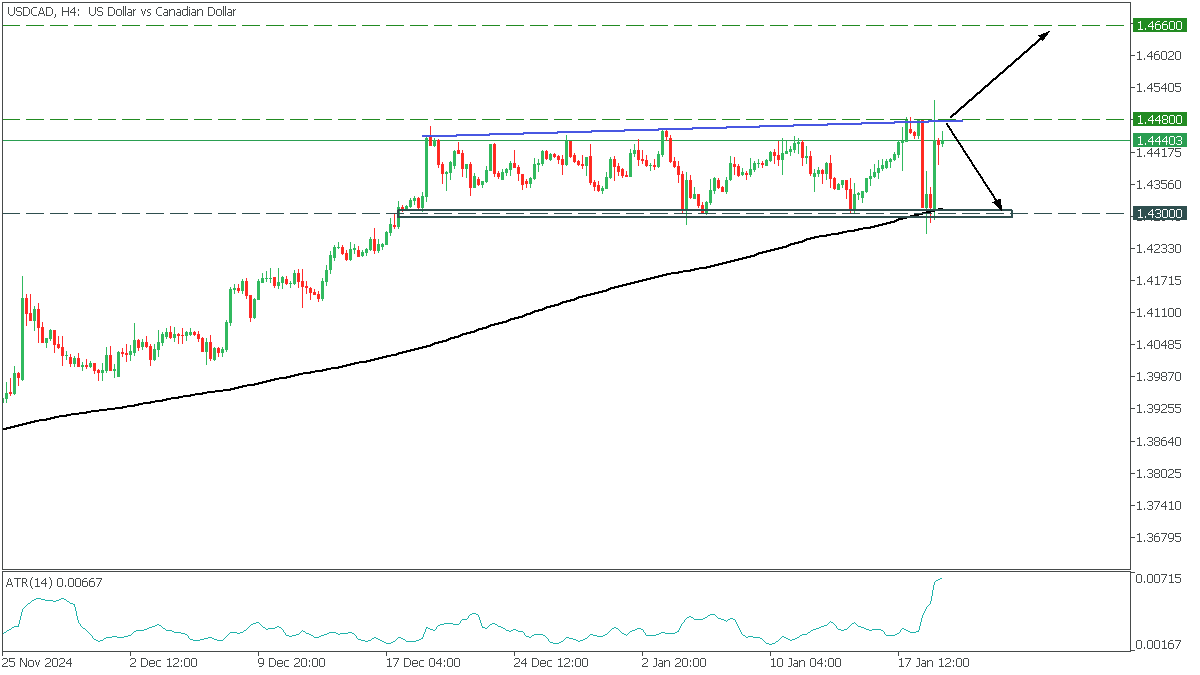
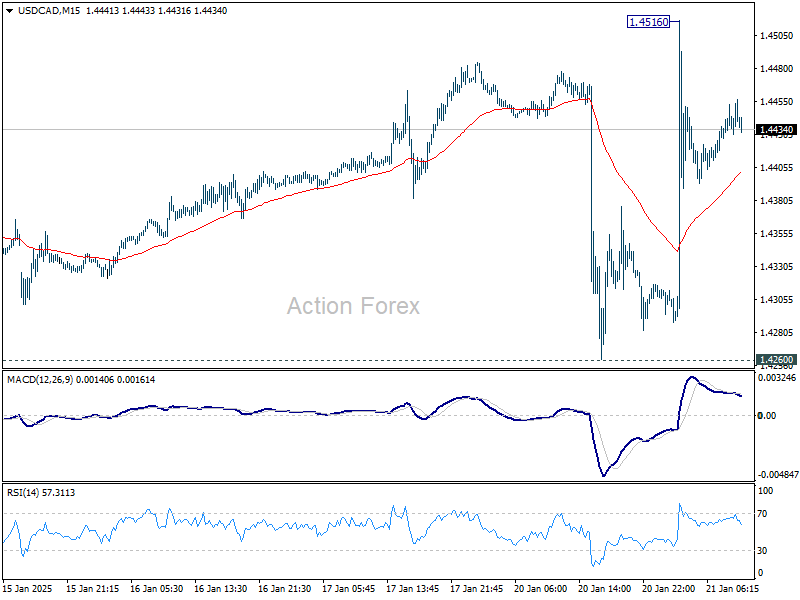
USDCAD chart on H4 shows a flat with a false breakdown of the upper boundary and a return to the expanding wedge and a bounce from MA200. Growing ATR indicates the growth of volatility and increasing probability of strong movement when key levels are broken.
- A break of the upper trendline above 1.4480 would open the way to 1.4660, corresponding to the 2019 high;
- A bounce off the trendline would drop USCAD to 1.4300;
European Currencies Strengthen Following Donald Trump’s Inauguration
The start of this trading week was marked by a sharp pullback in the US dollar. According to reports from The Wall Street Journal, the newly inaugurated US President, Donald Trump, does not intend to impose tariffs immediately after taking office. This news supported the EUR/USD pair in retesting the critical 1.0440 level, helped GBP/USD buyers push the price above 1.2300, and saw USD/JPY temporarily dip below 155.00.
GBP/USD
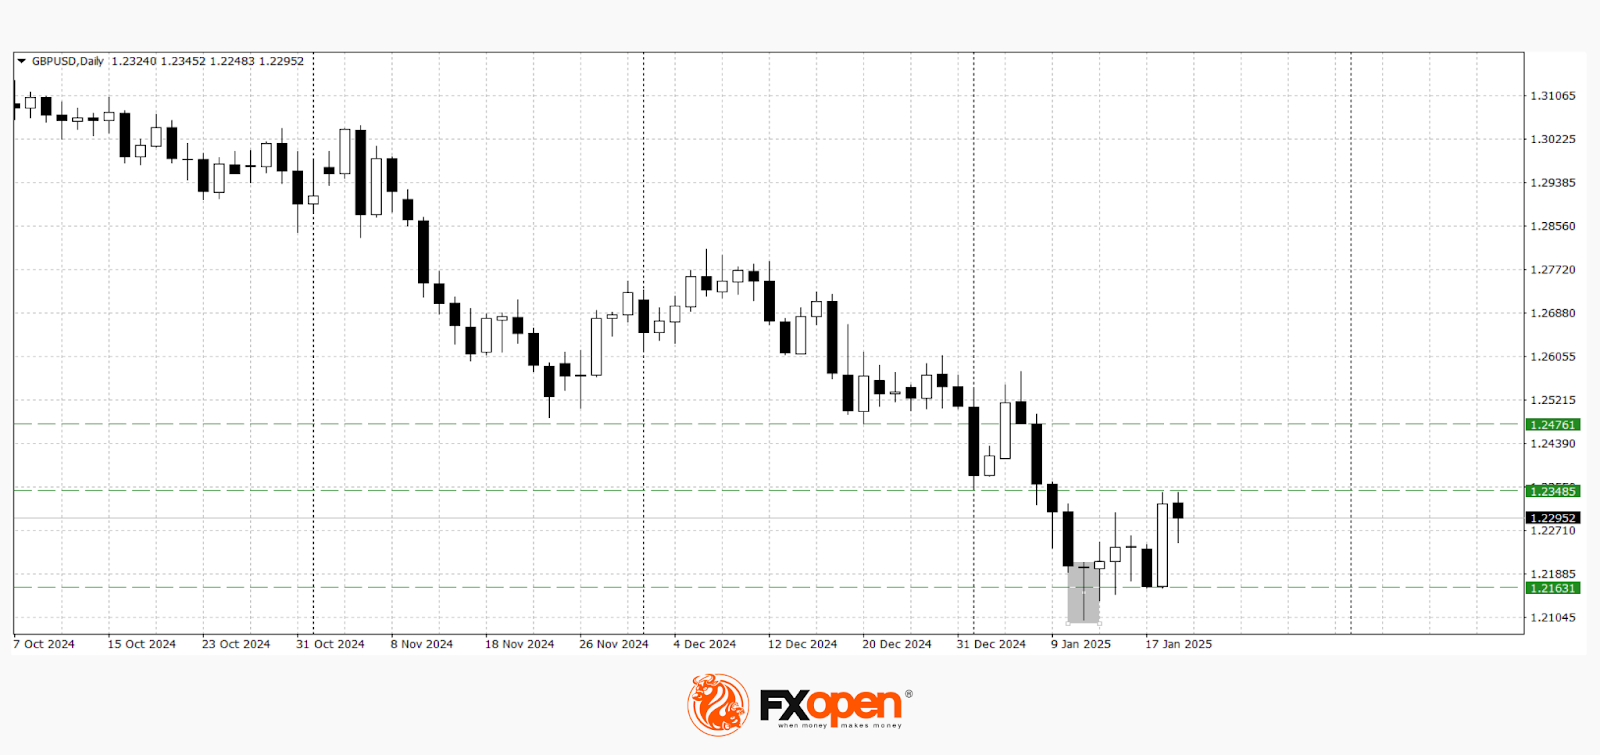
Technical analysis of the GBP/USD pair indicates the potential for a continued upward correction, as the daily timeframe still reflects the relevance of the "hammer" pattern from 13 January. If the price rises above the 1.2340–1.2300 range, further gains towards 1.2480–1.2400 are possible.
A resumption of the downward trend may occur if the price falls below yesterday's low of 1.2160. Upcoming macroeconomic indicators will play a crucial role in determining GBP/USD's direction. Key events to watch:
- Today at 10:00 (GMT+2): UK employment change;
- Today at 10:00 (GMT+2): UK average earnings (excluding bonuses);
- Tomorrow at 10:00 (GMT+2): UK public sector net cash requirement.
EUR/USD
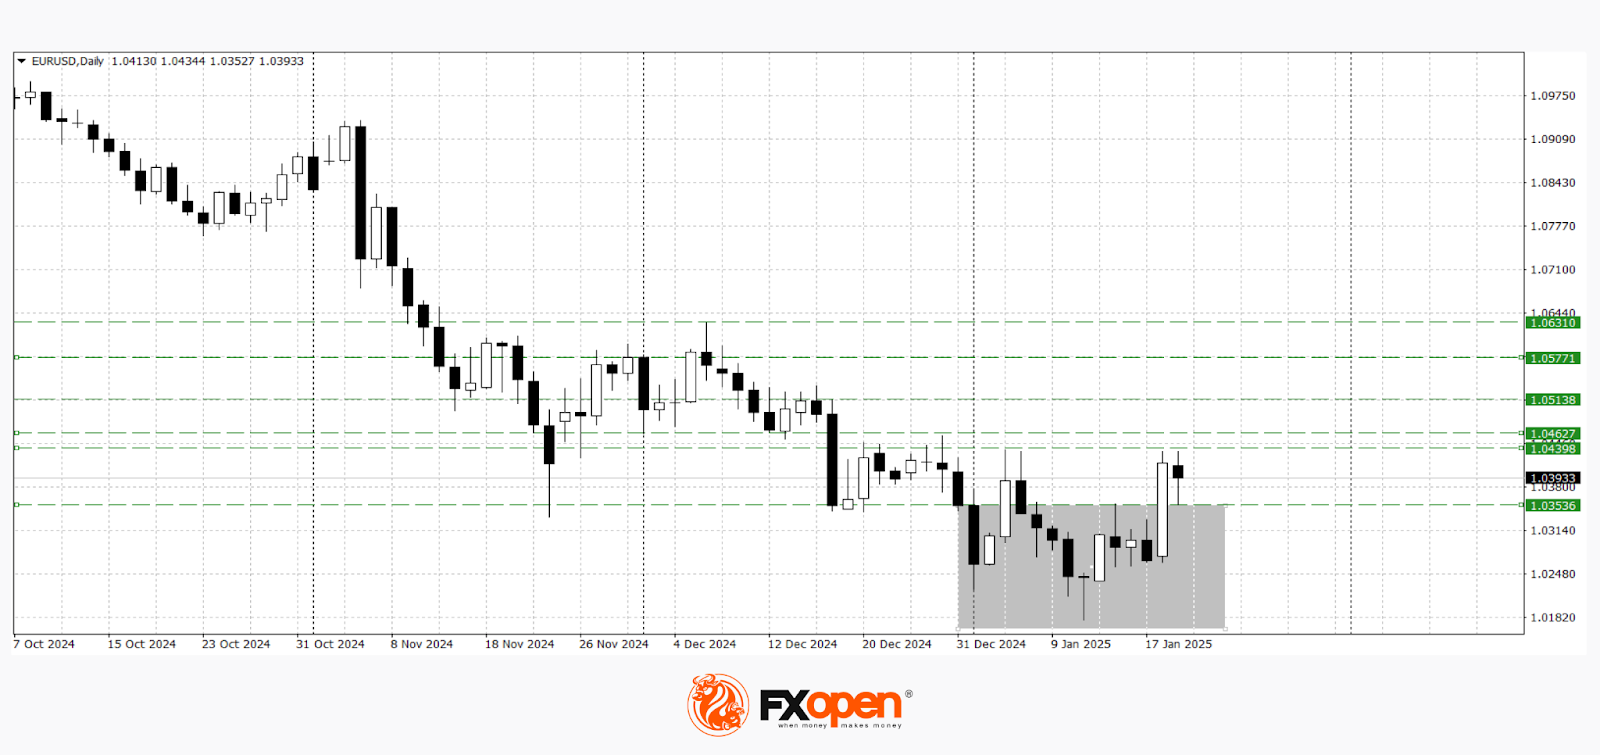
The EUR/USD pair is testing the key 1.0440–1.0400 range for the fourth time this month. If buyers break through this resistance, the corrective rally could extend towards 1.0570–1.0500. Conversely, if the price drops below 1.0350–1.0300, a retest of the recent low at 1.0180 may follow.
On the daily timeframe, the EUR/USD chart shows the formation of a "V-shaped reversal" pattern. If this pattern is confirmed, it may signal the start of a deeper upward correction.
The following events are likely to influence EUR/USD price movements in the coming trading sessions:
- Today at 13:00 (GMT+2): Germany ZEW Economic Sentiment Index;
- Today at 14:00 (GMT+2): Bundesbank monthly report;
- Tomorrow at 18:15 (GMT+2): Speech by ECB President Christine Lagarde.
Trade over 50 forex markets 24 hours a day with FXOpen. Take advantage of low commissions, deep liquidity, and spreads from 0.0 pips. Open your FXOpen account now or learn more about trading forex with FXOpen.
This article represents the opinion of the Companies operating under the FXOpen brand only. It is not to be construed as an offer, solicitation, or recommendation with respect to products and services provided by the Companies operating under the FXOpen brand, nor is it to be considered financial advice.
Nasdaq 100: Bearish Signals Amid Increased Volatility
As revealed by the technical analysis of the 4-hour Nasdaq 100 chart (US Tech 100 mini on FXOpen), the ATR indicator has been above 125 since the start of 2025, in contrast to late 2024 when it was mostly below this level. This reflects heightened volatility in the US stock market due to:
→ Trump’s inauguration: The president has already signed an executive order withdrawing the US from the World Health Organization. Market participants anticipate further decisions in the near future that could significantly impact the nation’s economy.
→ Earnings season: Companies are releasing reports, prompting analysts to revise forecasts. For instance, a Jefferies analyst downgraded Apple’s (AAPL) stock rating and lowered the price target from $211 to $200, citing potentially weak revenue figures. Apple’s quarterly report is due on 30 January.
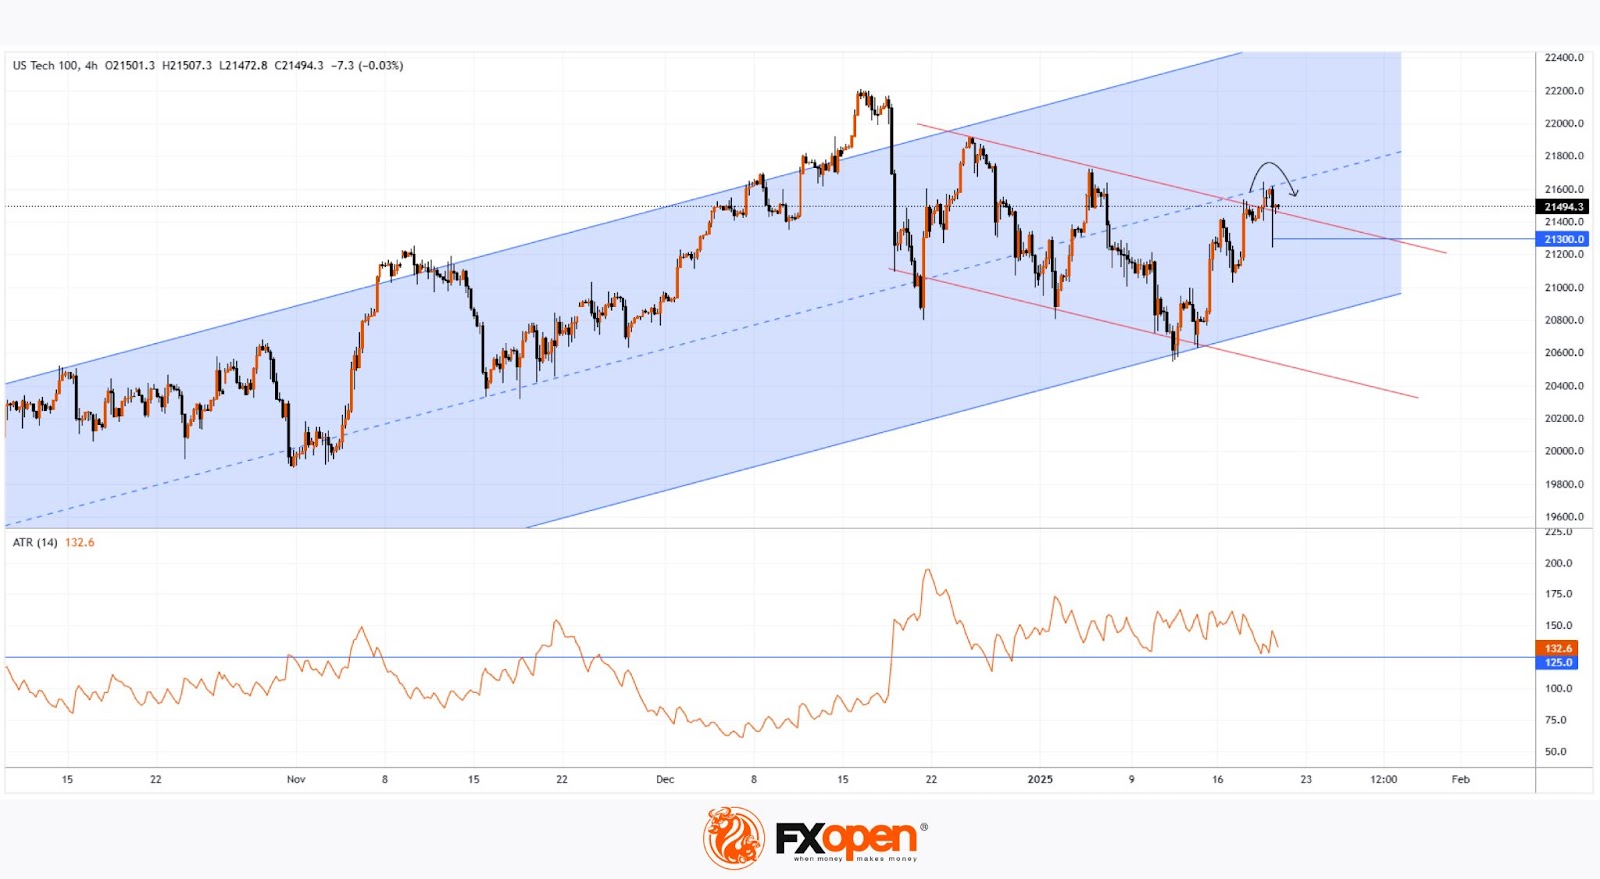
On the Nasdaq 100 chart (US Tech 100 mini on FXOpen), a bearish move (indicated by the arrow) is notable for:
→ Indicating that the median line of the ascending channel has turned into resistance;
→ Suggesting that the apparent bullish breakout above the upper red line now seems to be a false breakout.
The long lower wick on the far-right bearish candle points to strong demand around the 21,300 level. However, will buyers remain active if Trump’s actions and corporate earnings reports increase risks for them?
Trade global index CFDs with zero commission and tight spreads. Open your FXOpen account now or learn more about trading index CFDs with FXOpen.
This article represents the opinion of the Companies operating under the FXOpen brand only. It is not to be construed as an offer, solicitation, or recommendation with respect to products and services provided by the Companies operating under the FXOpen brand, nor is it to be considered financial advice.
German ZEW falls to 10.3 as Eurozone shows relative resilience
German ZEW Economic Sentiment fell sharply in January, dropping from 15.7 to 10.3 and missing market expectations of 15.1. In contrast, Current Situation Index showed slight improvement, rising from -93.1 to -90.4, slightly better than forecasts of -93.0.
Meanwhile, Eurozone ZEW Economic Sentiment painted a more optimistic picture, climbing from 17.0 to 18.0, exceeding expectations of 16.9. Current Situation Index for the Eurozone also rose, gaining 1.2 points to -53.8.
ZEW President Achim Wambach attributed the decline in Germany’s sentiment to persistent economic headwinds. He noted, “The second consecutive year of recession caused economic expectations in Germany to fall.”
Key factors include weak private household spending and low demand in the construction sector. Wambach warned that if these trends persist, “Germany will fall further behind the other countries of the Eurozone.”
Adding to the challenges, Wambach highlighted growing political uncertainty in Germany due to the complexities of coalition-building and the unpredictability of economic policies under the new Trump administration in the US.
USD/JPY Daily Outlook
Daily Pivots: (S1) 155.17; (P) 155.88; (R1) 156.33; More...
Intraday bias in USD/JPY is back on the downside with breach of 154.97 temporary low. Sustained break of 55 D EMA (now at 154.61) will extend the fall from 158.86 to 38.2% retracement of 139.57 to 158.86 at 151.49 next. Nevertheless, firm break of 156.67 resistance will argue that the pull back has completed, and turn bias back to the upside for retesting 158.86 high instead.
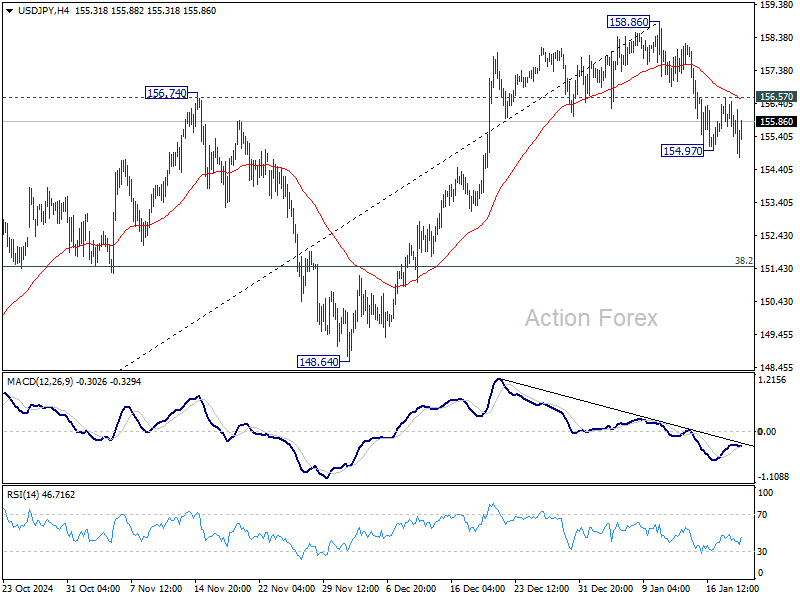
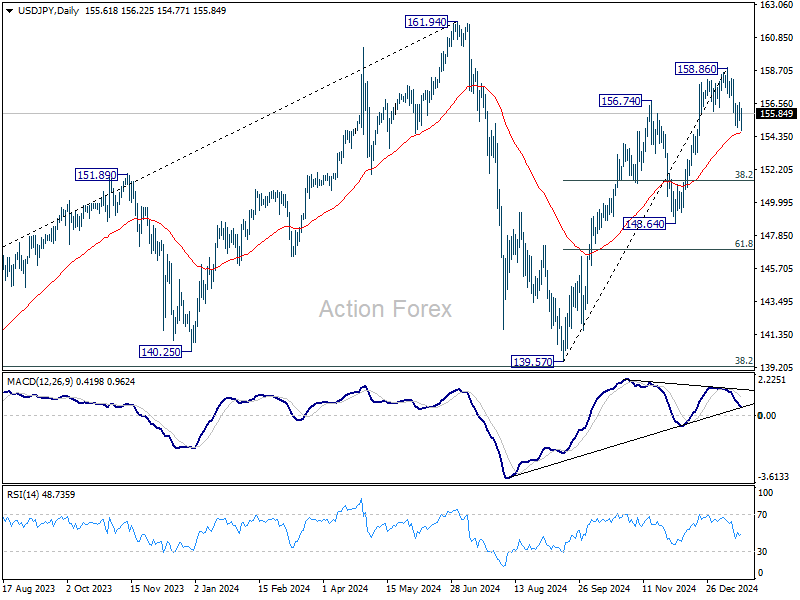
In the bigger picture, price actions from 161.94 are seen as a corrective pattern to rise from 102.58 (2021 low). The range of medium term consolidation should be set between 38.2% retracement of 102.58 to 161.94 at 139.26 and 161.94. Nevertheless, sustained break of 139.26 would open up deeper medium term decline to 61.8% retracement at 125.25.
Loonie on a Rollercoaster on Tariff Threats, Canadian CPI Watched
Canadian Dollar endured a rough ride, heavily influenced by US President Donald Trump’s tariff rhetoric. The Loonie initially gained some ground yesterday, as Dollar weakened broadly after Trump refrained from imposing immediate tariffs during his first day in office. However, optimism was short-lived as Trump warned of 25% tariffs on both Mexico and Canada starting February 1, citing border security concerns and labeling Canada a “very bad abuser.”
Trump’s remarks, made during a press briefing accompanying his wave of executive orders, have brought uncertainty back to the already fragile sentiment. In the background, BoC’s latest business outlook survey highlighted apprehension among Canadian businesses. Conducted during November 2024, the survey revealed that 40% of respondents expected negative effects from the new US administration, while one-third were uncertain about the fallout.
On the horizon, Canada’s December CPI report due today could trigger more volatility in Loonie. Both headline and core inflation are expected to ease further, reinforcing the case for another 25-bps rate cut at BoC’s January 29 meeting. Despite signaling a slower pace of monetary easing this year, BoC appears not ready for a pause yet. At least one more cut is generally expected, especially with inflation hovering near the 2% target.
Technically for USD/CAD, near term bullishness was revived after yesterday's huge volatility. For now, further rise is expected as long as 1.4260 support holds. Current rally should continue towards 1.4667 key long term resistance. Nevertheless, a firm break there might not happen until the tariff picture is cleared. For any dip, through 1.4260, the next level of defense would be 55 D EMA (now at 1.4203).
UK payrolled employment falls -47k in Dec, unemployment rate rises to 4.4% in Nov
UK payrolled employment fell -47k or -0.2% mom in December. Median monthly pay rose 5.6% yoy, down from 6.4% yoy in November and 7.9% yoy in October. Claimant count rose 0.7k, below expectation of 10.3k.
In the three months to November, unemployment rate ticked up to 4.4%, above expectation of 4.3%. Average earnings excluding bonus rose 5.6% yoy, up from 5.2% yoy, and above expectation of 5.5% yoy. Average earnings including bonus rose 5.6% yoy, up from 5.2% yoy, matched expectations.
NZ BNZ services fall to 47.9, contracts for 10th month
New Zealand’s BNZ Performance of Services Index declined from 49.1 to 47.9 in December, well below historical average of 53.1. This also marks the 10th consecutive month of contraction.
The breakdown of the data highlights broad weakness: activity/sales fell from 48.3 to 46.2, and supplier deliveries dropped sharply from 52.5 to 47.7. New orders/business remained stagnant at 49.5, just below the threshold for expansion, while employment showed a marginal improvement, rising from 46.7 to 47.4. Stocks/inventories also slipped into contraction territory, falling from 52.0 to 48.8.
Negative sentiment among respondents increased to 57.5% in December, up from 53.6% in November, with cost-of-living pressures and concerns about the general economic climate dominating feedback.
BNZ’s Senior Economist Doug Steel remarked, “Comparing across our key trading partners, New Zealand has the only PSI in contraction. Our neighbour Australia is the closest comparison, but their equivalent PSI is sitting more comfortably at 50.8.”
USD/JPY Daily Outlook
Daily Pivots: (S1) 155.17; (P) 155.88; (R1) 156.33; More...
Intraday bias in USD/JPY is back on the downside with breach of 154.97 temporary low. Sustained break of 55 D EMA (now at 154.61) will extend the fall from 158.86 to 38.2% retracement of 139.57 to 158.86 at 151.49 next. Nevertheless, firm break of 156.67 resistance will argue that the pull back has completed, and turn bias back to the upside for retesting 158.86 high instead.
In the bigger picture, price actions from 161.94 are seen as a corrective pattern to rise from 102.58 (2021 low). The range of medium term consolidation should be set between 38.2% retracement of 102.58 to 161.94 at 139.26 and 161.94. Nevertheless, sustained break of 139.26 would open up deeper medium term decline to 61.8% retracement at 125.25.