
Sample Category Title
USD/JPY Pulls Back: Is This The Start of Larger Correction?
Key Highlights
- USD/JPY started a downside correction from the 158.85 zone.
- It traded below a key rising channel with support at 157.10 on the 4-hour chart.
- EUR/USD is struggling to recover above the 1.0350 resistance.
- GBP/USD is still trading in the red zone below 1.2350.
USD/JPY Technical Analysis
The US Dollar struggled to rise toward 160.00 against the Japanese Yen. USD/JPY traded as high as 158.87 on TitanFX and recently corrected some gains.
Looking at the 4-hour chart, the pair declined below the 158.00 and 157.50 support levels. It traded below a key rising channel with support at 157.10. There was a move below the 38.2% Fib retracement level of the upward move from the 151.79 swing low to the 158.87 high.
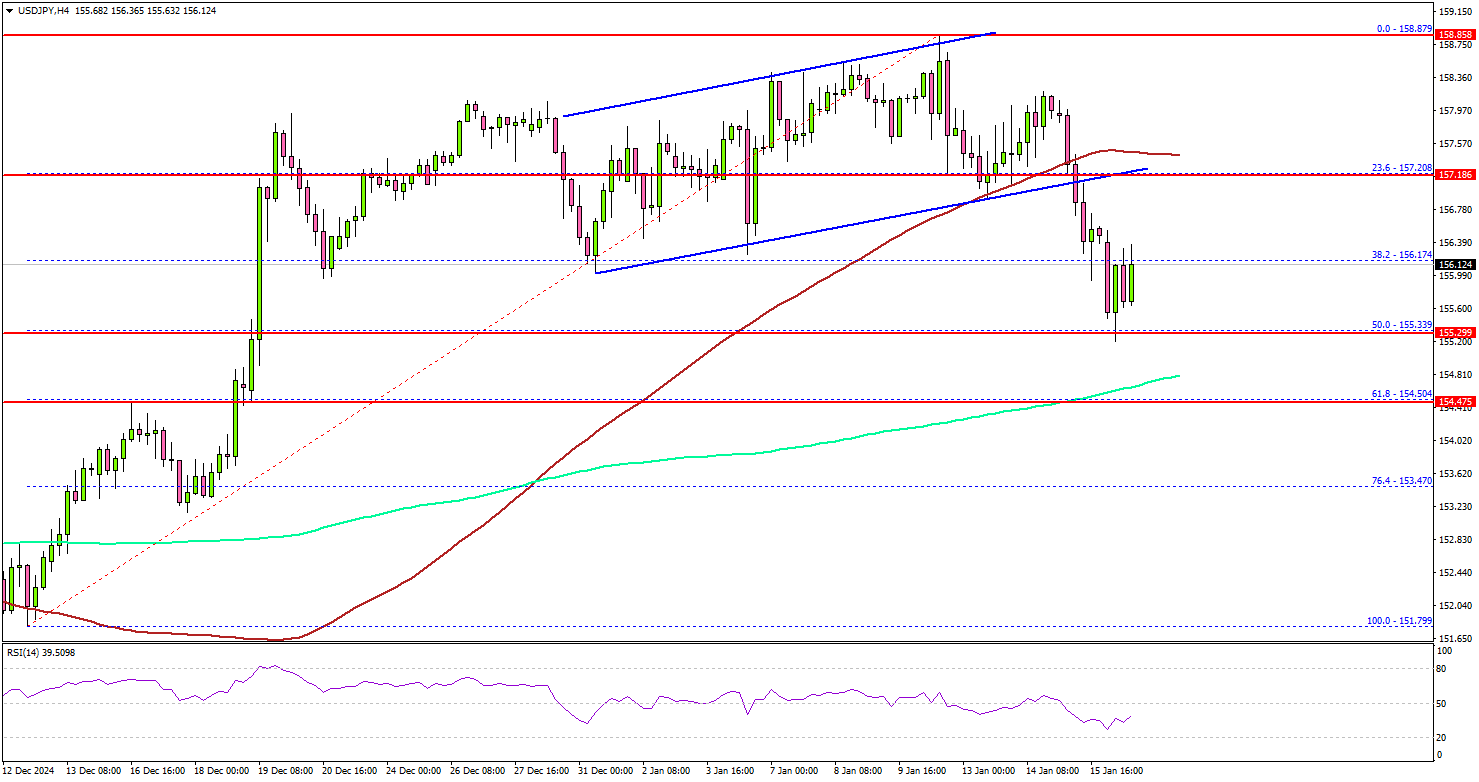
The pair settled below the 100 simple moving average (red, 4-hour), but remained above the 200 simple moving average (green, 4-hour). On the downside, immediate support sits near the 155.35 level.
The 50% Fib retracement level of the upward move from the 151.79 swing low to the 158.87 high is also near 155.35. The next key support sits near the 154.50 level and the 200 simple moving average (green, 4-hour).
Any more losses could send the pair toward the 153.50 level. On the upside, the pair is facing hurdles near the 156.80 level. The first major resistance is near the 157.20 level.
The next major resistance is near the 157.50 level. A close above the 157.50 level could set the tone for another increase. In the stated case, the pair could rise toward the 158.80 resistance. The main hurdle could be 160.00.
Looking at EUR/USD, the pair started a short-term recovery wave, but the bears are active near the 1.0350 resistance zone.
Upcoming Economic Events:
- US Housing Starts for Dec 2024 (MoM) – Forecast 1.320M, versus 1.289M previous.
- US Building Permits for Dec 2024 (MoM) – Forecast 1.460M, versus 1.493M previous.
Elliott Wave View Looking for NZDUSD to Extend Lower
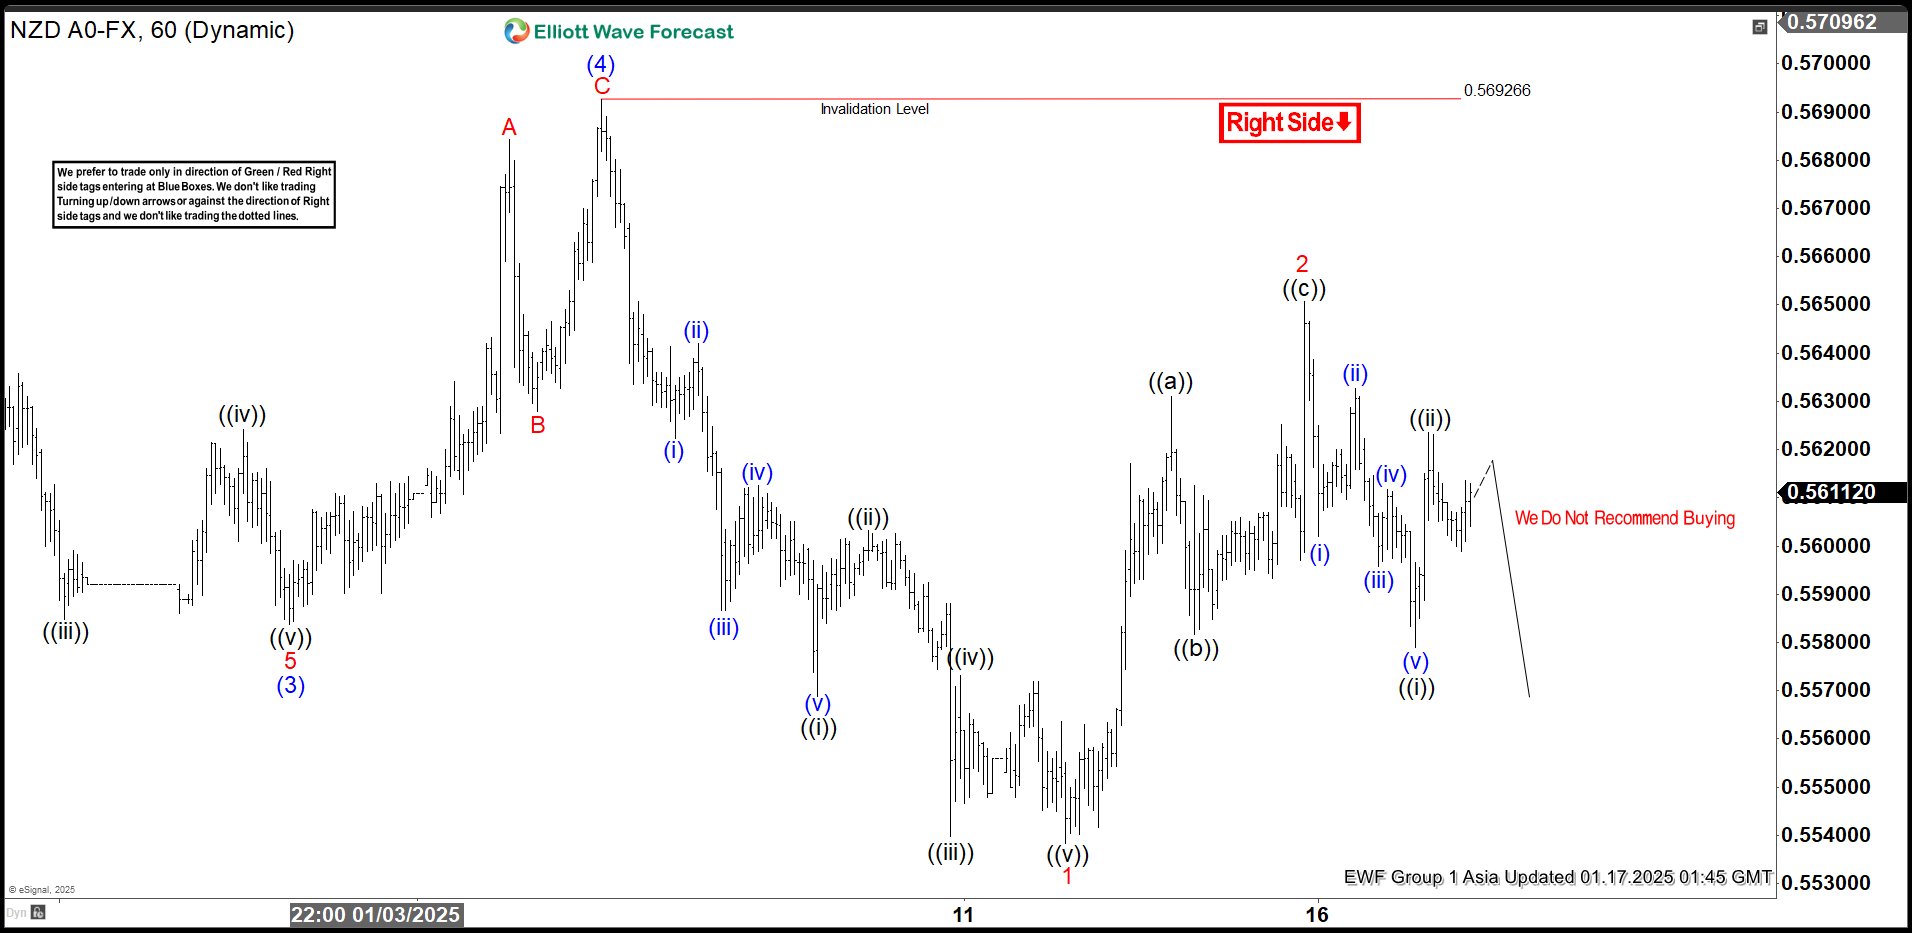
Short Term Elliott Wave view in NZDUSD suggests that cycle from 9.30.2024 high is in progress as an impulse. Down from 9.30.2024 high, wave (1) ended at 0.5813 and wave (2) ended at 0.5929. Pair has resumed lower in wave (3) which ended at 0.5583 as the 1 hour chart below shows. Rally in wave (4) unfolded as a zigzag. Up from wave (3), wave A ended at 0.5684 and wave B ended at 0.5628. Wave C higher ended at 0.5692 which completed wave (4) in higher degree.
Pair has resumed lower in wave (5). Down from wave (4), wave ((i)) ended at 0.5568 and wave ((ii)) rally ended at 0.5603. Wave ((iii)) lower ended at 0.5539 and rally in wave ((iv)) ended at 0.5573. Final leg wave ((v)) ended at 0.5538 which completed wave 1. From there, pair bounce in wave 2 with internal subdivision as a zigzag. Up from wave 1, wave ((a)) ended at 0.563 and wave ((b)) ended at 0.558. Wave ((c)) higher ended at 0.565 which completed wave 2 in higher degree. Near term, as far as pivot at 0.569 high remains intact, expect rally to fail in 3, 7, 11 swing for more downside.
NZDUSD 60 Minutes Elliott Wave Chart
NZDUSD Elliott Wave Video
https://www.youtube.com/watch?v=qdF60IkBcTI
Is GBPAUD Ready for a Rebound?
The Pound Sterling weakened on Thursday after reports showed the UK economy grew less than expected in November, while factory activity continued to decline. The UK’s GDP grew by 0.1% after shrinking in October, falling short of the 0.2% growth economists had predicted. Additionally, manufacturing and industrial production dropped in November, signaling ongoing challenges for UK factories as demand remains weak.
Traders increasingly bet that the Bank of England (BoE) may cut interest rates at its February meeting, especially after recent inflation data showed slowing price growth. Lower inflation has also eased pressure on UK government bond yields, which had been rising due to economic concerns, but the Pound remains under selling pressure amid economic uncertainty.
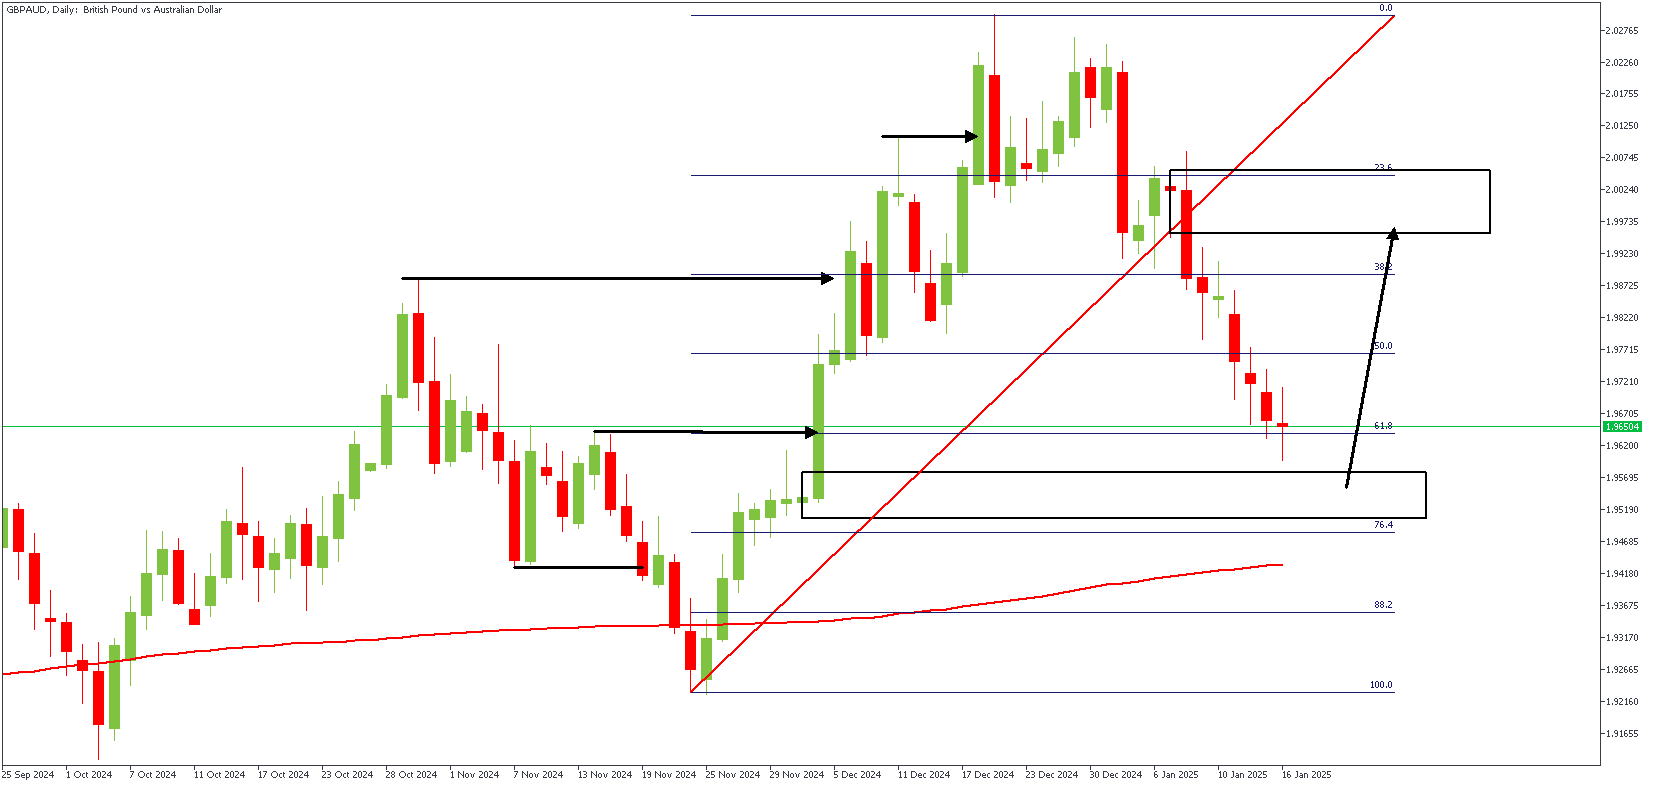
GBPAUD – D1 Timeframe
The probability of price reacting from an Order Block increases significantly when such an OB occurs immediately after an FVG (Fair Value Gap). Regarding the price action on the daily timeframe chart of GBPAUD, we can see the highlighted demand zone, acknowledging that it occurs right after an FVG area. In addition, the highlighted OB enjoys further confluence from the Fibonacci retracement level and the 200-day moving average.
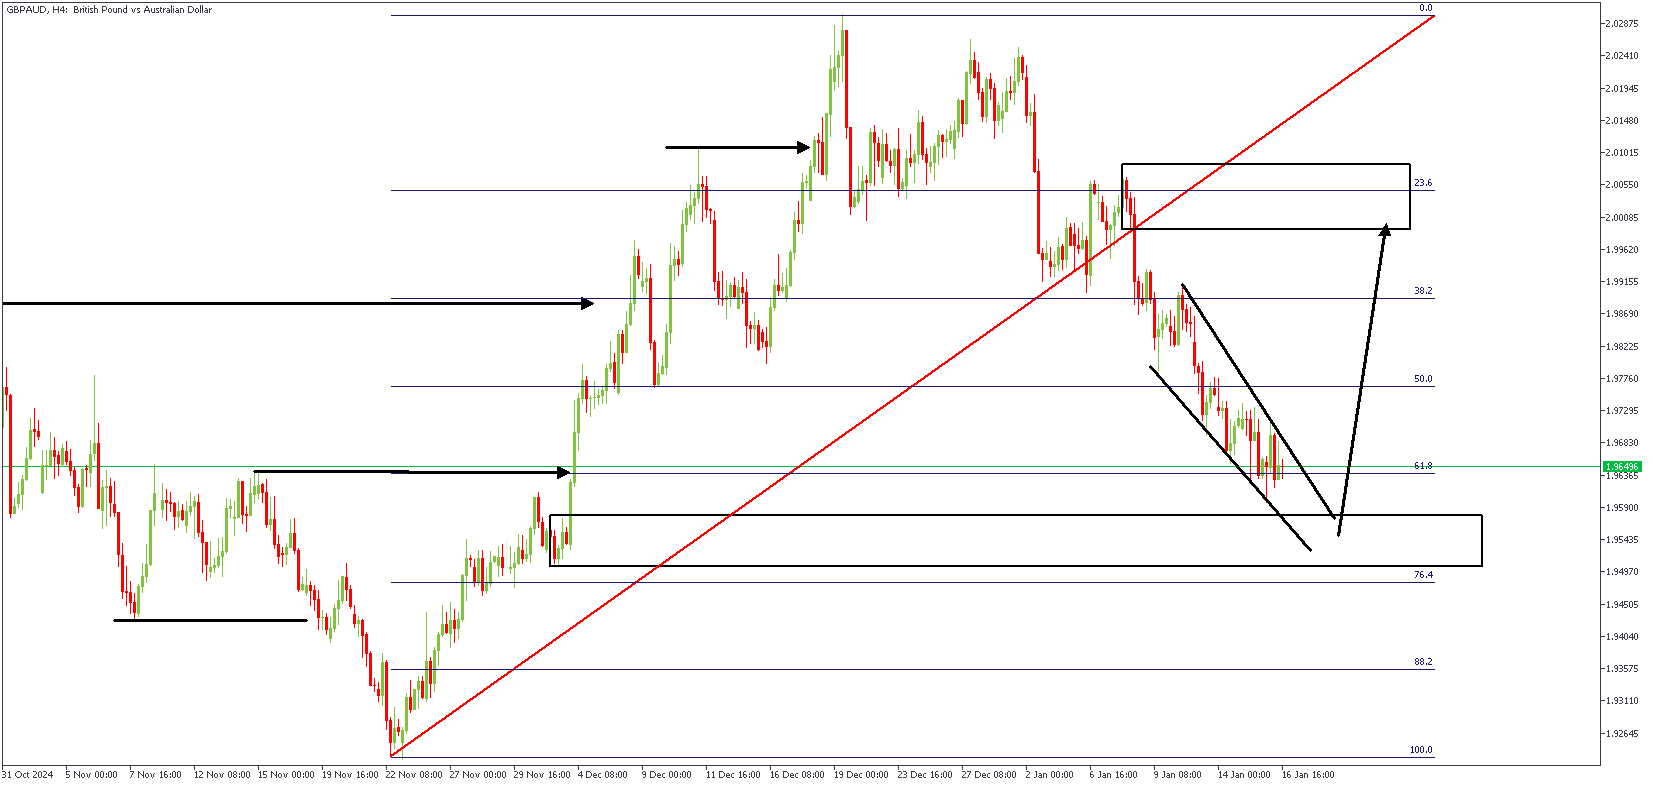
GBPAUD – H4 Timeframe
The 4-hour timeframe chart shows that GBPAUD prices are currently contracting within the boundaries of a descending wedge whilst approaching a key area of demand. Considering this aligns with all the aforementioned confluences, it is easy to conclude with a bullish bounce from the highlighted region.
Analyst’s Expectations:
- Direction: Bullish
- Target: 1.99879
- Invalidation: 1.94573
AUDJPY Preps for a Bullish Rally
The Japanese Yen (JPY) strengthened against the US dollar (USD), according to reports that the Bank of Japan (BoJ) is likely to raise interest rates next week as long as there are no significant disruptions with Trump's presidency. Markets are pricing in a 0.2% rate hike for the January 24th meeting, which has boosted confidence in the Yen. Meanwhile, steady US bond yields have also supported Yen's performance.
The British Pound (GBP) weakened after disappointing UK growth data, lowering UK bond yields. In the US, upcoming data releases, including retail sales and housing market updates, are expected to show a solid economy as consumers try to make purchases before potential tariffs are introduced. Later, China will release important economic figures like GDP and retail sales, which could influence global markets.
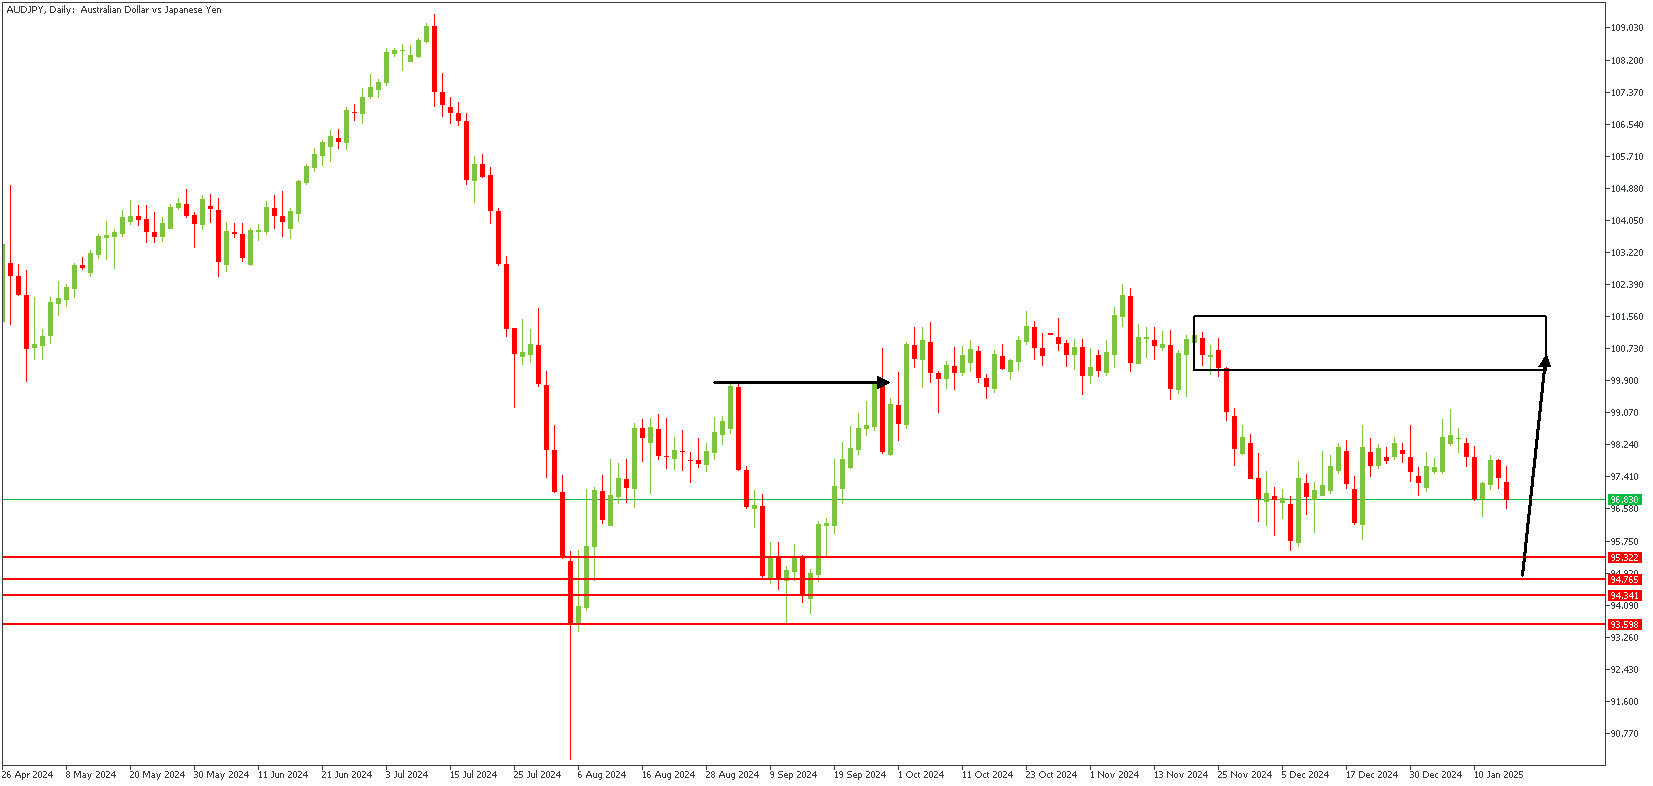
AUDJPY – D1 Timeframe
At the recent high on the daily timeframe chart of AUDJPY, we see an FVG (Fair Value Gap) with a supply zone behind it. This often attracts price movement, as the FVG usually seeks to be mitigated. On this ground, we can scan the lower timeframe for factors that cause bullish momentum.
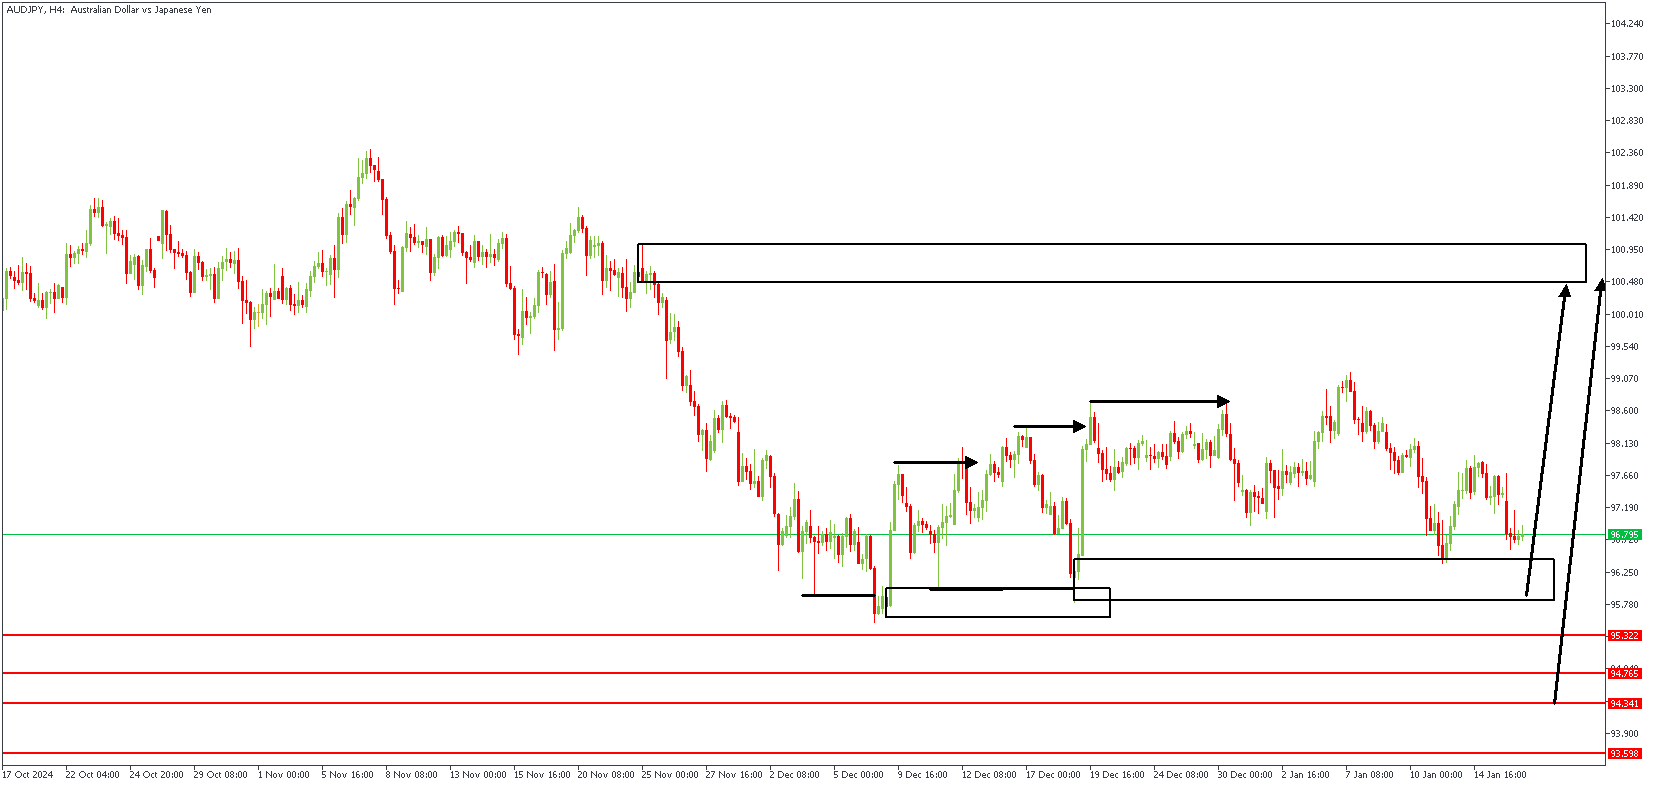
AUDJPY – H4 Timeframe
Breaking down the price action on the 4-hour timeframe chart of AUDJPY, we see an SBR pattern emerging from the bearish sweep below the previous low, followed immediately by a bullish break of structure. The rectangular shape highlights the initial entry zone, whilst a secondary entry may present itself at the pivot region marked by the red horizontal lines.
Analyst's Expectations:
- Direction: Bullish
- Target: 100.353
- Invalidation: 93.405
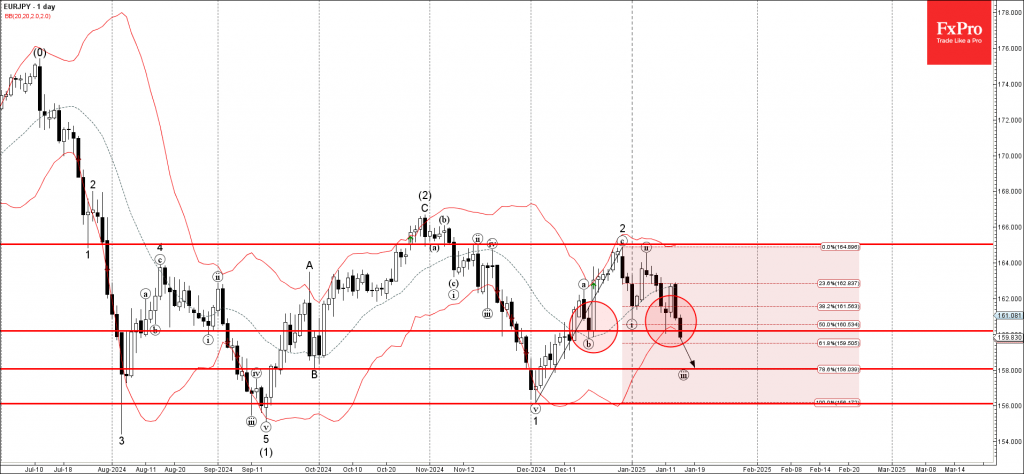
EURJPY Wave Analysis
- EURJPY broke support zone
- Likely to fall to support level 158.00
EURJPY currency pair recently broke the support zone located between the key support level 160.200, (which has been reversing the pair from December) and the 50% Fibonacci correction of the upward ABC correction 2 from last month.
The breakout of this support zone accelerated the active short-term impulse wave iii of the higher impulse waves 3 and (3).
Given the strong bullish yen sentiment, EURJPY currency pair can be expected to fall to the next support level 158.00, the target price for the completion of the active impulse wave iii.
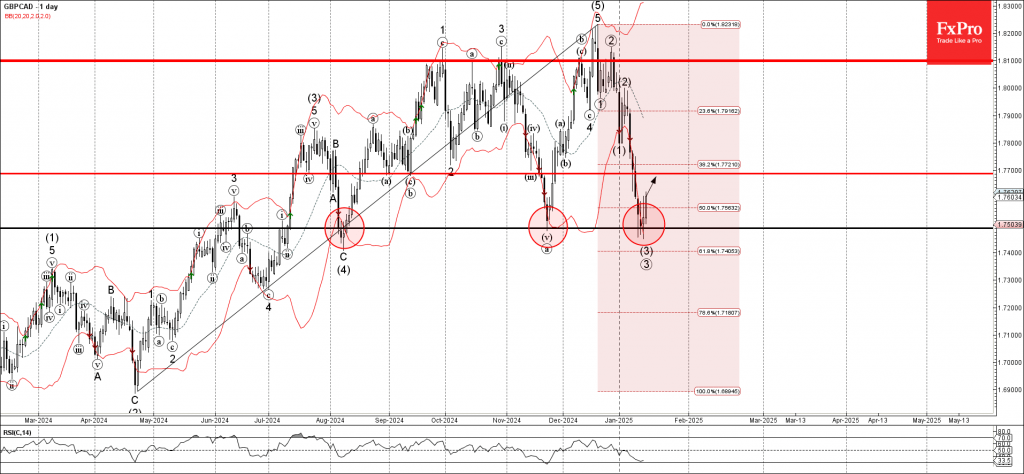
GBPCAD Wave Analysis
- GBPCAD reversed from strong support level 1.7490
- Likely to rise to resistance level 1.7700
GBPCAD currency pair recently reversed up with the daily Japanese candlesticks reversal pattern Hammer from the strong support level 1.7490, which has been steadily reversing this currency pair from the start of August.
The support level 1.7490 was strengthened by the lower daily Bollinger Band and by the 61.8% Fibonacci correction of the upward impulse from last April.
Given the strong daily uptrend, GBPCAD currency pair can be expected to rise to the next resistance level 1.7700.
Fed’s Waller suggests rate cuts possible in H1 if inflation trend holds
Fed Governor Christopher Waller expressed optimism about the US inflation outlook during an interview with CNBC, signaling that rate cuts may be on the table sooner than previously anticipated.
Waller highlighted the positive inflation data released yesterday, describing it as “very good.” He suggested that, if this trend continues, “it’s reasonable to think rate cuts could happen in the first half of the year.”
Waller noted that Fed's median estimate of the neutral policy rate indicates the potential for three or four rate cuts in 2025, contingent on the evolution of economic data.
However, he tempered this with caution, stating, “If the data doesn’t cooperate, then you’re going to be back to two, maybe even one if we just get a lot of sticky inflation.”
On the labor market, Waller described conditions as stable rather than overheated. He pointed out that indicators like hiring rates, quit rates, and wage growth remain restrained, which aligns with Fed's restrictive policy stance.
GBP Struggles Amid Weak Data and BoE Bets
Fundamental Analysis
The British Pound faces bearish pressure against the Dollar and Euro, driven by weak UK economic data and expectations of looser monetary policy from the Bank of England (BoE). UK GDP rose only 0.1% in November, below the 0.2% forecast, while industrial and manufacturing production contracted.
This economic weakness has fueled bets on a 25-basis-point rate cut in February, with up to four cuts expected in 2024, according to a Reuters poll. Meanwhile, UK gilt yields have eased from recent highs, further reducing the Pound's appeal.
Upcoming U.S. employment and retail sales data will play a key role in shaping the Dollar's trajectory, while BoE expectations remain the primary driver for Sterling.
Technical Analysis
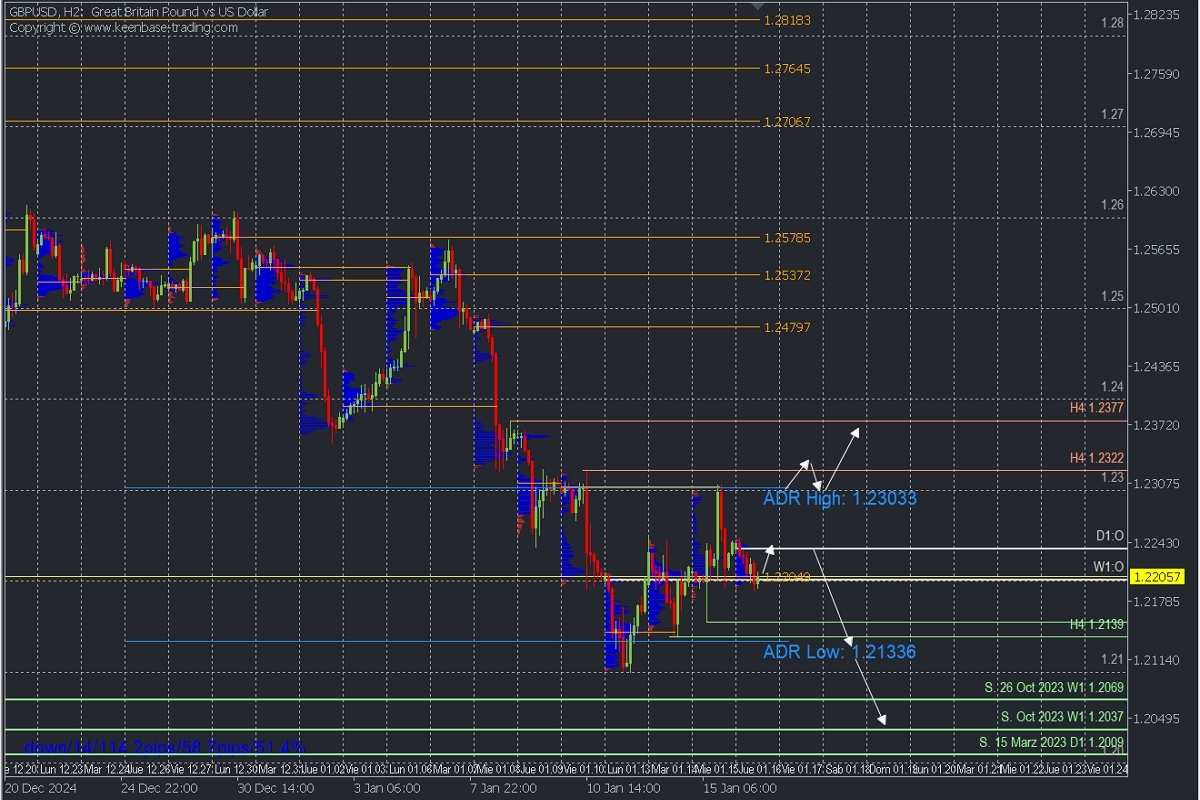
GBPUSD, H2
Supply Zone (Sell): 1.23
Demand Zone (Buy): 1.2140
The intraday bullish correction is consolidating, with volume clustering around 1.22, aligning with yesterday’s POC (Point of Control). This demand zone could support buying toward the daily open at 1.2235, or even attempt a broader rally toward 1.23.
The last validated intraday resistance of the bearish trend is at 1.2322. As long as this level holds, the trend remains intact. A moderate rally below the daily open may pave the way for another drop toward the key correction support at 1.2155, yesterday’s low. A break of this level would signal further downside toward 1.2133, 1.21, and October/March 2023 supports in the coming days.
Technical Summary:
Bearish Scenario: Sell below 1.2235 or earlier at 1.2190, targeting 1.2155, 1.2133, 1.21, and 1.2070 in the short term.
Bullish Scenario: Buy above 1.2245, targeting 1.23, with extended targets at 1.2360 and 1.2370 only after a decisive break above 1.2322.
Always wait for a *Reversal/Exhaustion Pattern (REP) on M5 as taught here https://t.me/spanishfbs/2258 before entering trades in the key zones indicated.
*POC Explained: The Point of Control (POC) is the level or zone with the highest volume concentration. If followed by a bearish move, it acts as a resistance zone. If followed by a bullish move, it acts as a support zone, often near lows.
XTIUSD Price Action Breakdown
WTI crude oil prices dropped to around $78.50 per barrel on Thursday after hitting a six-month high of $79.37 the day before. This decline comes despite concerns over tight supplies and falling US oil stockpiles, now at their lowest levels since April 2022, following an eight-week streak of inventory declines.
Adding to supply worries, the US expanded sanctions on Russian oil producers and tankers, forcing Russia's buyers to look for new suppliers and pushing shipping costs. However, the US Energy Information Administration (EIA) expects oil prices to face pressure in the coming years as global production is predicted to grow faster than demand. Analysts also forecast an oversupply in the oil market by 2025, driven by slowing demand growth in significant energy consumers like the US and China.
XTIUSD – D1 Timeframe
The daily timeframe price action chart of XTIUSD shows the price inching closer to the confluence area of the trendline resistance, 88% Fibonacci retracement level, and the rally-base-drop supply zone. Based on the number of confluence factors, the odds largely favor the bears.
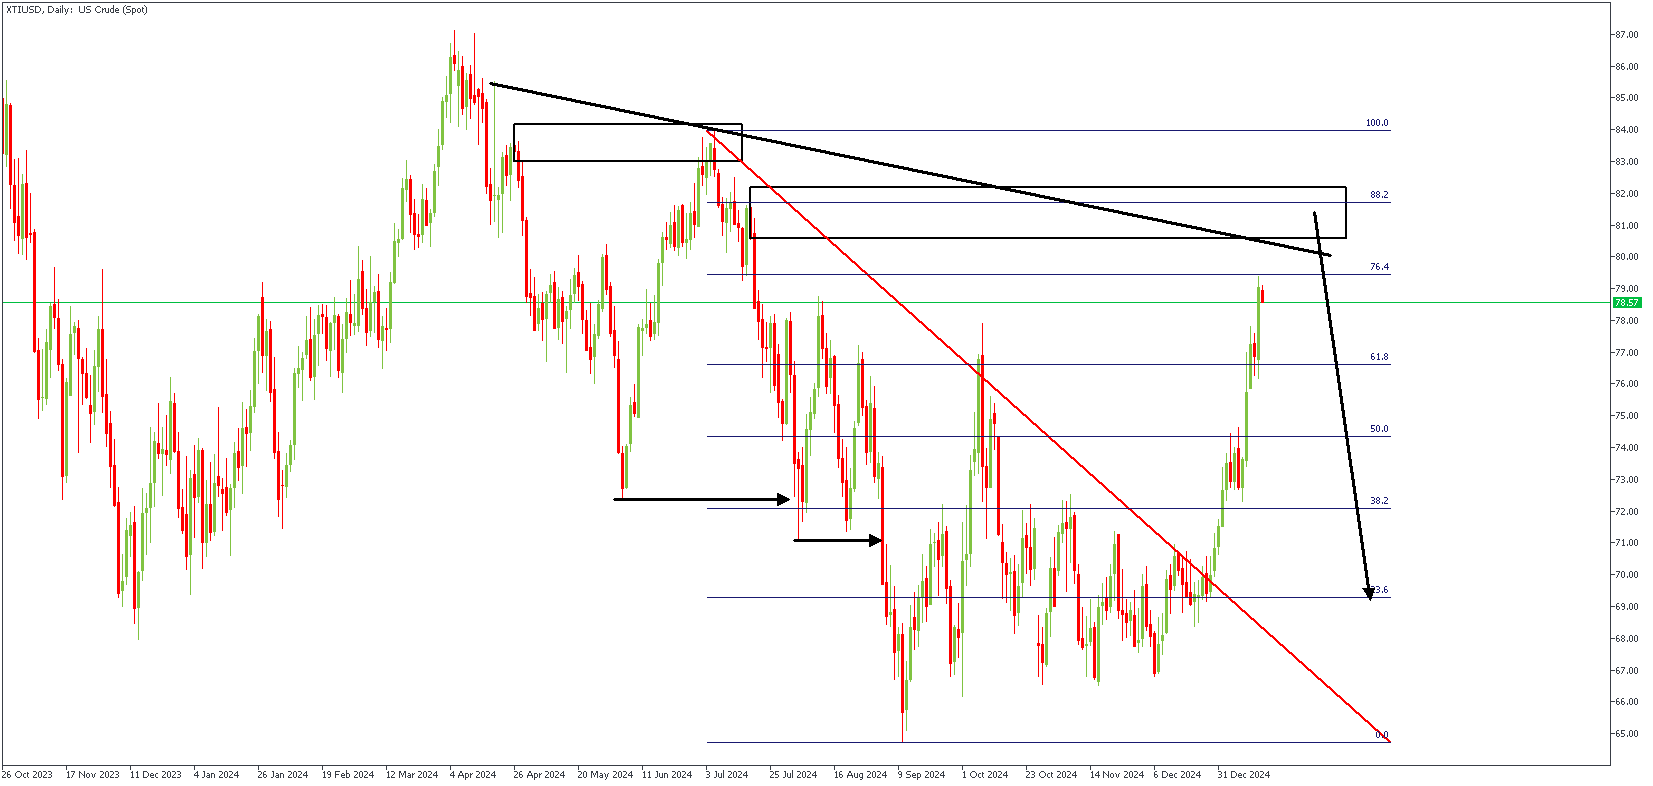
XTIUSD – H4 Timeframe
As the price approaches the daily timeframe trendline resistance, we see a steady constriction within the confines of a rising wedge, further increasing the chances of a bearish outcome. Considering this happens close to the 88% Fibonacci retracement level, another crucial nod favoring the bears.
Analyst's Expectations:
- Direction: Bearish
- Target: 69.29
- Invalidation: 84.21
