Sample Category Title
Brent Crude Looks long-term Bearish
Oil prices dipped slightly on Thursday after reaching multi-month highs the previous day. Brent crude dropped to $81.66 per barrel, while U.S. WTI crude fell to $79.69. These declines followed substantial gains on Wednesday due to falling U.S. crude stockpiles and new U.S. sanctions on Russian oil. The U.S. Energy Information Administration reported a larger-than-expected two million-barrel drop in crude stocks, tightening the global supply outlook as Russia’s key customers scramble for alternatives.
The Biden administration introduced more sanctions targeting Russia, increasing shipping rates and supply concerns. However, OPEC+ will likely stay cautious about raising output despite recent price hikes, as they’ve faced challenges maintaining stable optimism over the past year. On the demand side, global oil consumption grew slightly at the start of 2025, supported by increased travel for festivals in India and Lunar New Year celebrations in China. Some investors also watch for possible U.S. interest rate cuts in 2025, boosting economic activity and energy demand.
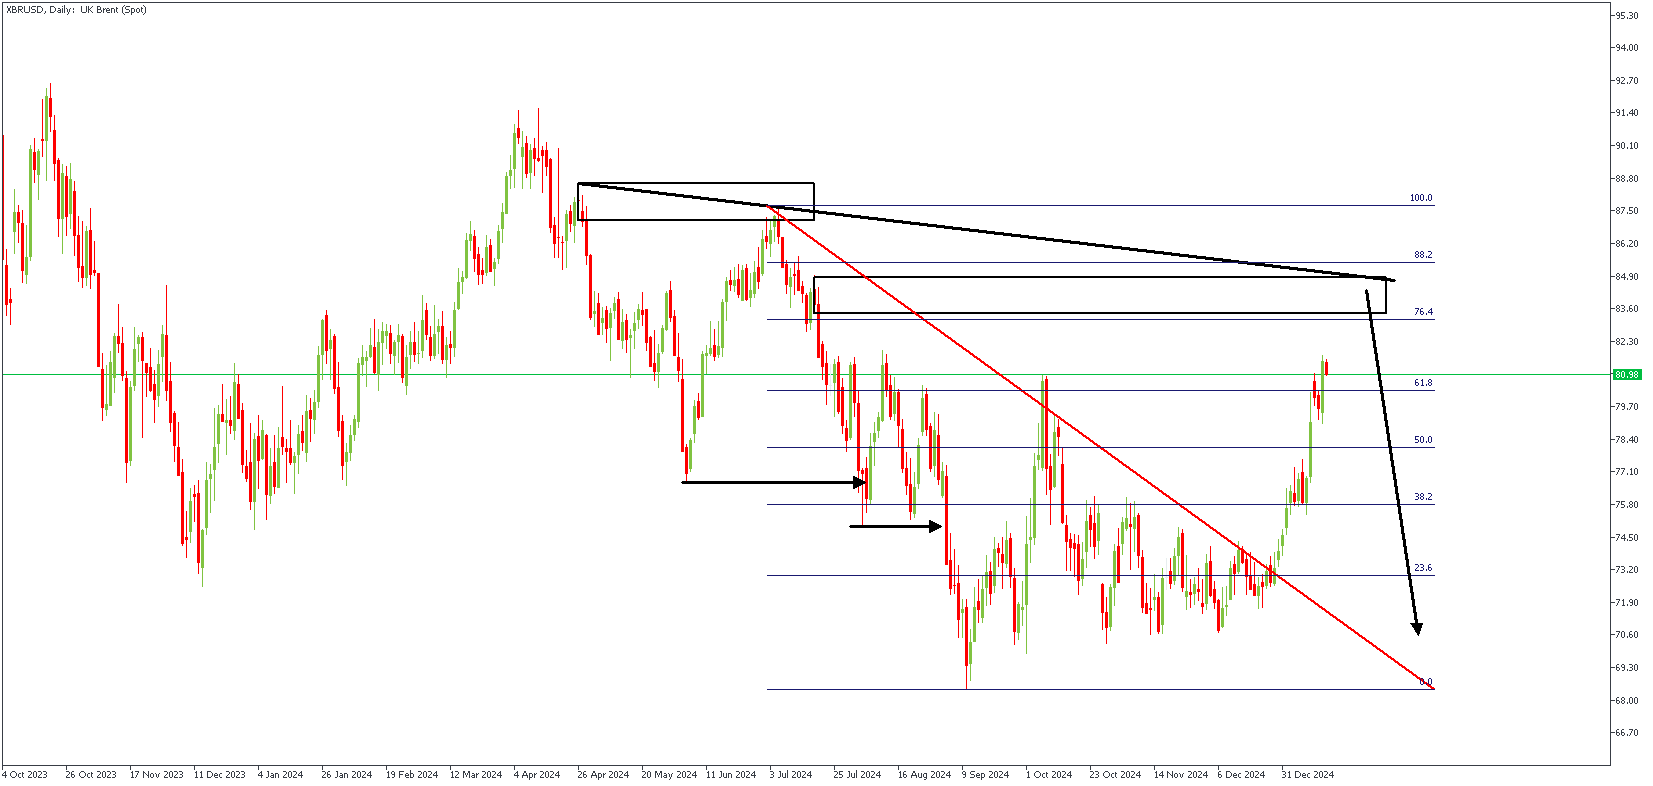
XBRUSD – D1 Timeframe
A basic understanding of market structure teaches that a break of structure is often followed by a retracement—a scenario that is obviously playing out at the moment on the daily timeframe chart of XBRUSD. The retracement move approaches a key Fibonacci retracement level, with the confluence from the trendline resistance and the Fair Value Gap (FVG).
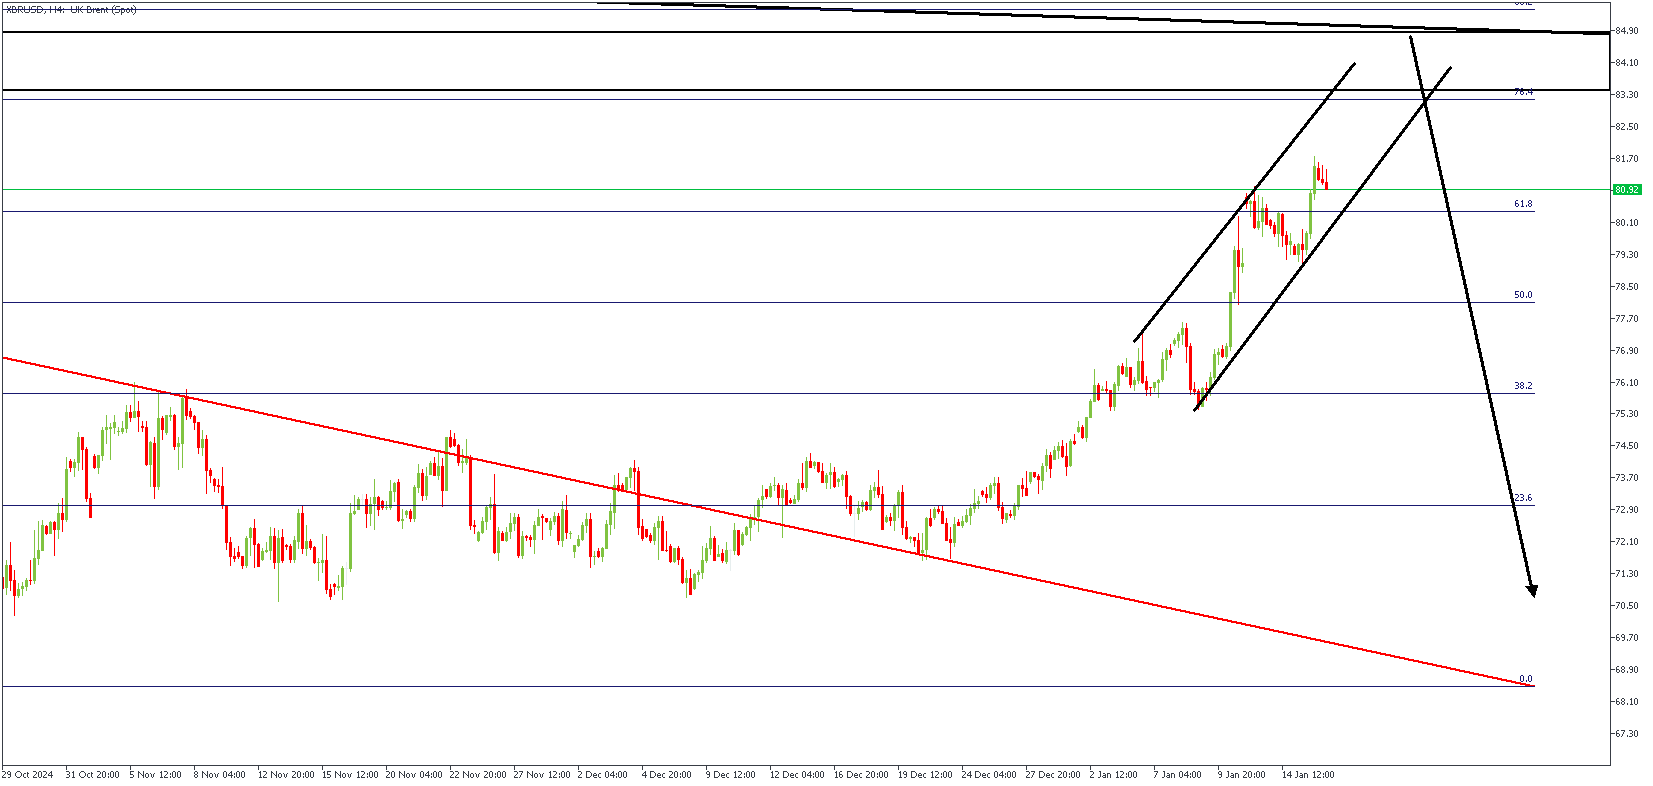
XBRUSD – H4 Timeframe
On the 4-hour timeframe, we see price trading within the range of a rising channel as it climbs towards the supply zone, trendline resistance, and Fibonacci retracement level confluence. The expected reaction from the confluence zone is bearish; however, waiting for a break below the trendline support of the channel provides much safer entry criteria.
Analyst’s Expectations:
- Direction: Bearish
- Target: 71.32
- Invalidation: 87.64
Sunset Market Commentary
Markets
Marginally softer than expected US CPI yesterday caused markets to leave a bond short-positioning that had been built since early December. The release also muted a developing market debate as to whether the Fed at some point could be forced to consider rate hikes again. The market again moved toward December guidance from the Fed dots, considering two additional 25 bps rate cuts this year rather than just one that was discounted after Friday’s strong US payrolls. Today, the next reality check came from the state of US domestic demand, with the December US retail sales. At 0.4% M/M for the headline figure (from an upwardly revised 0.8%) and control group sales at 0.7% M/M, the report was close to expectations suggesting ongoing solid consumer demand at the end of the year. Other data evidence showed a massive beat in the Philly Fed business outlook (44.3 from -10.9) while US weekly jobless claims left recent low readings, rising from 203k to 217k. US yields before the US data release tentatively tried to reverse part of yesterday’s decline, but this move was blocked. US yields currently add 2-3 bps across the curve. German/EMU yields are trading between unchanged at the short end, but the long end resumes its steepening bias (+3bps 30-y Germany). The account of the December 11-12 ECB policy meeting confirmed that the MPC sees room for gradually further easing as the disinflation process remains well on track, with also less inflationary pressures seen from wages and profit margins. UK gilts outperform with yields declining up to 4 bps (2-y). After softer than expected UK December inflation data yesterday, lackluster monthly December output data (industrial production -0.4% M/M) are convincing markets that the BoE has an ever stronger case to reduce policy restriction already at the early February meeting. European equites are extending yesterday’s rebound (EurosStoxx 50 +1.3%). For now, the goldilocks combination of softer CPI and ongoing solid demand/retail sales hardly helps further gains in US equities (S&P 500 +0.1%). Brent oil is holding most of yesterday’s jump higher ($81.9/b).
After holding up well despite the sharp decline in US yields yesterday, the dollar also shows resilient today. DXY gains from 109 to 109.25. EUR/USD declines, albeit modestly, to 1.0275. The yen this morning outperformed on headlines that the BoJ might be moving ever closer to a rate hike next week. USD/JPY briefly dropped to the 155.25 area, but the pair again trades near 156 on USD strength currently. After a relief rebound on global market easing yesterday, sterling today incurs further losses with EUR/GBP rebounding higher (0.843) and cable returning below 1.22. Sterling interest rate support might narrow sooner and faster than expected before yesterday.
News & Views
The Bank of England published its quarterly Bank liabilities and its Credit condition surveys today. The BLS showed lenders reporting increasing total funding volumes in the three months to end-November, but those were expected to decrease again in the current quarter. This hides the divergence between higher retail funding and lower “other” funding. The cost of funding of both increased and are expected to continue doing so. The credit conditions survey pointed out that the availability of (un)secured credit to households and the overall availability to the corporate sector all increased and is expected to increase further. Lenders also reported better demand for secured lending for house purchases, for unsecured lending and for corporate lending from SME’s. Overall unsecured lending spreads were the only ones that widened in Q4. Only default rates on secured loans for households increased slightly.
The National Bank of Poland kept its policy rate as expected unchanged at 5.75%. The policy statement will be released later today with NBP governor Glapinski delivering his press conference tomorrow. Earlier today, the NBP published its own core CPI series. Underlying price pressures unexpectedly weakened in December (-0.1% M/M) with the annual figure dipping from 4.3% to 4% instead of the forecasted 4.2%. CPI excluding administered prices stabilized at 3.2% Y/Y with CPI excluding the most volatile prices ticking lower from 5.3% to 5.2%. The Polish zloty loses marginally ground today at 4.2675, with data strengthening the 4.25 technical support area.
US: Retail Sales Growth Remained Strong in December
U.S. retail and food services sales rose 0.4% month-on-month (m/m) in December, down from the upwardly revised 0.8% increase seen in November (previously 0.7%), and slightly below the consensus forecast calling for a 0.6% gain.
A drop in food services sales weighed on the headline (-0.3% m/m). On a year-over-year basis, growth decelerated rapidly last year, slowing to 2.4% down from 11.4% in December of 2023. Excluding the services category, retail sales were up 0.6% on the month.
December brought another sizeable increase in sales of vehicles and parts, which rose 0.7% m/m. Sales at gasoline stations advanced by 1.5%, due to higher prices at the pump. Sales at building materials and equipment stores declined by 2% - a third consecutive monthly decline.
Sales in the "control group", which the excludes volatile components above (i.e., gasoline, autos and building supplies) and is used in the estimate of personal consumption expenditures (PCE), rose by a robust 0.7% m/m, an acceleration from the 0.4% gain in November.
Sales across most other brick and mortar retailers were also higher on the month, with the strongest gains seen in miscellaneous store retails (+4.3%), retailers selling sporting and hobby items (+2.6%) and furniture and home furnishings stores (+2.3%).
Non-store retailers edged higher by only 0.2%, following a sizeable gain the prior month.
Key Implications
Despite the headline retail sales figure coming in below expectations, growth in core sales remained very healthy in December, suggesting U.S. consumers ended 2024 on a high note. It’s easy to see why. The labor market remained strong, continuing to add jobs through the end of the year, while inflation has subsided (particularly in the goods category), and household wealth remains elevated. Even with recent volatility in the equity market, the S&P 500 is still up 25% from a year ago. Anecdotally, the Fed’s latest Beige Book reaffirmed robust consumer spending at the end of last year, noting that “consumer spending has moved up moderately, with most districts reporting strong holiday sales that exceeded expectations.” For the fourth quarter as a whole, we expect inflation-adjusted consumer spending to rise somewhere in 3%-3.5% range, in line with the third quarter.
Looking ahead, we anticipate that consumer spending will remain healthy, although growth is likely to moderate closer to 2%, alongside some moderation in job growth. The risk of higher-than-expected inflation—and consequently higher interest rates—amid a series of anticipated policy changes under the incoming administration could pose some downside risk to the consumer spending outlook.
USD/JPY Mid-Day Outlook
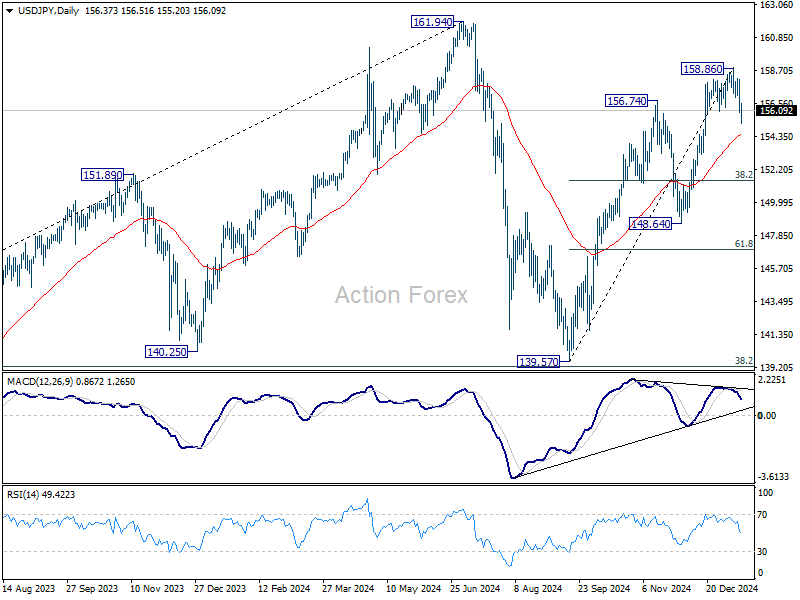
Daily Pivots: (S1) 155.56; (P) 156.85; (R1) 157.75; More...
Intraday bias in USD/JPY remains mildly on the downside for the moment. Fall from 158.86 short term top is in progress for 55 D EMA (now at 154.44). Firm break there will target 38.2% retracement of 139.57 to 158.86 at 151.49 next. For now, risk will stay on the downside as long as 158.86 resistance holds, in case of recovery.
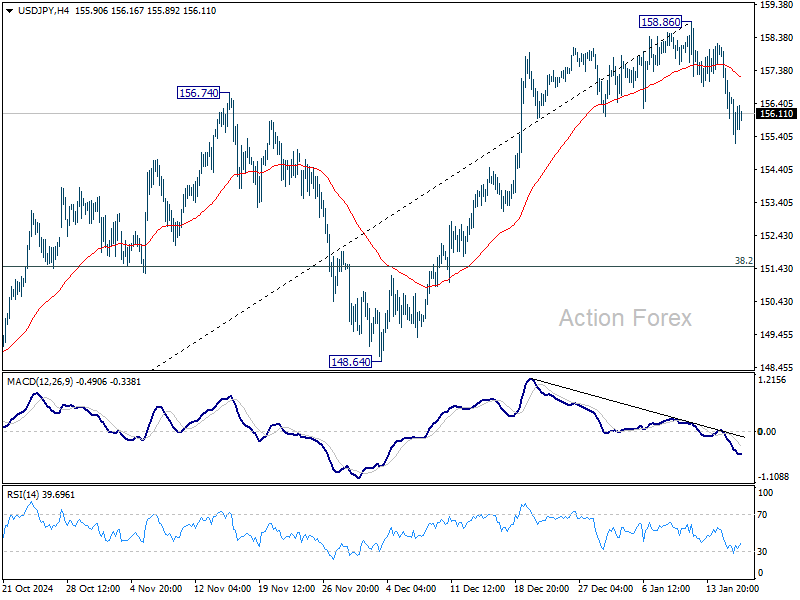
In the bigger picture, price actions from 161.94 are seen as a corrective pattern to rise from 102.58 (2021 low). The range of medium term consolidation should be set between 38.2% retracement of 102.58 to 161.94 at 139.26 and 161.94. Nevertheless, sustained break of 139.26 would open up deeper medium term decline to 61.8% retracement at 125.25.
USD/CHF Mid-Day Outlook
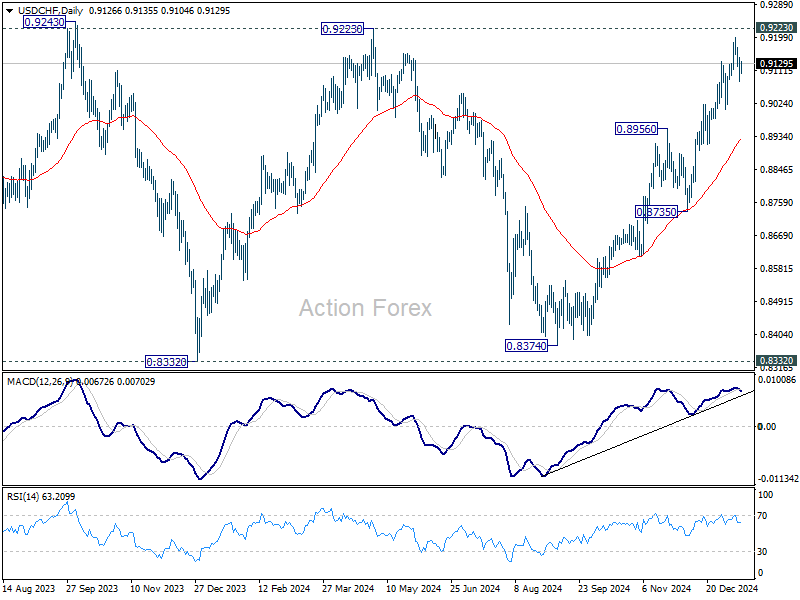
Daily Pivots: (S1) 0.9090; (P) 0.9122; (R1) 0.9158; More…
Intraday bias in USD/CHF remains neutral as consolidation continues below 0.9200. As long as 0.9007 support holds, near term outlook remains bullish. On the upside, decisive break of 0.9223 will carry larger bullish implications. However, break of 0.9007 will confirm short term topping, and turn bias back to the downside for 55 D EMA (now at 0.8930).
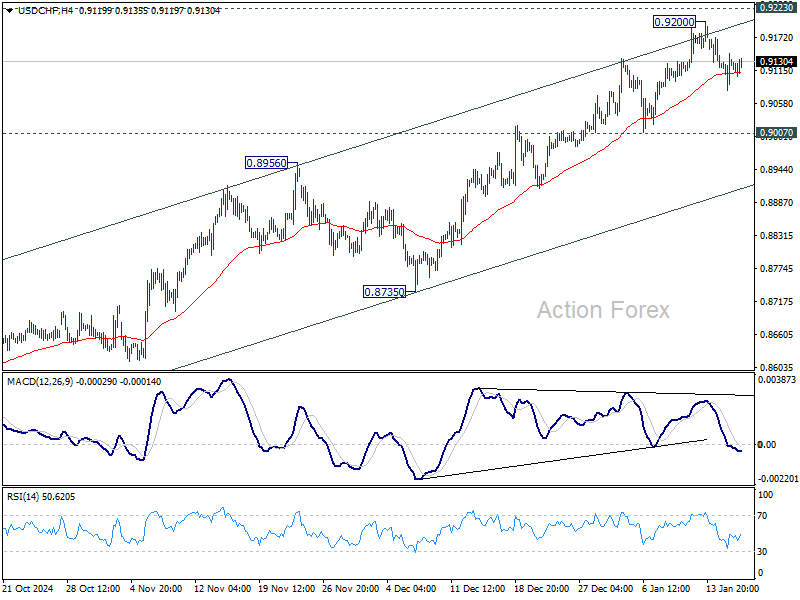
In the bigger picture, price actions from 0.8332 (2023 low) are currently seen as a medium term corrective pattern, with rise from 0.8374 as the third leg. Overall outlook will continue to stay bearish as long as 0.9223 resistance holds. Break of 0.8332 low is in favor at a later stage when the consolidation completes. However, decisive break of 0.9223 will be an important sign of bullish trend reversal.
GBP/USD Mid-Day Outlook
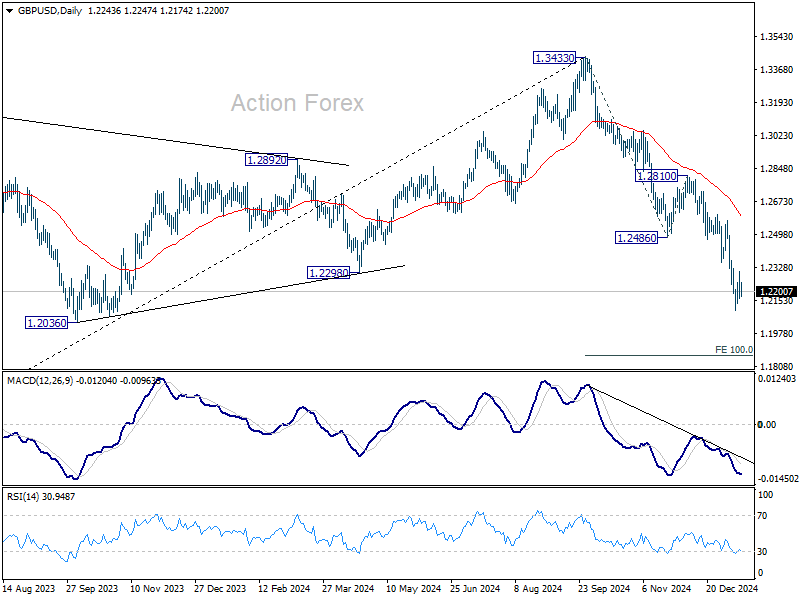
Daily Pivots: (S1) 1.2176; (P) 1.2242; (R1) 1.2310; More...
No change in GBP/USD's outlook as consolidation continues above 1.2099. Outlook remains bearish with 1.2486 support turned resistance intact. Larger fall from 1.3433 is still expected to continue. On the downside, break of 1.2099 will resume the decline to 100% projection of 1.3433 to 1.2486 from 1.2810 at 1.1863.
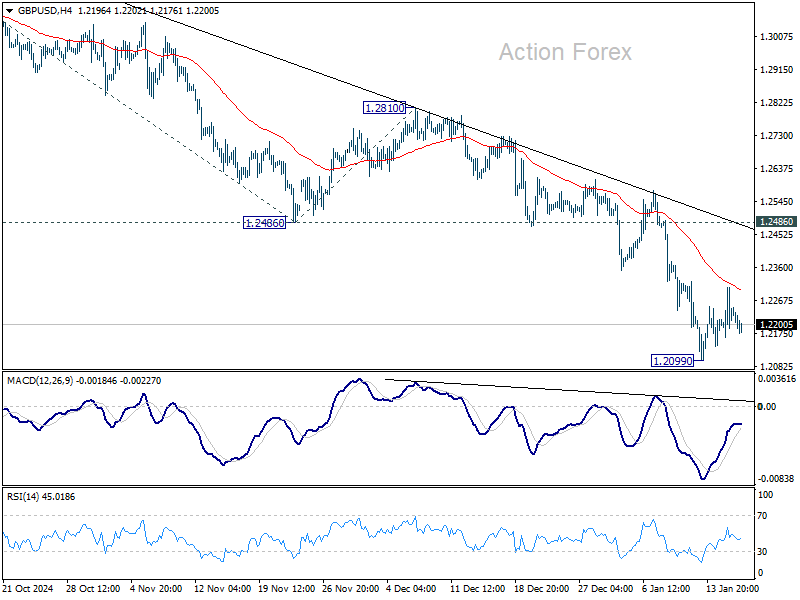
In the bigger picture, rise from 1.0351 (2022 low) should have already completed at 1.3433, and the trend has reversed. Further fall is now expected as long as 1.2810 resistance holds. Deeper decline should be seen to 61.8% retracement of 1.0351 to 1.3433 at 1.1528, even as a corrective move.
EUR/USD Mid-Day Outlook
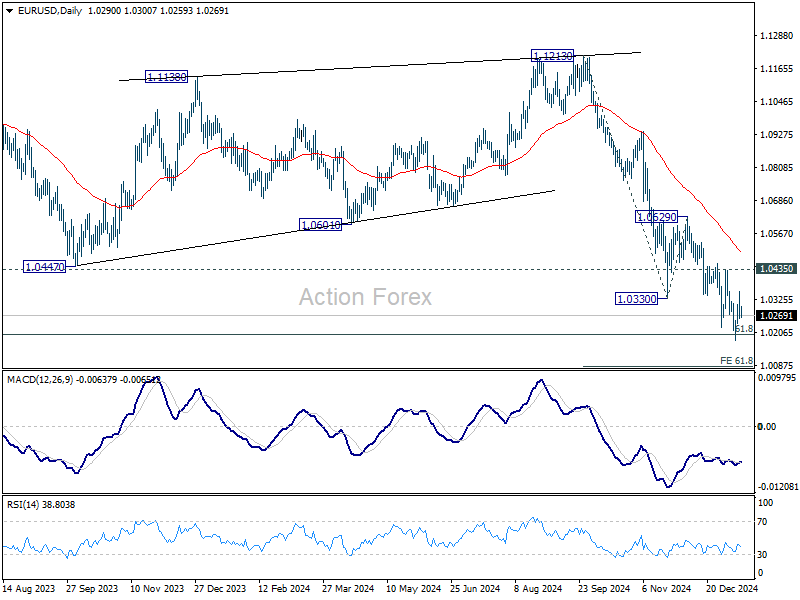
Daily Pivots: (S1) 1.0248; (P) 1.0302; (R1) 1.0344; More...
EUR/USD is still engaged in consolidations above 1.0176 and intraday bias stays neutral. With 1.0435 resistance intact, outlook remains bearish and further decline is expected. On the downside, break of 1.0176 will resume the fall from 1.1213 and target 61.8% projection of 1.1213 to 1.0330 from 1.0629 at 1.0083. However, considering bullish convergence condition in 4H MACD, firm break of 1.0435 will confirm short term bottoming, and turn bias back to the upside for stronger rebound.
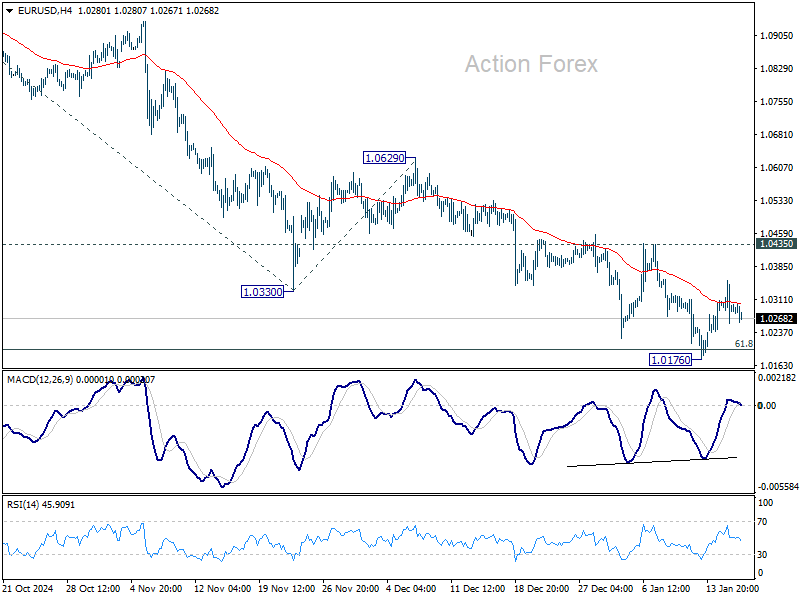
In the bigger picture, fall from 1.1274 (2023 high) should either be the second leg of the corrective pattern from 0.9534 (2022 low), or another down leg of the long term down trend. In both cases, sustained break of 61.8 retracement of 0.9534 to 1.1274 at 1.0199 will pave the way back to 0.9534. For now, outlook will stay bearish as long as 1.0629 resistance holds, even in case of strong rebound.
Cautious Trade Dominates as Dollar Holds Steady, Yen Leads, Gold Jumps
Activity in the forex markets has turned relatively subdued today, with no clear trend emerging as traders shift into a cautious stance. With no top-tier economic data scheduled for the rest of the week, attention is turning to the impending inauguration of US President-elect Donald Trump next Monday. The spotlight is squarely on his anticipated tariff policies, which could have profound implications for global trade and economic stability.
Yen holds its position as the strongest currency of the day, buoyed by increasing speculation of a potential rate hike from the Bank of Japan at its meeting next week. BoJ Governor Kazuo Ueda’s consistent messaging has reinforced market expectations, with traders pricing in a higher likelihood of policy tightening.
Swiss Franc ranks second best, benefiting from decline in European benchmark yields. Dollar is the third-best performer, continuing to consolidate against its peers. The greenback's movements were unaffected by slightly worse-than-expected US jobless claims and retail sales data.
On the downside, New Zealand Dollar has overtaken Sterling as the weakest currency of the day. Pound remains under pressure following disappointing GDP data but has not faced aggressive selling. Meanwhile, Australian Dollar is the third weakest, while Euro and Canadian Dollar trade in mixed fashion.
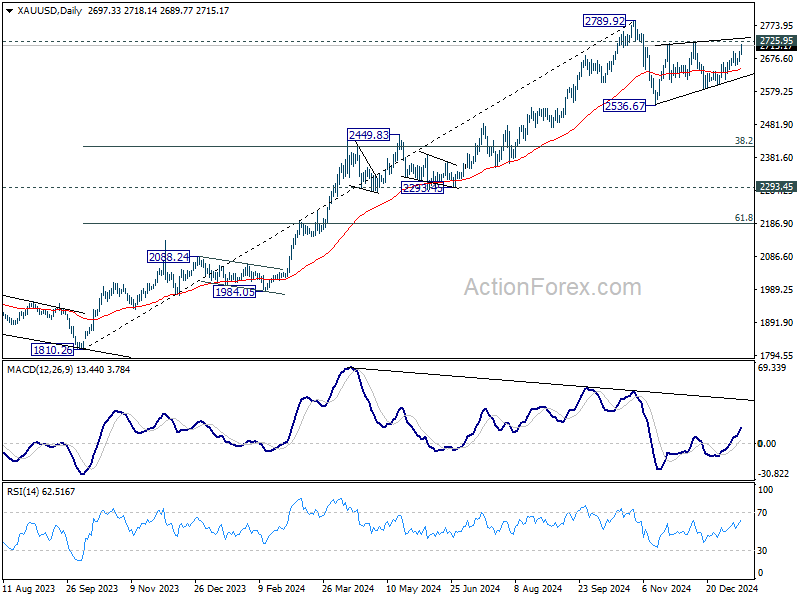
Technically, Gold's rally this week suggests that choppy rebound from 2536.67 is actually still in progress. Further rise is now in favor through 2725.95 resistance in the near term. However, this rise is seen as the second leg of the corrective pattern from 2789.92. Hence, upside should be below this high. Break of 55 D EMA (now at 2643.87) will argue that the third leg has started to 2536.67 support and below.
US initial jobless claims falls to 217k vs exp 210k
US initial jobless claims rose 14k to 217k in the week ending January 11, above expectation of 210k. Four-week moving average of initial claims fell -750 to 213k.
Continuing claims fell -18k to 1859k in the week ending January 4. Four-week moving average of continuing claims fell -1k to 1867k.
US retail sales rise 0.4% mom in Dec, ex-auto sales up 0.4% mom
US retail sales rose 0.4% mom to USD 729.2B in December, below expectation of 0.5% mom. Ex-auto sales rose 0.4% mom to USD 586.3B, below expectation of 0.5% mom. Ex-gasoline sales rose 0.4% mom to USD 676.8B. Ex-auto & gasoline sales rose 0.4% mom to USD 533.9B.
Total sales for the October through December period were up 3.7% from the same period a year ago.
ECB Minutes: Gradual easing essential to monitor disinflation check points
ECB’s December 11–12 meeting minutes noted that while the 25 bps rate cut decided at the meeting was widely supported, some members argued for a more aggressive 50 bps reduction.
Some policymakers contended that a larger rate cut would have better addressed Eurozone’s weakening economic projections, with one noting that “successive projection exercises have shown increasing downside risks to growth.”
However, the majority concurred that a smaller, measured cut aligned with the “controlled pace of easing” and provided a "sense of the direction" of the path of interest rates.
The minutes emphasize while projections were conditional on a further rate cut in January, the meeting underscored that “data dependency precluded any foregone conclusions.”
The minutes also stated that the “measured pace of interest rate cuts” was essential to ensure that ECB could “pass critical checkpoints to verify disinflation remains on track.” Furthermore, it was highlighted that optionality must be preserved to address risks that could derail inflation stabilization, including geopolitical tensions, global trade disruptions, and energy price volatility.
Nevertheless, "if the baseline projection for inflation is confirmed over the next few months and quarters,” the minutes noted, a “gradual dialing back of policy restrictiveness” would be appropriate.
Eurozone goods exports fall -1.6% yoy in Nov, imports down -1.0% yoy
Eurozone goods exports fell -1.6% yoy to EUR 248.3B in November. Good imports fell -1.0% yoy to EUR 231.9B. Trade balanced showed a EUR 16.4B surplus. Intra-Eurozone trade fell -7.0% yoy to EUR 214.8B.
In seasonally adjusted term, goods exports rose 3.2% mom to EUR 240.6B.Goods imports rose 0.7% mom to EUR 227.8B. Trade balance widened from October's EUR 7.0B to EUR 12.9B, larger than expectation of EUR 7.2B. Intra-Eurozone trade fell -1.7% mom to EUR 210.4B.
UK GDP grows only 0.1% mom in Nov, with mixed sector performance
UK’s economy posted modest growth in November, with GDP increasing by 0.1% mom, but slightly missing market expectations of 0.2%. Nevertheless, this marked a positive turnaround from the -0.1% mom contraction in October.
Sectoral performance was mixed, with services, the largest contributor to the economy, inching up by 0.1% mom, while production fell by -0.4% mom. Construction activity, however, provided a brighter spot, rising 0.4% mom during the month.
Despite November’s modest gains, the broader economic picture remains subdued. Over the three months to November 2024, real GDP showed no growth compared to the three months to August. Services, which account for a significant portion of the UK’s output, stagnated over this period. Production output contracted by -0.7%, offsetting the 0.2% growth seen in construction.
BoJ’s Ueda reiterates rate hike debate for next week’s policy meeting
BoJ Governor Kazuo Ueda indicated today, for the second time this week, that the central bank will "debate whether to raise interest rates" at its upcoming January 23-24 policy meeting. This marks the second time in this week that Ueda has emphasized
Ueda’s comments come as BoJ prepares its new quarterly economic report, which will serve as the basis for its policy decision. While the Governor has not committed to a specific outcome, the repeated message signals that a rate hike is a plausible scenario, barring any significant market shocks tied to the January 20 inauguration of U.S. President-elect Donald Trump.
Market sentiment, nevertheless, remains divided on the timing of the anticipated hike. A recent poll conducted between January 8-15 shows that 59 out of 61 economists expect BoJ to raise rates to 0.50% by the end of March. Yet, only 20 foresee the move occurring at this month’s meeting.
Japan's PPI holds steady at 3.8% as import prices turn positive
Japan's PPI held steady at 3.8% yoy in December, meeting market expectations and maintaining the previous month’s pace. Key drivers included a sharp 31.8% yoy rise in agricultural goods prices, fueled by soaring rice costs.
Energy costs also contributed significantly, with electric power, gas, and water prices climbing 12.9% year-on-year. This uptick comes as the government phases out subsidies designed to mitigate rising utility and gasoline prices.
Yen-based import prices turned positive, rising 1.0% yoy after three months of declines. While modest, this reversal underscores the lingering effects of Yen depreciation, which was recorded at -0.1% mom.
Australia’s employment grows 56.3k in Dec, showing continuous resilience
Australia’s labor market displayed resilience in December as employment surged by 56.3k, significantly exceeding expectations of a 15.0k increase. Number of unemployed people also rose by 10.3k, contributing to a slight uptick in the unemployment rate from 3.9% to 4.0%, in line with forecasts.
Participation rate climbed to a record high of 67.1%, up from 67.0%, reflecting an expanding labor force. Additionally, employment-to-population ratio rose by 0.1 percentage point to a new peak of 64.5%, showcasing the labor market’s capacity to absorb more workers. Monthly hours worked increased by 0.5% mom, equivalent to 10 million additional hours.
This data supports the view that the labor market’s earlier signs of easing have stabilized in the second half of 2024. Robust employment growth, consistent levels of average hours worked, and unchanged or lower levels of labor underutilization compared to a year ago affirm the ongoing strength of the job market.
EUR/USD Mid-Day Outlook
Daily Pivots: (S1) 1.0248; (P) 1.0302; (R1) 1.0344; More...
EUR/USD is still engaged in consolidations above 1.0176 and intraday bias stays neutral. With 1.0435 resistance intact, outlook remains bearish and further decline is expected. On the downside, break of 1.0176 will resume the fall from 1.1213 and target 61.8% projection of 1.1213 to 1.0330 from 1.0629 at 1.0083. However, considering bullish convergence condition in 4H MACD, firm break of 1.0435 will confirm short term bottoming, and turn bias back to the upside for stronger rebound.
In the bigger picture, fall from 1.1274 (2023 high) should either be the second leg of the corrective pattern from 0.9534 (2022 low), or another down leg of the long term down trend. In both cases, sustained break of 61.8 retracement of 0.9534 to 1.1274 at 1.0199 will pave the way back to 0.9534. For now, outlook will stay bearish as long as 1.0629 resistance holds, even in case of strong rebound.
S&P 500, Nasdaq 100 Update – Strong Earnings Power Market Gains
- TSMC’s strong Q4 2024 earnings and positive 2025 forecast boosted market sentiment and drove gains in chip stocks like Nvidia.
- Overall corporate profits remain strong, with a high percentage of S&P 500 companies exceeding earnings estimates.
- Technically, the S&P 500 is still in a bearish trend, but a close above the 5981 handle could signal a change in structure and potential further upside.
U.S. stocks saw a boost before the market opened, with Nasdaq 100 futures rising 0.5%, helped by positive news from TSMC, a major chipmaker for Apple and Nvidia. S&P 500 futures went up 0.3% after gaining 1.8% on Wednesday, its best day since the November election.
TSMC Provides Hope for AI Spending
TSMC’s 2025 forecast beat market expectations across all important areas, easing worries about a drop in AI spending.
TSMC’s fourth-quarter revenue grew 38.8% to NT$868.46 billion, beating the expected NT$850.08 billion. In U.S. dollars, revenue reached $26.4 billion, slightly above the company’s forecast of $26.1-26.9 billion. Net income rose 57% to a record NT$374.68 billion, with earnings per share at NT$14.45. Analysts had predicted NT$366.61 billion in net income. Overall, TSMC’s profit hit a record high, increasing 57% from last year, while revenue jumped nearly 39%.
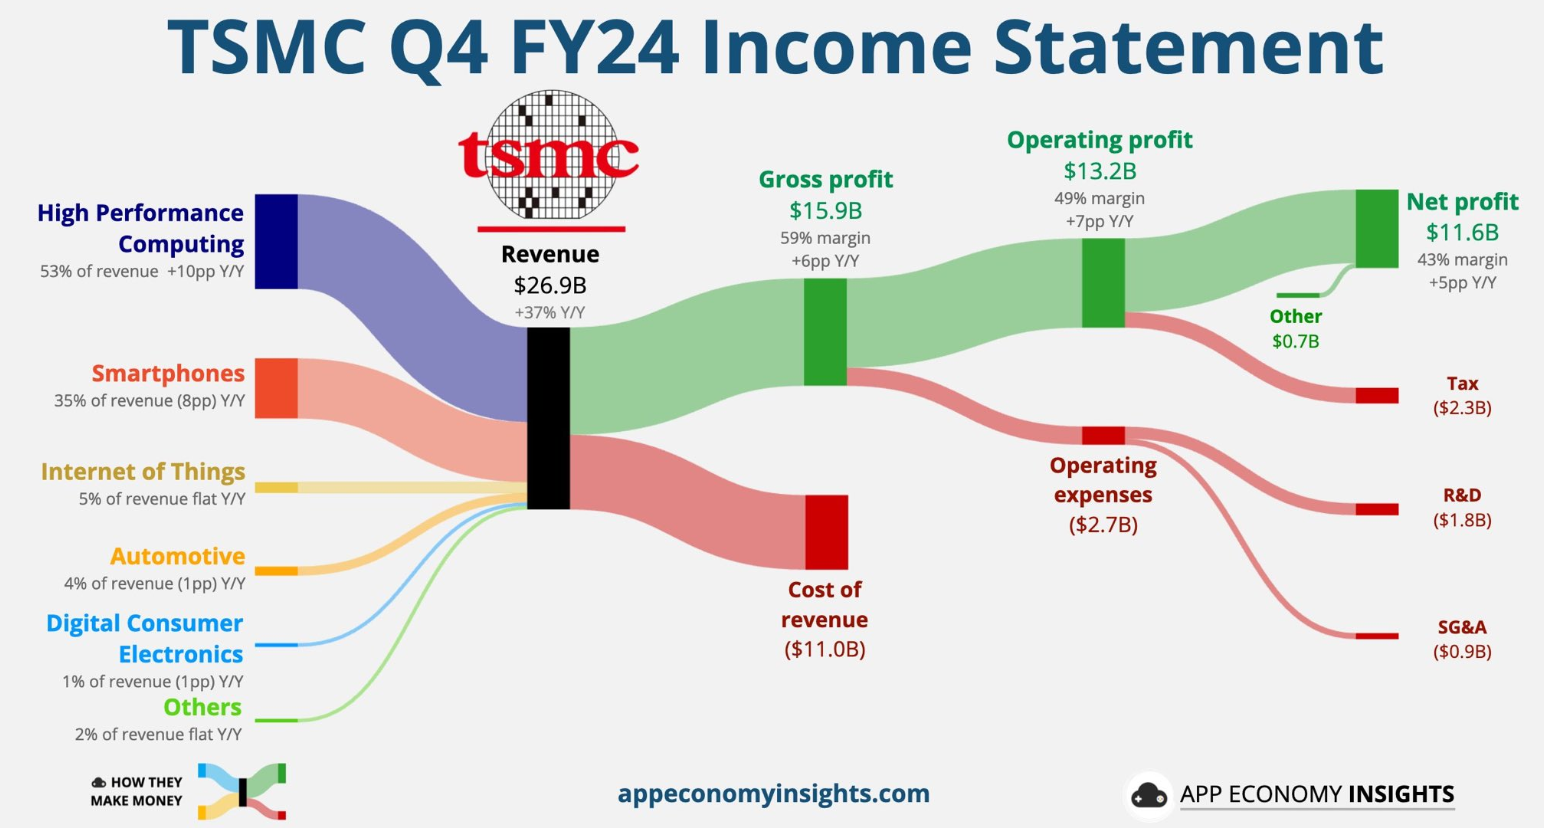
Source: App Economy Insights (click to enlarge)
More interestingly however, TSMC expects to spend up to 19% more than analysts thought which adds to the belief that a slowdown in AI spending may not materialize. Speaking on the results, Chief Financial Officer Wendell Huang. “Moving into first quarter 2025, we expect our business to be impacted by smartphone seasonality, partially offset by continued growth in AI-related demand.”
The news left TSMC trading 3.76% up on the day and helping drag other chipmakers along for the ride. Nvidia is one of the major beneficiaries, trading up around 3.3% at the time of writing.
Earnings Season – Corporate Profits Remain Strong
Earnings season got off to a bright start yesterday with three of the country’s biggest banks smashing their earnings estimates. Of the 28 companies in the S&P 500 that have reported fourth-quarter earnings as of Wednesday, 82.1% have surpassed estimates, according to data compiled by LSEG.
The good news continued today as both Bank of America and Morgan Stanley saw their earnings reports beat expectations as well. Morgan Stanley’s profit grew in the fourth quarter, driven by a surge in deals and stock sales, pushing its yearly revenue to a record high.
Bank of America reported higher-than-expected profits on Thursday as its traders took advantage of busy fourth-quarter activity, and the bank said it expects to earn more interest income in 2025. On an adjusted basis, BofA earned 82 cents per share in the fourth quarter, beating analysts’ expectation of 77 cents per share, according to estimates compiled by LSEG.
Shares were up 2.7% in premarket trade.
The Week Ahead
This week earnings are largely done for now with major earnings releases set to continue next week Tuesday January 21, 2025. Netflix will report after the market close on Tuesday which will come a day after the inauguration of Donald Trump as US President.
The next 10 days will be crucial for markets as incoming President Trump has promised major moves from day one, many of which may have an impact on US Equities and markets in general.
Technical Analysis
S&P 500
From a technical standpoint, the S&P 500 remains in a bearish trend on the daily timeframe.
The swing high of Monday January 6, continues to hold firm with a daily candle close above the 5981 handle needed for a change in structure.
If this does not materialize the S&P 500 remains vulnerable to further downside.
Immediate support rests at 5910 before the confluence level at 5828-5835 comes into focus. Here we have a key area of support as well as the 100-day MA. Lower down we have support at 5757 and 5668 respectively.
If the S&P is able to close above the 5981 handle then 6025 and the ATH print around 6094 come into focus.
S&P 500 Daily Chart, January 16, 2025
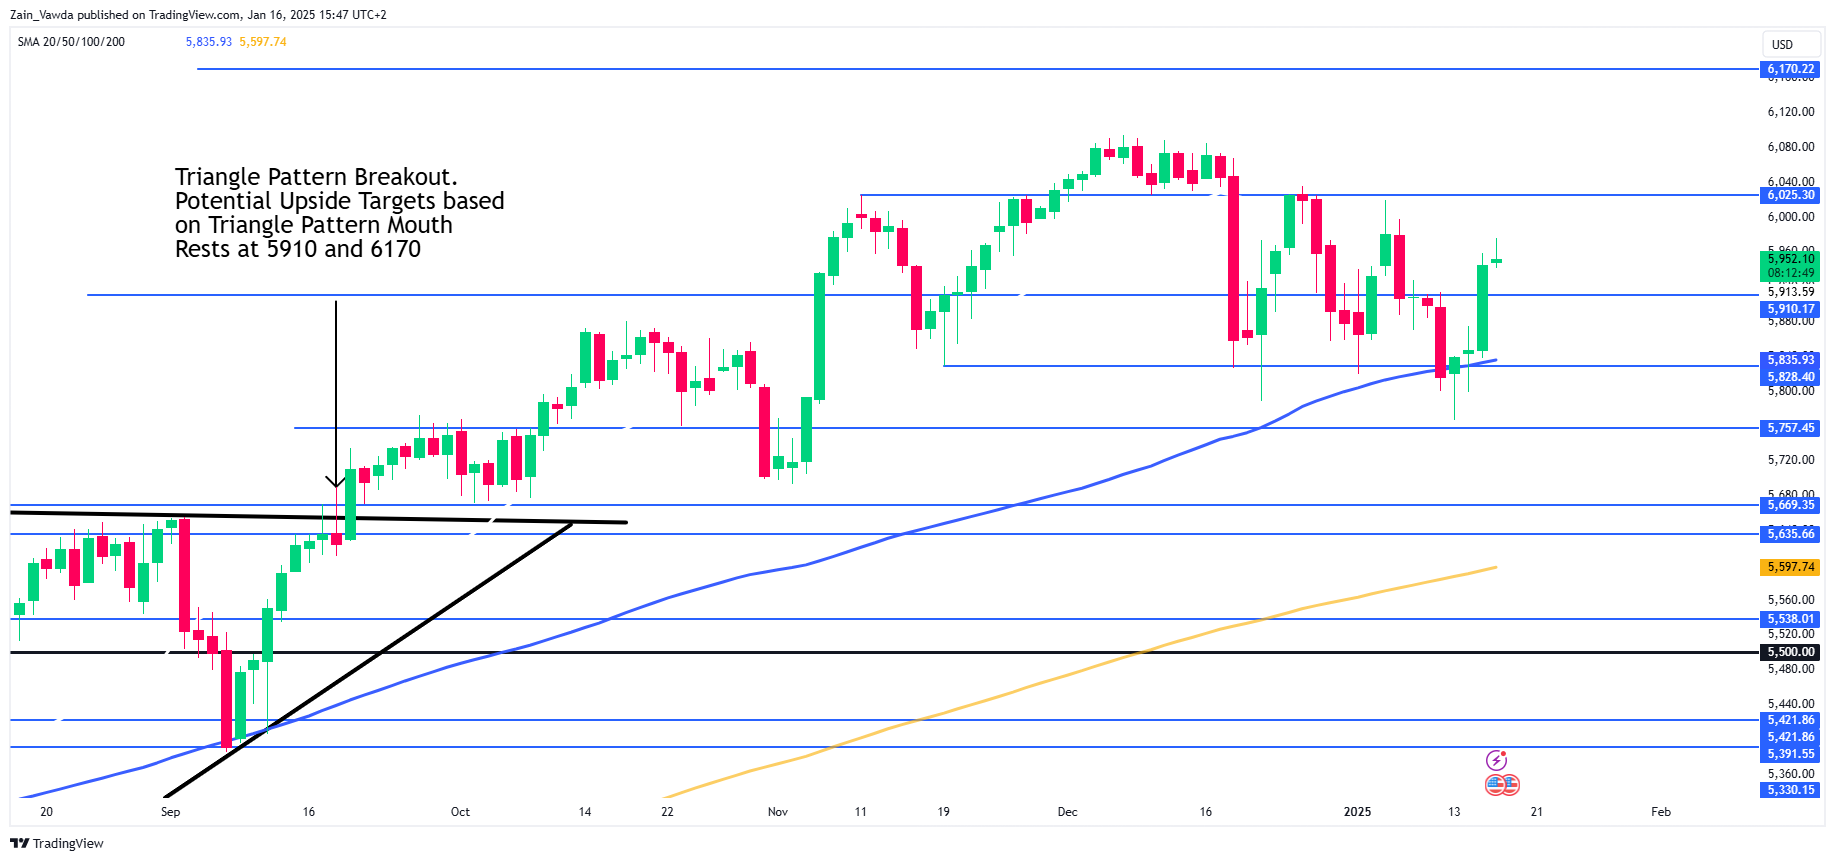
Source: TradingView (click to enlarge)
Support
- 5910
- 5828
- 5757
Resistance
- 6000
- 6025
- 6094
US initial jobless claims falls to 217k vs exp 210k
US initial jobless claims rose 14k to 217k in the week ending January 11, above expectation of 210k. Four-week moving average of initial claims fell -750 to 213k.
Continuing claims fell -18k to 1859k in the week ending January 4. Four-week moving average of continuing claims fell -1k to 1867k.