
Sample Category Title
USD/CAD Under Immense Selling Pressure
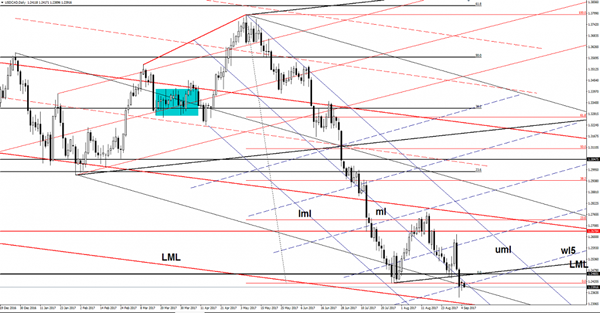
USD/CAD dropped much below the 1.2400 psychological level and could resume the downside movement. You can see that is pressuring some support level, a valid breakdown will confirm a further drop in the upcoming period.
The major downside target stands at the lower median line (LML) of the major descending pitchfork, only a failure to reach it will signal a reversal.
Trade Idea : USD/JPY – Sell at 109.80
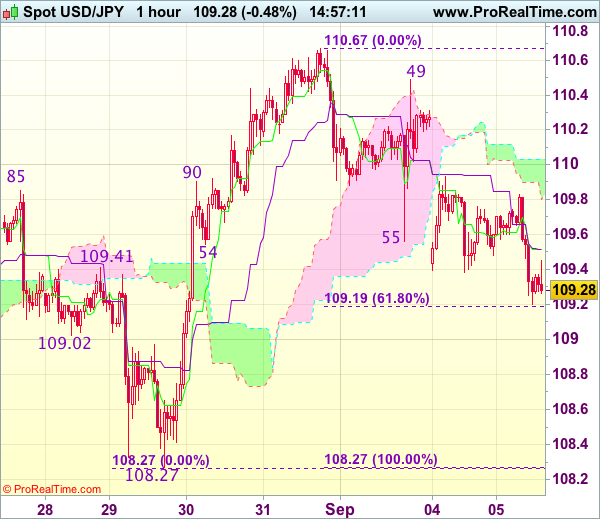
USD/JPY - 109.30
Most recent candlesticks pattern : N/A
Trend : Near term up
Tenkan-Sen level : 109.52
Kijun-Sen level : 109.52
Ichimoku cloud top : 110.03
Ichimoku cloud bottom : 109.83
New strategy :
Sell at 109.80, Target: 108.80, Stop: 110.15
Position : -
Target : -
Stop : -
As the greenback has remained under pressure after opening lower yesterday, adding credence to our view that top has possibly been formed at 110.67 last week and consolidation with downside bias remains for weakness to 109.15-19 (61.8% Fibonacci retracement of 108.27-110.67), however, break there is needed to provide confirmation and bring further fall to 108.80-85, however, reckon 108.55-60 would limit downside and support at 108.27 remain intact.
In view of this, we are looking to sell dollar on recovery as 109.80-85 should limit upside and bring another decline later. Above 110.00-05 would defer and risk rebound to 110.30 but only break of 110.49 would signal the pullback from 110.67 has ended, bring retest of this level first.
EUR/CHF Extends The Sell-Off
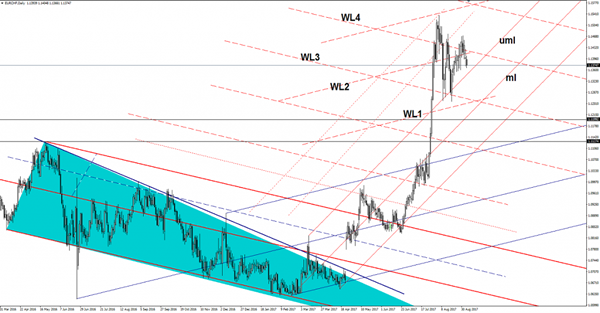
Price is trading in the red and seems poised to reach fresh new lows in the upcoming days. EUR/CHF is very heavy and looks unstoppable on the Daily chart. Is almost to hit a dynamic support, but most likely will take this out and will drop much deeper after a false breakout.
Seems like that the rebound is completed and now we'll have a larger drop, but we still need a confirmation. The European currency has lost significant ground also versus the Yen in the morning as the Nikkei stock index plunged in the last hours.
The rate will be driven by the fundamental factors later, the Switzerland CPI may increase by 0.0% in the previous month, while the GDP by 0.5% in the second quarter and could exceed the 0.3% growth in Q1.
Price failed to stabilize above the fourth warning line (WL4) and now is going down. Is very close to reach and retest the upper median line (uml) of the minor ascending pitchfork. A breakdown seems imminent after the failure to approach and reach the 1.1536 previous high.
You should know that a valid breakdown below the upper median line (uml) of the ascending pitchfork will open the door for more declines in the upcoming period.
Price will increase further only if will be rejected by the upper median line and if will stabilize above the WL4. Technically could drop much deeper after the impressive rally, but only a valid breakdown will confirm it.
European Open Briefing: Asian Equity Was Mixed Early On Tuesday
Global Markets:
- Asian stock markets: Nikkei lost 0.62 %, Shanghai Composite rose 0.24 %, Hang Seng climbed 0.22 %, ASX 200 fell 0.05 %
- Commodities: Gold at $1341.80 (+0.86 %), Silver at $17.96 (+0.83 %), WTI Oil at $47.47 (+0.38 %), Brent Oil at $52.22 (-0.23%)
- Rates: US 10-year yield at 2.13, UK 10-year yield at 1.05, German 10-year yield at 0.36
News & Data:
- AUD Current Account -9.6 B VS -7.9 B expected
- AUD Cash Rate 1.50 % vs 1.50 % expected
- EUR Spanish Unemployment Change 46.4 K vs 16.6 K expected
- GBP Construction PMI 51.1 vs 52.1 expected
- GBP BRC Retail Sales Monitor y/y 1.3 % vs 0.9 % previous
- ICO crackdown may just be the start: China is reportedly planning tighter cryptocurrency rules – CNBC
- U.S. gasoline prices slip as oil industry bounces back from Harvey – RTRS
Markets Update:
Asian equity was mixed early on Tuesday despite positive Caixin services PMI as global investors stuck to safe haven assets and continued to remain cautious on worries about North Korea. The Japanese yen and gold extended gains, and Treasuries rallied
USDJPY was a decent mover early on Tuesday and was last seen trading around 109.30. The Japanese yen rose 0.4 percent against the US dollar after jumping 0.5 percent on Monday. The Yen continues to gain on risk aversion due to Japan's net creditor nation status
AUDUSD advanced higher earlier on Tuesday after the strong Q2 data jumping as high as 0.7985, but had given most of its gain back almost immediately before recovering again post RBA Announcement. The Australian dollar is currently seen trading at 0.7963 against the US Dollar with a net gain of 0.2 percent
EURUSD has moved a little higher in the session currently trading at 1.1907 following a quiet session due to US holiday. The euro has gained 0.1 percent against the US dollar continuing it’s gains after advancing 0.3 percent on Monday. The Dollar Index slipped 0.15 percent and currently trading at 92.50.
Upcoming Events:
- 07:15 GMT – (CHF) CPI m/m
- 08:30 GMT – (GBP) Services PMI
- 09:10 GMT – (AUD) RBA Gov Lowe Speaks
- 12:00 GMT – (USD) FOMC Member Brainard Speaks
- 14:00 GMT – (USD) Factory Orders m/m
- 17:10 GMT – (USD) FOMC Member Kashkari Speaks
- 22:05 GMT – (USD) FOMC Member Kaplan Speaks
Daily Technical Outlook And Review: EUR/USD, GBP/USD, AUD/USD, USD/JPY, USD/CAD, USD/CHF, DOW 30, GOLD
A note on lower timeframe confirming price action...
Waiting for lower timeframe confirmation is our main tool to confirm strength within higher timeframe zones, and has really been the key to our trading success. It takes a little time to understand the subtle nuances, however, as each trade is never the same, but once you master the rhythm so to speak, you will be saved from countless unnecessary losing trades. The following is a list of what we look for:
- A break/retest of supply or demand dependent on which way you're trading.
- A trendline break/retest.
- Buying/selling tails ... essentially we look for a cluster of very obvious spikes off of lower timeframe support and resistance levels within the higher timeframe zone.
- Candlestick patterns. We tend to only stick with pin bars and engulfing bars as these have proven to be the most effective.
We typically search for lower-timeframe confirmation between the M15 and H1 timeframes, since most of our higher-timeframe areas begin with the H4. Stops are usually placed 1-3 pips beyond confirming structures.
EUR/USD
Weekly gain/loss: – 58 pips
Weekly closing price: 1.1861
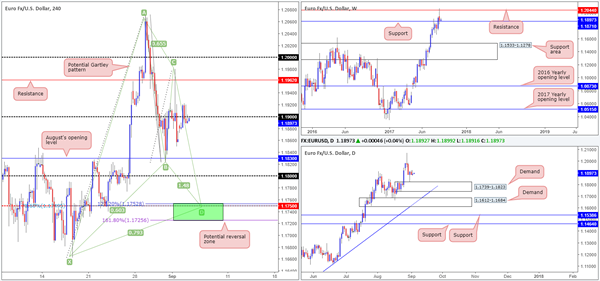
After seeing the EUR/USD shake hands with the weekly resistance level at 1.2044, a strong succession of sell orders reigned over this market last week. As a result of this, the week ended with price marginally closing beyond weekly support pegged at 1.1871. Inversely, we also saw the USDX weekly support at 11854 hold firm and print a weekly indecision candle going into the close. Although a close has been seen below support on the EUR, it may be worth waiting for the piece to print a somewhat deeper move beyond this line before presuming that all bids are consumed here.
Down on the daily timeframe, we can see that demand at 1.1739-1.1823 came into play on Thursday (USDX daily supply also came into view on Thursday at 11969-11938). A violation of this area could send the unit down to a demand positioned at 1.1612-1.1684, which happens to fuse nicely with a trendline support fixed from the low 1.0839.
On Friday, the H4 candles moved aggressively higher in the immediate aftermath of a soft US job’s report. However, despite this, the pair was unable to sustain gains beyond resistance at 1.1962, and ended the day closing back below the 1.19 handle.
Suggestions: Apart from breaching the 1.19 handle, H4 price also opened up the trapdoor for the major to challenge August’s opening level seen nearby at 1.1830, followed closely by the 1.18 boundary. Technically speaking though, our desk has absolutely no interest in these levels, as lurking just below is a H4 Harmonic Gartley reversal zone (PRZ) marked in green at 1.1725/1.1752. Not only does this area boast a H4 mid-level support at 1.1750 and a 161.8% H4 Fib ext. point at 1.1725 (taken from the high1.2070), it is also located around the lower limits of the daily demand mentioned above at 1.1739-1.1823.
As far as we see things, there are two options here:
Place a pending order at 1.1750 and position the stop below the X point of the Harmonic formation at 1.1660.
Wait for H4 price to connect with the PRZ and let the H4 candles prove buyer intent. Personally, we look for at least a full, or near-full-bodied bullish to materialize before pulling the trigger. Should this come to fruition, stops can either be placed beyond the candle’s tail (aggressive), or a few pips outside of the PRZ.
Data points to consider: No high-impacting news events on the docket today (US banks are closed in observance of Labor Day).
Levels to watch/live orders:
- Buys: 1.1725/1.1752 ([waiting for a reasonably sized H4 bullish candle to form – preferably a full, or near-full-bodied candle – is advised] stop loss: ideally beyond the candle’s tail).
- Sells: Flat (stop loss: N/A).
GBP/USD
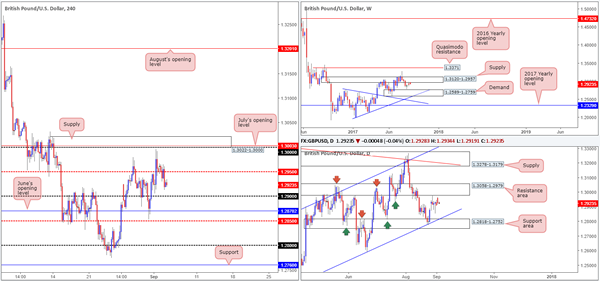
Shortly after the market opened, GBP/USD bulls managed to find a temporary foothold around the H4 mid-level support at 1.2950. As you can probably see though, this was relatively short lived as the British pound came under pressure during yesterday’s American session and ended the day clocking a low of 1.2912.
From the weekly timeframe, we can see that price remains teasing the underside of a supply base coming in at 1.3120-1.2957. Should the USDX weekly support at 11854 continue to bid prices higher this week, this could bolster weekly sellers from the current supply zone, and eventually send the unit back down to demand penciled in at 1.2589-1.2759. In conjunction with the weekly timeframe, daily price recently connected with a resistance area at 1.3058-1.2979 which has, so far, done a superb job in holding back the bulls. Given its strong history dating back to mid-May, we feel this zone will continue to provide resistance and ultimately push cable down to the support area seen below at 1.2818-1.2752 that converges with a channel support line taken from the low 1.2365.
Suggestions: At current price, we do not see much to hang our hat on as far as trading setups go. Despite this, we still have a keen interest in trading from 1.30. Not only because it is a large psychological level that the majority of the market is likely watching and is positioned within both of the said higher-timeframe resistances, but also due to it converging with a H4 supply at 1.3022-1.3000 and July’s opening level at 1.3003.
Watch for H4 price to challenge the noted H4 supply. In the event that the market prints a reasonably sized full, or near-full-bodied H4 bearish candle from this region, a sell from here is valid, in our opinion.
Data points to consider: UK Services PMI at 9.30am. FOMC members Brainard (1pm), Kashkari (6.10pm) and Kaplan (11.05pm GMT+1) all take the stage today.
Levels to watch/live orders:
- Buys: Flat (stop loss: N/A).
- Sells: 1.3022-1.3000 ([waiting for a reasonably sized H4 bearish candle to form – preferably a full, or near-full-bodied candle – is advised] stop loss: ideally beyond the candle’s wick).
AUD/USD:
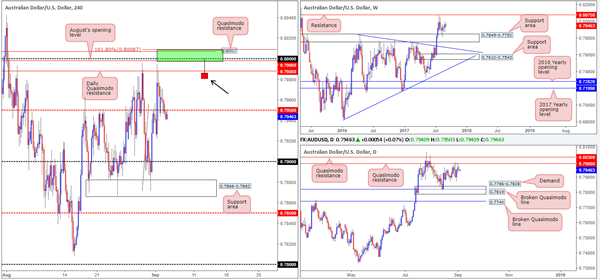
The AUD/USD started the week at 0.7947, slightly lower than Friday’s close at 0.7963. The commodity currency found early support from the H4 mid-level support at 0.7950 and, as you can see, swiftly filled the weekend gap. It was from here though that things turned sour for the bulls, with the pair eventually seen closing beyond 0.7950. Apart from this though, there was little change to the market’s structure on Monday.
Since weekly price linked with the support area at 0.7849-0.7752 three weeks ago, the unit has remained reasonably well-bid. The next objective, assuming that price continues to push north, can be seen around resistance drawn from 0.8075. Before weekly action can reach the noted resistance, however, it may be worth noting that daily price must first consume both Quasimodo resistances seen at 0.7980/0.8030.
Although the current daily Quasimodo resistance at 0.7980 could potentially drag the pair lower today, we still really like the look of the large psychological level planted just above it at 0.80, due to the following converging structures:
August’s opening level at 0.7998.
A H4 Quasimodo resistance level at 0.8007.
A H4 161.8% Fib ext. point at 0.8008.
Suggestions: A short from the green H4 sell zone is, in our technical opinion, appealing, given its confluence. Still, to trade this area, we would ideally want to see H4 price whipsaw through the current daily Quasimodo resistance and test the zone in the shape of a pin bar, and ultimately close on/near its low (as drawn on the H4 chart). The reason we require this candle confirmation is due to both the risk of a fakeout being seen up to the daily Quasimodo resistance at 0.8030, and weekly price currently showing room to extend up to weekly resistance at 0.8075.
Data points to consider: Reserve Bank of Australia policy decision at 5.30am and RBA Gov. Lowe speaks at 10.10am. FOMC members Brainard (1pm), Kashkari (6.10pm) and Kaplan (11.05pm GMT+1) all take the stage today.
Levels to watch/live orders:
- Buys: Flat (stop loss: N/A).
- Sells: 0.8008/0.7998 ([ideally we want to see price whipsaw through the current daily Quasimodo resistance and test the zone in the shape of a H4 bearish pin bar] stop loss: either beyond the candle’s wick or above 0.8008).
USD/JPY
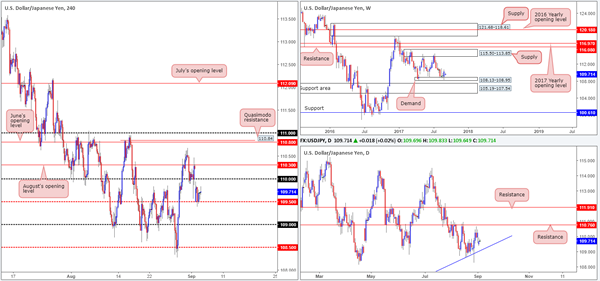
USD/JPY opened the week sporting a rather substantial gap south in response to a nuke test by North Korea. The pair, however, found a floor of support at 109.50 following this move and then proceeded to enter into a phase of consolidation as US banks were closed in observance of Labor Day.
Looking over to the weekly timeframe, we can see that USD/JPY bulls went on the offensive from weekly demand at 108.13-108.95 last week and printed a strong-looking weekly bullish engulfing candle. The move from this area could encourage further buying this week and propel the unit up to within striking distance of a supply area formed at 115.50-113.85. Over on the daily timeframe, however, the buyers and sellers are seen trading mid-range between a resistance level pegged at 110.76 and a trendline support extended from the low 100.08.
Suggestions: At current price, we see very little to hang our hat on as far as technical setups go. Entering long, as the weekly timeframe suggests, would place you in direct conflict with the 110 handle, followed closely by August’s opening level at 110.30. Similarly, a sell beyond 109.50 would position one against potential buyers from the aforementioned daily trendline support.
Given the above structure, remaining on the sidelines may be the best course of action today.
Data points to consider: FOMC members Brainard (1pm), Kashkari (6.10pm) and Kaplan (11.05pm GMT+1) all take the stage today.
Levels to watch/live orders:
- Buys: Flat (stop loss: N/A).
- Sells: Flat (stop loss: N/A).
USD/CAD
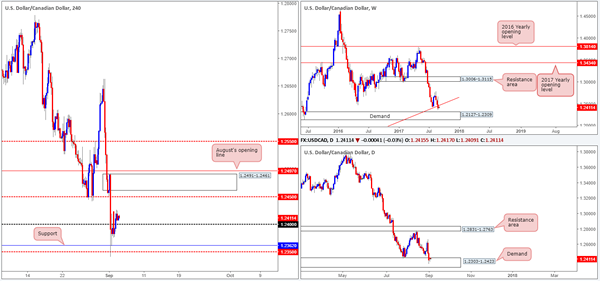
Trade was quiet on Monday as US and Canadian banks were closed in observance of Labor Day. After breaking above the 1.24 handle in early (London) trading, price entered into a tight consolidation of around 20 or so pips. Given this somewhat lackluster performance, much of the following report will have a similar bias to Monday’s outlook…
The USD/CAD managed to retain its offered tone last week, after weekly price hammered its way through a long-term weekly trendline support extended from the low 0.9633. Technically speaking, this has likely set the stage for further selling this week at least until we reach weekly demand penciled in at 1.2127-1.2309. The story on the daily timeframe reveals that the bears did not make a stand until Thursday’s segment, after topping around the 1.2662 neighborhood. The drop from here, shaped by two reasonably decisive bearish candles, brought the unit into the jaws of a demand base drawn from as far back as June 2015 at 1.2303-1.2423.
Suggestions: To our way of seeing things right now, the H4 close above 1.24 has potentially confirmed upside to H4 mid-level resistance1.2450/H4 supply at 1.2491-1.2461. In addition, this move has likely confirmed strength from the current daily demand area. Still, we would not feel comfortable buying this market above 1.24 due to weekly price showing room to drive lower.
In light of the recent move above 1.24, we do not see anything of interest in this market for the time being.
Data points to consider: FOMC members Brainard (1pm), Kashkari (6.10pm) and Kaplan (11.05pm GMT+1) all take the stage today.
Levels to watch/live orders:
- Buys: Flat (stop loss: N/A).
- Sells: Flat (stop loss: N/A).
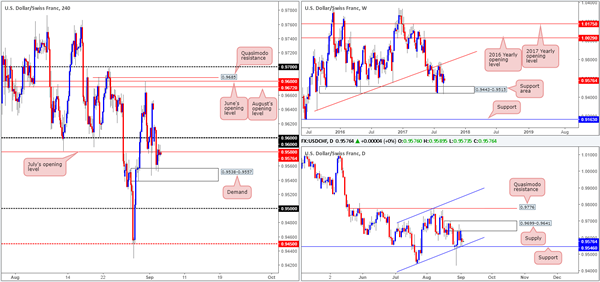
USD/CHF
News of North Korea testing a nuke over the weekend triggered a flight to safety on Monday, with opening price gapping 46 pips south. The response from the 0.96 handle was soft and thereby led to further selling amid London trading, which saw price shake hands with H4 demand marked at 0.9538-0.9557. Due to US banks being closed in observance of Labor Day, a light US trading session saw the unit consolidate losses around the top edge of the said H4 demand.
Looking over to the bigger picture, weekly price turned higher last week after crossing swords with a support area at 0.9443-0.9515. Seeing as the USDX also bounced from weekly support at 11854, dollar buying on the Swissy could lead to price retesting the trendline resistance extended from the low 0.9257. Daily price on the other hand is somewhat restricted at the moment. To the upside, we have nearby supply lodged at 0.9699-0.9641 (daily supply also seen on the USDX at 11969-11938) that held price lower on Thursday. And to the downside, there’s neighboring support marked at 0.9546, which converges nicely with a channel support line etched from the low 0.9438.
Suggestions: Owing to July’s opening level lurking directly above current price at 0.9580, followed closely by the 0.96 handle, entering long is out of the question until we break above these levels. Unfortunately, even with this break we still have only 40 or so pips to play with before we reach the underside of the daily supply base!
Similarly, a sell beyond the current H4 demand leaves one less than 40 pips of room until the 0.95 handle. This – coupled with the prospect of daily buying from support at 0.9546 makes a sell just as challenging as trying to buy this market. Therefore, opting to remain on the sidelines here may very well be the best path to take today.
Data points to consider: FOMC members Brainard (1pm), Kashkari (6.10pm) and Kaplan (11.05pm GMT+1) all take the stage today.
Levels to watch/live orders:
- Buys: Flat (stop loss: N/A).
- Sells: Flat (stop loss: N/A).
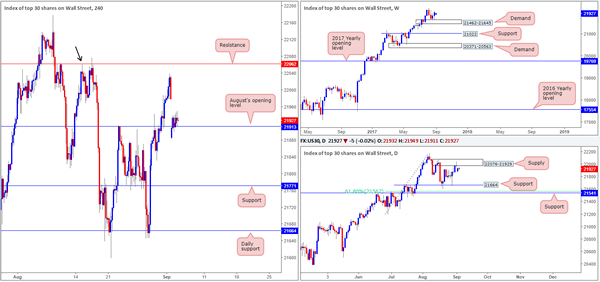
DOW 30
US shares were down 91 points on Monday morning following North Korea’s latest nuke test. Despite this, H4 price found immediate refuge around August’s opening level formed at 21913 and remained bolstered from here throughout the remainder of the day, as US banks were closed in observance of Labor Day.
Bouncing over to the weekly picture, as mentioned in Monday’s report, the index extended its bounce from weekly demand at 21462-21645 last week, finishing near its highs. With little overhead resistance to contend with on the weekly timeframe, a fresh record high could be achieved this week! Conversely, however, daily flow recently crossed paths with supply at 22076-21929, and chalked up a nice-looking selling wick into the week’s end. While this supply boasts strong momentum and could send the index lower this week, let’s keep in mind where weekly price is trading from!
Our suggestions: With a clear difference of opinion currently being seen on the higher timeframes (see above), traders are in a somewhat precarious position right now. A long from August’s opening level is high-probability according to the weekly scale, but ill-advised from a daily perspective. A sell below this monthly level on the other hand looks appealing from the daily timeframe, but chancy on the weekly timeframe!
Given the above factors, our team will remain on the sidelines for the time being.
Data points to consider: FOMC members Brainard (1pm), Kashkari (6.10pm) and Kaplan (11.05pm GMT+1) all take the stage today.
Levels to watch/live orders:
- Buys: Flat (stop loss: N/A).
- Sells: Flat (stop loss: N/A).
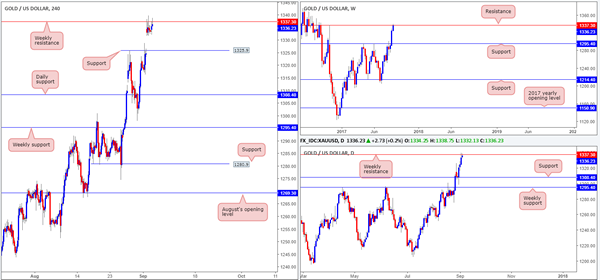
GOLD
Safe-haven assets, including that of the precious metal, advanced on Monday with opening price aggressively gapping north up to weekly resistance at 1337.3. The move came in response to recent nuke tests from North Korea.
With price seen trading from a weekly resistance at the moment, our immediate thoughts are to fade gold as the weekly level has been in play since mid-2013. However, given that the approach to the level was incredibly strong, it may be prudent to wait for additional confirmation before pulling the trigger. Usually, we would be looking at the H4 candles for evidence of seller intent. However, due to this level being set on the weekly scale, the team has opted to wait for confirmation on the daily timeframe instead.
Our suggestions: A daily bearish candle formed from the current weekly resistance in the shape of a full, or near-full-bodied candle would, in our view, be enough to validate a short, targeting daily support at 1308.4. Nevertheless, a H4 close beyond H4 support at 1325.9 could be used as a worthy trigger to reduce risk to breakeven.
Levels to watch/live orders:
- Buys: Flat (stop loss: N/A).
- Sells: 1337.3 region ([waiting for a daily bearish candle to form in the shape of a full, or near-full-bodied candle is advised] stop loss: ideally beyond the candle’s wick).
Daily Technical Analysis: GBP/USD Will Soon Start Impulsive Wave C Pattern
Currency pair GBP/USD
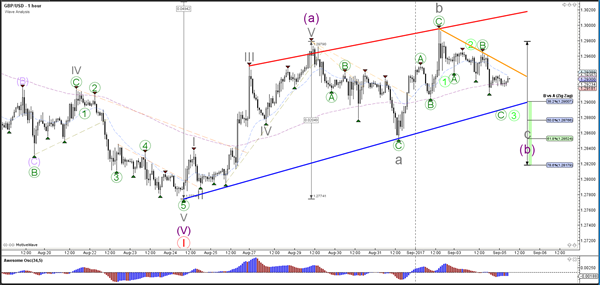
The GBP/USD is building a corrective bullish channel (red/blue lines). The bullish price action is probably part of a wave 2 pattern (red). A break above the resistance (orange) could see price start an impulsive wave C (purple), which challenges the top of the channel as it expands the ABC correction (purple).
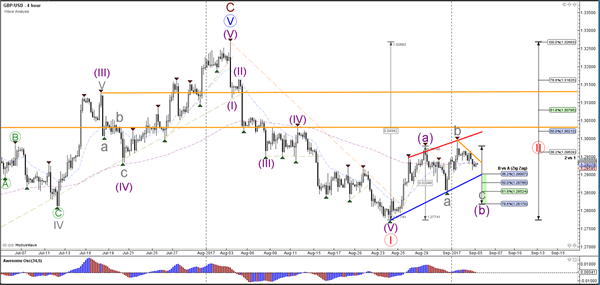
The GBP/USD is building a bearish correction within the bullish channel which could find support at the Fibonacci levels of wave B vs A. The wave B (purple) is most likely seeing an extension after a clear 5 wave up as wave A (purple). Once wave B is completed, a 5 wave pattern for a wave C is expected.
Currency pair EUR/USD
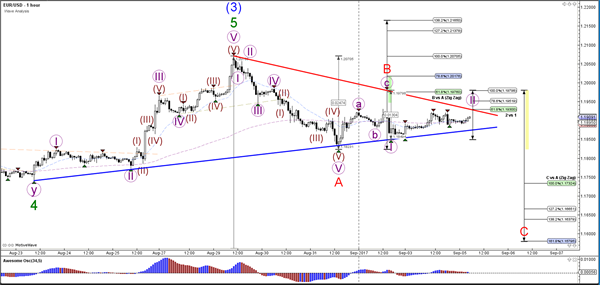
The EUR/USD is still in a corrective chart pattern, which is indicated by the trend lines (blue/red). A break below the support trend line (blue) could confirm a potential ABC correction (red). The ABC correction (red) is invalidated if price breaks above the 138.2% Fib at 1.2165. A break above the resistance trend line (red) could indicate that there is bullish pressure to test the Fib levels of wave B vs A.
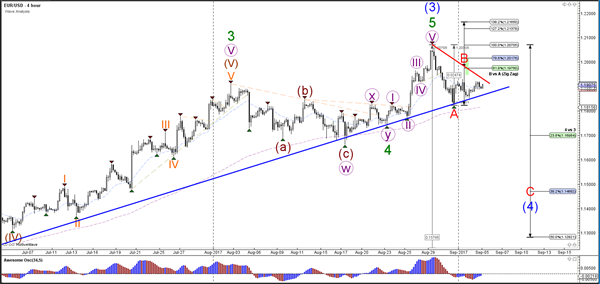
The EUR/USD could be building a potential wave 1 and 2 (purple) within wave C (red) and test the Fibonacci levels of wave 2 vs 1 (purple). A break above the 100% Fib level at 1.1980 invalidates it and could indicate that price will challenge higher Fib levels of wave B vs A.
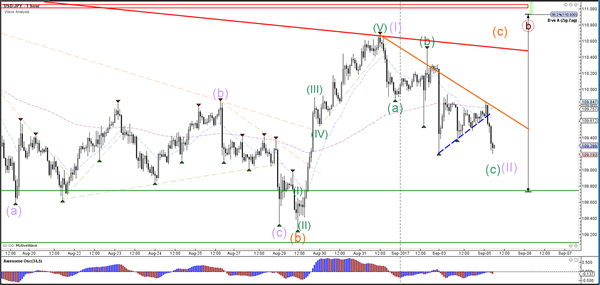
Currency pair USD/JPY
The USD/JPY is close to challenging the support zone (green) again which is a bounce or break spot. A bearish break below the zone indicates a downtrend whereas a bounce could indicate a continuation of wave B (brown).
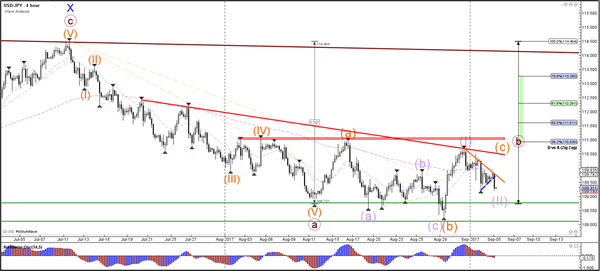
The USD/JPY broke the support trend line (dotted blue) but this could potentially complete the wave C (green), which is confirmed if price manages to break above the resistance trend line (orange).
Reserve Bank Of Australia Left Its Key Interest Rate Unchanged
For the 24 hours to 23:00 GMT, the AUD declined 0.2% against the USD and closed at 0.7947.
LME Copper prices rose 1.4% or $97.0/MT to $6873.0/MT. Aluminium prices declined 0.9% or $18.0/MT to $2095.5/MT.
In the Asian session, at GMT0300, the pair is trading at 0.7965, with the AUD trading 0.23% higher against the USD from yesterday's close.
Earlier in the session, the Reserve Bank of Australia (RBA), at its latest monetary policy meeting, opted to leave its benchmark interest rate steady at a record low of 1.50%, as widely expected.
Overnight data revealed that Australia's AiG performance of services index eased to a level of 53.0 in August. The index had recorded a reading of 56.4 in the prior month. Further, the nation's seasonally adjusted current account deficit widened more-than-anticipated to a level of A$9.6 billion in the second quarter of 2017, following a revised deficit of A$4.8 billion in the prior quarter.
Elsewhere in China, Australia's largest trading partner, the Caixin services PMI index rose to a level of 52.7 in August, expanding by the most in three months and following a reading of 51.5 in the prior month.
The pair is expected to find support at 0.7943, and a fall through could take it to the next support level of 0.7922. The pair is expected to find its first resistance at 0.7985, and a rise through could take it to the next resistance level of 0.8006.
Looking ahead, traders will closely monitor Australia's 2Q GDP data, scheduled to release in the early hours of tomorrow.
The currency pair is trading above its 20 Hr and 50 Hr moving averages.

Euro-Zone’s Investor Morale Unexpectedly Strengthened In September
For the 24 hours to 23:00 GMT, the EUR rose 0.12% against the USD and closed at 1.1896, after the Euro-zone's Sentix investor confidence index surprisingly advanced to a level of 28.2 in September, confounding market expectations for a fall to a level of 27.0, suggesting that investors brushed-off recent strength in the Euro and acknowledged the economic rebound in the common currency region. The index had recorded a level of 27.7 in the prior month.
Meanwhile, the region's producer price index (PPI) grew less-than-expected by 2.0% YoY in July, compared to a revised rise of 2.4% in the prior month.
In the Asian session, at GMT0300, the pair is trading at 1.1906, with the EUR trading 0.08% higher against the USD from yesterday's close.
The pair is expected to find support at 1.1882, and a fall through could take it to the next support level of 1.1858. The pair is expected to find its first resistance at 1.1926, and a rise through could take it to the next resistance level of 1.1946.
Going ahead, investors will look forward to the final Markit services PMIs for August across the Euro-zone along with the region's retail sales data for July, scheduled to release in a few hours. Additionally, in the US, final durable goods orders and factory orders, both for July, scheduled to release later today, will be on investors' radar.
The currency pair is showing convergence with its 20 Hr and 50 Hr moving averages.

UK’s Construction Sector Growth Eased To Its Lowest Level In A Year In August
For the 24 hours to 23:00 GMT, the GBP declined 0.26% against the USD and closed at 1.2927, following downbeat construction sector data in the UK.
Data showed that Britain's Markit construction PMI unexpectedly eased to one-year low level of 51.1 in August, pressured by an investment slump in the commercial sector. Markets were expecting the PMI to advance to a level of 52.0, compared to a level of 51.9 in the previous month.
In the Asian session, at GMT0300, the pair is trading at 1.2926, with the GBP trading a tad lower against the USD from yesterday's close.
Overnight data showed that the nation's BRC retail sales across all sectors advanced 1.3% on an annual basis in August. In the prior month, retail sales across all sectors had recorded a rise of 0.9%.
The pair is expected to find support at 1.2904, and a fall through could take it to the next support level of 1.2883. The pair is expected to find its first resistance at 1.2956, and a rise through could take it to the next resistance level of 1.2987.
Trading trends in the Pound today is expected to be determined by the release of Britain's Markit services PMI for August, due to release in a few hours.
The currency pair is trading below its 20 Hr and 50 Hr moving averages.

Japanese Services Sector Grew At Its Weakest Pace In 6 Months In August
For the 24 hours to 23:00 GMT, the USD marginally declined against the JPY and closed at 109.69.
In the Asian session, at GMT0300, the pair is trading at 109.33, with the USD trading 0.33% lower against the JPY from yesterday's close.
Data released overnight showed that Japan's Nikkei services PMI dropped to a level of 51.6 in August, hitting a six-month low level and dampening optimism over the state of the nation's services sector. The PMI had registered a level of 52.0 in the previous month.
The pair is expected to find support at 109.11, and a fall through could take it to the next support level of 108.88. The pair is expected to find its first resistance at 109.70, and a rise through could take it to the next resistance level of 110.06.
The currency pair is trading below its 20 Hr and 50 Hr moving averages.
