Sample Category Title
Swiss Franc Trading Higher, Ahead Of Key Economic Releases In Switzerland
For the 24 hours to 23:00 GMT, the USD declined 0.28% against the CHF and closed at 0.9583.
The Swiss Franc gained ground against the USD, as heightened tensions between North Korea and the US stoked demand for safe-haven currency.
In economic news, Switzerland’s total sight deposits inched down to a level of CHF579.2 billion in the week ended 01 September, compared to a level of CHF579.8 billion in the previous week.
In the Asian session, at GMT0300, the pair is trading at 0.9555, with the USD trading 0.29% lower against the CHF from yesterday’s close.
The pair is expected to find support at 0.9534, and a fall through could take it to the next support level of 0.9512. The pair is expected to find its first resistance at 0.9595, and a rise through could take it to the next resistance level of 0.9634.
Ahead in the day, all eyes will be on Switzerland’s 2Q GDP and consumer price inflation data for August.
The currency pair is showing convergence with its 20 Hr moving average and trading below its 50 Hr moving average.

Loonie Trading Higher This Morning
For the 24 hours to 23:00 GMT, the USD rose 0.23% against the CAD and closed at 1.2412.
In the Asian session, at GMT0300, the pair is trading at 1.24, with the USD trading 0.1% lower against the CAD from yesterday’s close.
The pair is expected to find support at 1.2379, and a fall through could take it to the next support level of 1.2357. The pair is expected to find its first resistance at 1.2424, and a rise through could take it to the next resistance level of 1.2447.
With no macroeconomic releases in Canada today, investors will focus on global macroeconomic events for further direction.
The currency pair is trading below its 20 Hr and 50 Hr moving averages.

Daily Technical Analysis: EURUSD, GBPUSD, USDJPY, USDCHF
EURUSD
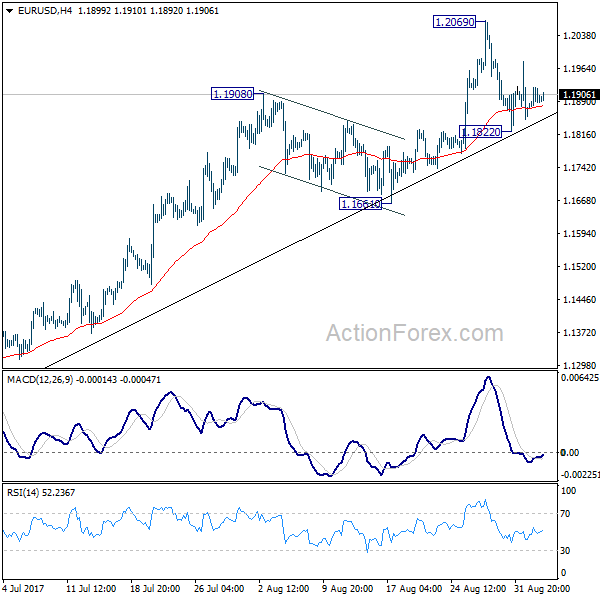
The EURUSD didn't make significant movement yesterday. The bias remains neutral in nearest term. Overall I remain bullish and price is still moving above the EMA 200 as you can see on my H4 chart below but as long as stay below 1.2000 the pair is still in a bearish correction phase with key support seen at 1.1823. A clear break below that area would continue the bearish correction testing 1.1750 – 1.1700 area. On the upside, we need a clear break at least above 1.2000 to potentially end the current bearish correction phase targeting 1.2175 region.
GBPUSD
The GBPUSD didn't make significant movement yesterday and still trapped between 1.2980 – 1.2870 range area as you can see on my daily chart below. There are no changes in my technical outlook. The bias remains neutral in nearest term and we need a clear break from that range area to see clearer direction. A clear break and daily close above 1.2980 could trigger further bullish pressure testing 1.3030 before targeting 1.3125 region. On the other hand, a clear break and daily close below 1.2870 would expose 1.2700 area or lower. Overall I remain neutral.
USDJPY
The USDJPY didn't make significant movement yesterday but traded lower earlier today in Asian session hit 109.20. The bias is bearish in nearest term testing 108.70 key support. A clear break and daily close below that area could trigger further bearish pressure testing 108.00 – 107.50 area as nearest bearish target. Immediate resistance is seen around 109.83 (current high). A clear break above that area could lead price to neutral zone in nearest term as direction would become unclear. Overall I remain neutral.
USDCHF
The USDCHF didn't make significant movement yesterday. The bias remains neutral in nearest term probably with a little bearish bias testing 0.9525 support area. A clear break below that area could trigger further bearish pressure retesting 0.9450 key support which is a good place to buy with a tight stop loss. Immediate resistance is seen around 0.9589 (current high). A clear break above that area could trigger further bullish pressure testing 0.9650 – 0.9700 region. I still prefer to stand aside.
Elliott Wave View: Gold 5 Waves Up
Elliott Wave View: Gold 5 Waves Up
Gold Short Term Elliott Wave suggests that the rally from 8/15 low is unfolding as a zigzag. The first leg Minor wave A is subdivided as an impulse. Minute wave ((i)) of A ended at 1300.83, Minute wave ((ii)) of A ended at 1274.45, Minute wave ((iii)) of A ended at 1326, and Minute wave ((iv)) of A ended at 1297.52. Minute wave ((v)) of A is currently in progress and also subdivided as an impulse.
Minutte wave (i) of ((v)) ended at 1323.63, Minutte wave (ii) of ((v)) ended at 1316.3, and Minutte wave (iii) of ((v)) ended at 1339.77. Gold is currently in Minutte wave (iv) of ((v)) pullback before another leg higher to complete Minor wave A. Afterwards, Gold should pullback in Minor wave B to correct cycle from 8/15 low before the rally resumes. We don’t like selling Gold and expect buyers to appear once wave B pullback is over in 3, 7, or 11 swing as far as pivot at 8/15 low (1267.21) stays intact.
Gold 1 Hour Elliott Wave Chart
Is Gold’s Breakout Sustainable?
Key Points:
- Price action rallies as geopolitical risk in North Korea increases.
- RSI Oscillator strongly overbought.
- Watch for a period of moderation before the rally recommences.
The past few weeks have proved to be a relatively large boon for Gold markets as increased geopolitical risk, as well as slipping U.S. centric economic data, has seen the precious metal assail the $1300 handle to trade around the present $1336 an ounce mark. However, the question remains as to whether the current valuation will hold in the coming weeks given that the oscillators are currently strongly overbought.
In particular, the RSI Oscillator is presently providing some cause for concern given that the metric is indicating relatively strong overbought levels. Additionally, price action is now nearing a key swing point from last year's Gold flash crash around the $1337.34 mark. This was a key level back in November 2016 and should prove to be relatively interesting in the days ahead.
Much of the rapid upward momentum in Gold prices has been largely to do with rising geopolitical risk in North Korea. Presently, there appears to be no end in sight with the potential for armed confrontation growing as neither Trump nor Kim Jong Un appear willing or able to back away from the precipice. Subsequently, this situational conundrum bodes well for the precious metal which is typically seen as a safe haven especially when the risk of flying missiles is on the increase.
In addition, the metal has been buoyed by successive rounds of disappointing data emanating from the U.S. and a central bank that appears schizophrenic in their approach to monetary policy. In fact, a range of misses within labour market and slipping GDP estimates have proved highly bullish for the metal over the past few weeks. This has led to a significant pullback in the U.S. Dollar Index and the valuation of the greenback.
Ultimately, the technical perspective argues for a short term pullback or period of moderation given the highly overbought oscillator levels. However, fundamentals are largely driving the metals current trend and these factors remain highly biased to the upside. Subsequently, the most likely scenario is one where Gold turns sideways for a period of moderation before recommencing its run higher. The reality is that Gold prices have turned the corner and that the time for a recoupling between prices and the M2 figures is long overdue.
Yen Firm But Lacks Follow Through Buying, RBA Stands Pat
The Japan yen remains firm across the board on mild risk aversion. It's reported that North Korea is quietly moving another intercontinental ballistic missile towards its west coast, readying for another launch by the end of the week. But market reaction is relatively muted. There is no follow through buying seen in neither Yen or Swiss Franc. With the exception of USD/CAD, most pairs are still bounded in familiar range as consolidations continue. Aussie strengthens mildly after RBA stands pat, but similar to most others, AUD/USD is stuck in range trading for the moment. In other markets, Nikkei trades in red again today and is down -0.5% at the time of writing. Gold stays firm at around 1340/5 and could take on 1350 handle later in the week. WTI crude oil is mildly higher but struggles to get rid of 55 day EMA at 47.5.
RBA stands pat, no new information revealed
RBA left the cash rate unchanged as widely expected. And so far, the announcement feels like a non-event, with no new information revealed. RBA reiterates in the accompanying statement that "Australian economy will gradually pick up over the coming year". Employment growth has been "stronger over the recent month" and unemployment rate is expected to "decline a little over the next couple of years." Nonetheless, "wage growth remains low" and is "likely to continue for a while". Inflation remains low and is expected to "pick up gradually as the economy strengthens." Appreciation of Aussie " is expected to contribute to the subdued price pressures in the economy."
Trump agrees to sell many billions of dollars of weapons to South Korea
Following up to North Korea's latest larger than ever nuclear test, South Korea continued with its military drills today, with live-fire exercise conducted at sea. Accord to a White House statement, US President Donald Trump and South Korea President Moon Jae-In "agreed to maximize pressure on North Korea using all means at their disposal." And Trump "provided his conceptual approval" to sell "many billions of dollars' worth of military weapons and equipment" to South Korea.
United Nations Security Council held the second emergency meeting in a week about North Korea yesterday. In the meeting, US Ambassador Nikki Haley said that North Korea leader Kim Jong-Un is "begging for war". She emphasized that "war is never something that the United States wants". But "our country's patience is not unlimited". US will circulate the new draft sanctions on North Korea and will push the UNSC to vote on them on September 11.
It's reported that some form of oil embargo is an option that the UNSC is considering. However, an adviser to China's cabinet and international relations professor at Renmin University in Beijing, Shi Yinhong commented that "a temporary or partial ban is possible, but the Chinese government will definitely refuse to cut off oil exports completely or permanently to North Korea." He emphasized that "if China agreed to cut off oil exports completely, China would use all its tools but not achieve any purpose, and the consequence could be costly."
David Ramsden joined BoE as Deputy Government
In UK, David Ramsden joined BoE yesterday as Deputy Governor for markets. He will also be a member of the Monetary Policy Committee, Financial Policy Committee and Prudential Regulation Committee as well as Court of the Bank of England. Ramsden was the chief economic advisor in the Treasury Department since 2008 and served the department since 1988. At this point, analysts general don't expect Ramsden to join the hawks in the MPC, Michael Saunders and Ian McCafferty, to vote for rate hike in upcoming meetings.
On the data front
Australia current account deficit widened to AUD -9.6b in Q2. New Zealand ANZ commodity price dropped -0.8% in August. China Caixin PMI services rose to 52.7 in August. Swiss will release GDP and CPI in European session. Eurozone will also release PMI services revision. But the main market mover would be UK PMI services. US will come back from holiday and release factory orders later in the day.
AUD/USD Daily Outlook
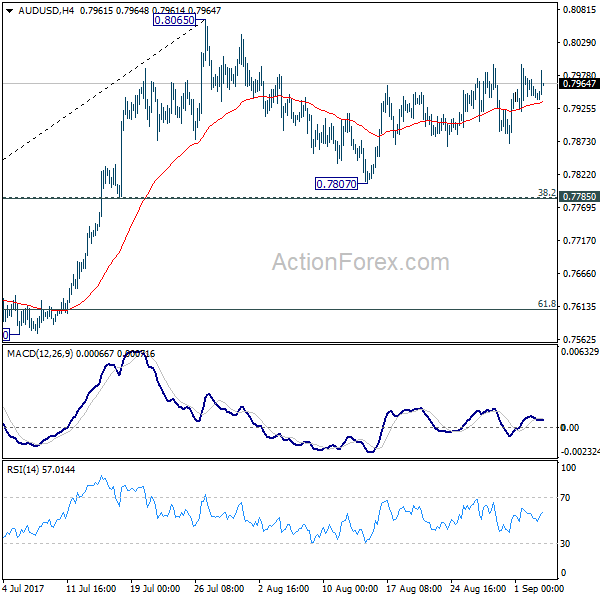
Daily Pivots: (S1) 0.7932; (P) 0.7952; (R1) 0.7963; More...
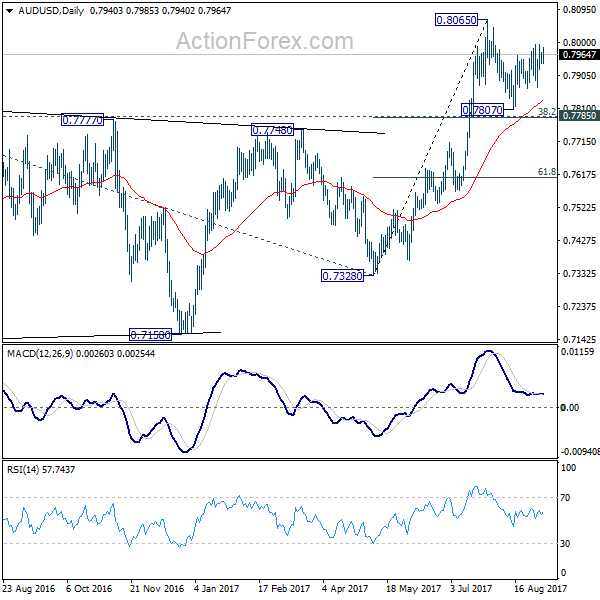
AUD/USD is still bounded in consolidation from 0.8065 and intraday bias remains neutral first. In case of another fall, downside should be contained by 0.7785 cluster support (38.2% retracement of 0.7328 to 0.8065 at 0.7783) to bring rebound. On the upside, break of 0.8065 will resume the medium term rise and target 100% projection of 0.6826 to 0.7833 from 0.7328 at 0.8335.
In the bigger picture, rise from 0.6826 medium term bottom is still in progress. At this point, there is no confirmation of trend reversal yet and we'll continue to treat such rebound as a corrective pattern. But in any case, break of 55 month EMA (now at 0.8087) will target 38.2% retracement of 1.1079 to 0.6826 at 0.8451. Break of 0.7328 support is needed to confirm completion of the rebound. Otherwise, further rise is now in favor.
Economic Indicators Update
| GMT | Ccy | Events | Actual | Forecast | Previous | Revised |
|---|---|---|---|---|---|---|
| 1:00 | NZD | ANZ Commodity Price Aug | -0.80% | -0.80% | ||
| 1:30 | AUD | Current Account Balance (AUD) Q2 | -9.6B | -7.4B | -3.1B | -4.8B |
| 1:45 | CNY | Caixin PMI Services Aug | 52.7 | 51.8 | 51.5 | |
| 4:30 | AUD | RBA Rate Decision | 1.50% | 1.50% | 1.50% | |
| 5:45 | CHF | GDP Q/Q Q2 | 0.50% | 0.30% | ||
| 5:45 | CHF | GDP Y/Y Q2 | 1.00% | 1.10% | ||
| 7:15 | CHF | CPI M/M Aug | 0.00% | -0.30% | ||
| 7:15 | CHF | CPI Y/Y Aug | 0.50% | 0.30% | ||
| 7:45 | EUR | Italy Services PMI Aug | 55.5 | 56.3 | ||
| 7:50 | EUR | France Services PMI Aug F | 55.5 | 55.5 | ||
| 7:55 | EUR | Germany Services PMI Aug F | 53.4 | 53.4 | ||
| 8:00 | EUR | Eurozone Services PMI Aug F | 54.9 | 54.9 | ||
| 8:30 | GBP | Services PMI Aug | 53.5 | 53.8 | ||
| 9:00 | EUR | Eurozone Retail Sales M/M Jul | -0.30% | 0.50% | ||
| 14:00 | USD | Factory Orders Jul | -3.30% | 3.00% |
North Asian Region Tensions Escalate
All Eyes On North Korea. Pyongyang’s missile launch over the weekend continued to keep market participants on edge, waiting to see whether tensions will escalate or if a diplomatic approach would be pursued. Meanwhile, South Korean President Moon Jae-in agreed with Trump in terms of stepping up their efforts to get North Korea to back down. In particular, the two leaders agreed to let South Korea fill its missiles with heavier warheads in case an actual strike does happen. Heightened geopolitical tension will probably bring a negative impact to the region’s economic growth, with tourism and the hospitality sector potentially impacted.
Safe Havens Continue Gaining Demand. Escalating tension in the North Asian region scared away many investors and triggered broad sell-offs in riskier assets on Monday. Risk-off vibes continued throughout the day as the lack of any other major updates kept the safe-havens ahead of the pack. Safe-havens like gold, the Swiss franc and the Japanese yen continued to advance, indicating that risk aversion remains in play.
British Pound Dips. Surprisingly, the pound chalked up some last minute losses for the trading session even as there were no reports released. Some speculate that this may be due to Norway’s $1 trillion sovereign wealth fund loading up on investments in the U.K. economy, with many believing that this might be a wrong move.
Watch Out Today For:
04:30 am GMT: RBA Interest Rate Decision
09:10 pm GMT: RBA’s Governor Philip Lowe Speech
AUD/USD Daily Outlook
Daily Pivots: (S1) 0.7932; (P) 0.7952; (R1) 0.7963; More...
AUD/USD is still bounded in consolidation from 0.8065 and intraday bias remains neutral first. In case of another fall, downside should be contained by 0.7785 cluster support (38.2% retracement of 0.7328 to 0.8065 at 0.7783) to bring rebound. On the upside, break of 0.8065 will resume the medium term rise and target 100% projection of 0.6826 to 0.7833 from 0.7328 at 0.8335.
In the bigger picture, rise from 0.6826 medium term bottom is still in progress. At this point, there is no confirmation of trend reversal yet and we'll continue to treat such rebound as a corrective pattern. But in any case, break of 55 month EMA (now at 0.8087) will target 38.2% retracement of 1.1079 to 0.6826 at 0.8451. Break of 0.7328 support is needed to confirm completion of the rebound. Otherwise, further rise is now in favor.
(RBA) Statement by Philip Lowe, Governor: Monetary Policy Decision
At its meeting today, the Board decided to leave the cash rate unchanged at 1.50 per cent.
Conditions in the global economy are continuing to improve. Labour markets have tightened further and above-trend growth is expected in a number of advanced economies, although uncertainties remain. Growth in the Chinese economy is being supported by increased spending on infrastructure and property construction, with the high level of debt continuing to present a medium-term risk. Commodity prices have risen recently, although Australia's terms of trade are still expected to decline over coming years.
Wage growth remains low in most countries, as does core inflation. Headline inflation rates have declined recently, largely reflecting the earlier decline in oil prices. In the United States, the Federal Reserve expects to increase interest rates further and there is no longer an expectation of additional monetary easing in other major economies. Financial markets have been functioning effectively and volatility remains low.
The recent data have been consistent with the Bank's expectation that growth in the Australian economy will gradually pick up over the coming year. The decline in mining investment will soon run its course. The outlook for non-mining investment has improved recently and reported business conditions are at a high level. Residential construction activity remains at a high level, but little further growth is expected. Retail sales have picked up recently, although slow growth in real wages and high levels of household debt are likely to constrain future growth in spending.
Employment growth has been stronger over recent months and has increased in all states. The various forward-looking indicators point to solid growth in employment over the period ahead. The unemployment rate is expected to decline a little over the next couple of years.
Wage growth remains low. This is likely to continue for a while yet, although stronger conditions in the labour market should see some lift in wages growth over time. Inflation also remains low and is expected to pick up gradually as the economy strengthens.
The Australian dollar has appreciated over recent months, partly reflecting a lower US dollar. The higher exchange rate is expected to contribute to the subdued price pressures in the economy. It is also weighing on the outlook for output and employment. An appreciating exchange rate would be expected to result in a slower pick-up in economic activity and inflation than currently forecast.
Conditions in the housing market continue to vary considerably around the country. Housing prices have been rising briskly in some markets, although there are signs that conditions are easing, especially in Sydney. In some other markets, prices are declining. In the eastern capital cities, a considerable additional supply of apartments is scheduled to come on stream over the next couple of years. Rent increases remain low in most cities. Investors in residential property are facing higher interest rates. There has also been some tightening of credit conditions following supervisory measures to address the risks associated with high and rising levels of household indebtedness. Growth in housing debt has been outpacing the slow growth in household incomes.
The low level of interest rates is continuing to support the Australian economy. Taking account of the available information, the Board judged that holding the stance of monetary policy unchanged at this meeting would be consistent with sustainable growth in the economy and achieving the inflation target over time.
EUR/USD Daily Outlook
Daily Pivots: (S1) 1.1868; (P) 1.1895 (R1) 1.1918; More...
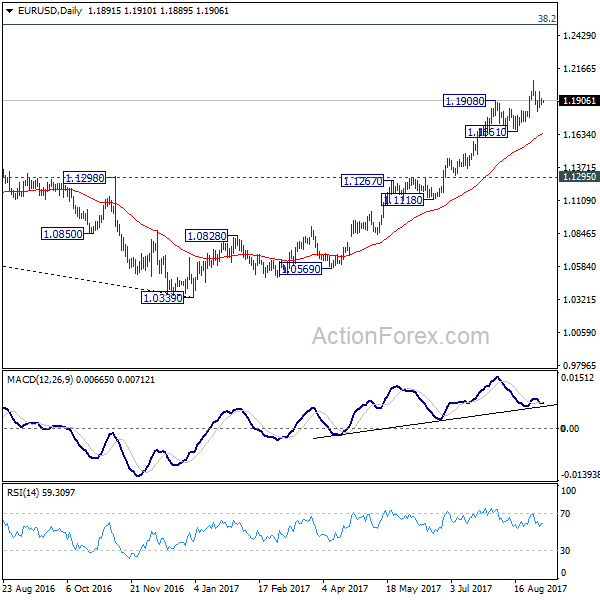
Intraday bias in EUR/USD remains neutral for the moment. Consolidation from 1.2069 might extend and below 1.1822 will bring deeper fall. But after all, there is no clear sign of trend reversal yet. Outlook will remain bullish as long as 1.1661 holds. Break of 1.2069 will extend larger rise from 1.0339 to next key fibonacci level at 1.2516. Nonetheless, break of 1.1661 will bring much lengthier consolidation first.
In the bigger picture, an important bottom was formed at 1.0339 on bullish convergence condition in weekly MACD. Sustained trading above 55 month EMA (now at 1.1774) will pave the way to key fibonacci level at 38.2% retracement of 1.6039 (2008 high) to 1.0339 (2017 low) at 1.2516. While rise from 1.0339 is strong, there is no confirmation that it's developing into a long term up trend yet. Hence, we'll be cautious on strong resistance from 1.2516 to limit upside. For now, medium term outlook will remain bullish as long as 1.1295 support holds, in case of pull back.