
Sample Category Title
EUR/USD Daily Outlook
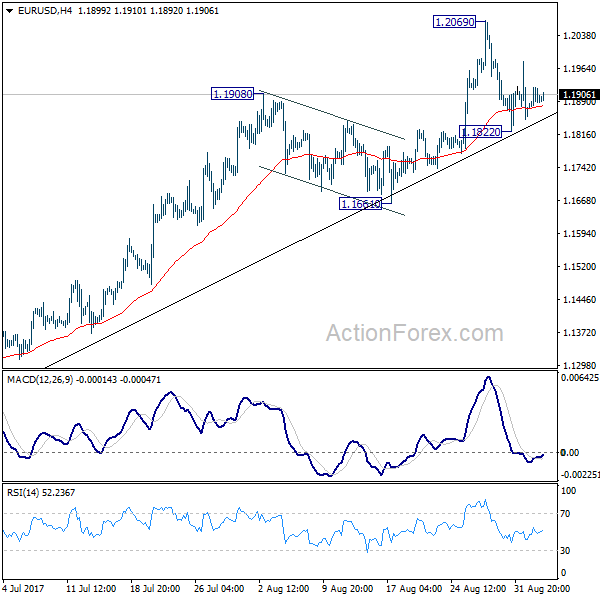
Daily Pivots: (S1) 1.1868; (P) 1.1895 (R1) 1.1918; More...
Intraday bias in EUR/USD remains neutral for the moment. Consolidation from 1.2069 might extend and below 1.1822 will bring deeper fall. But after all, there is no clear sign of trend reversal yet. Outlook will remain bullish as long as 1.1661 holds. Break of 1.2069 will extend larger rise from 1.0339 to next key fibonacci level at 1.2516. Nonetheless, break of 1.1661 will bring much lengthier consolidation first.
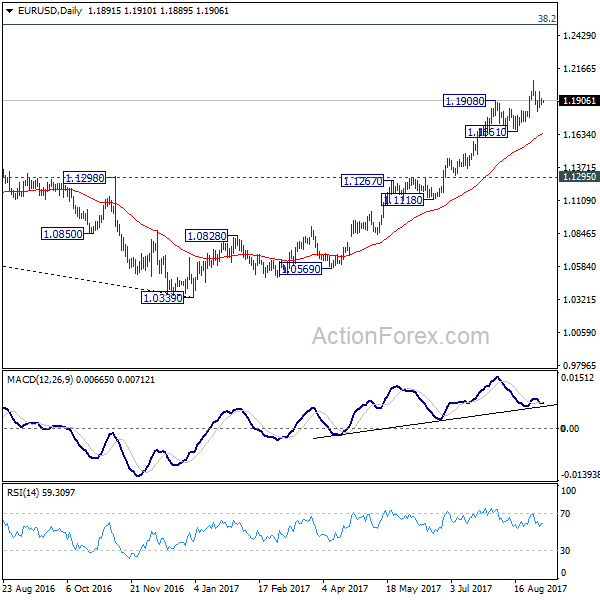
In the bigger picture, an important bottom was formed at 1.0339 on bullish convergence condition in weekly MACD. Sustained trading above 55 month EMA (now at 1.1774) will pave the way to key fibonacci level at 38.2% retracement of 1.6039 (2008 high) to 1.0339 (2017 low) at 1.2516. While rise from 1.0339 is strong, there is no confirmation that it's developing into a long term up trend yet. Hence, we'll be cautious on strong resistance from 1.2516 to limit upside. For now, medium term outlook will remain bullish as long as 1.1295 support holds, in case of pull back.
GBP/USD Daily Outlook
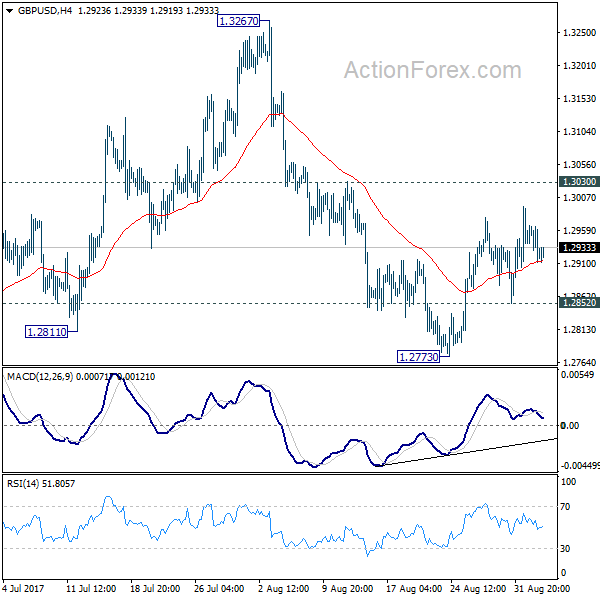
Daily Pivots: (S1) 1.2904; (P) 1.2934; (R1) 1.2957; More...
Intraday bias in GBP/USD remains neutral for the moment. Outlook stays bearish with 1.3030 resistance intact. We're favoring the case that correction from 1.1946 is completed at 1.3267. Below 1.2852 minor support will turn intraday bias back to the downside for 1.2588 key near term support first. Decisive break of 1.2588 will confirm our view and target a test on 1.1946 low. Though, break of 1.3030 will dampen this bearish view and turn bias back to the upside for retesting 1.3267.
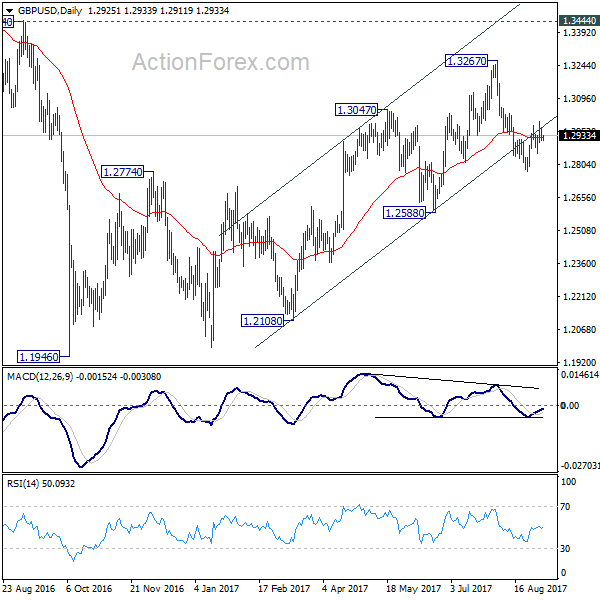
In the bigger picture, overall, price actions from 1.1946 medium term low are seen as a corrective pattern. While further rise cannot be ruled out, larger outlook remains bearish as long as 1.3444 key resistance holds. Down trend from 1.7190 (2014 high) is expected to resume later after the correction completes. And break of 1.2588 will indicate that such down trend is resuming.
USD/CHF Daily Outlook
Daily Pivots: (S1) 0.9544; (P) 0.9581; (R1) 0.9610; More....
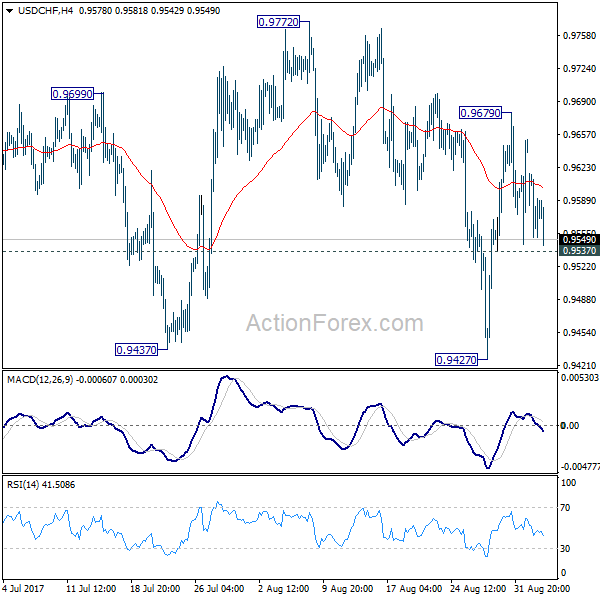
At this point, intraday bias in USD/CHF stays neutral first. On the downside, below 0.9537 minor support will turn bias back to the downside for retesting 0.9427 first. Break of 0.9427 will resume whole decline from 1.3042. Meanwhile, considering it's close to to 0.9443 key support, consolidation from 0.9427 might extend further. But still, break of 0.9772 resistance is needed to confirm near term reversal. Otherwise, outlook stays bearish for another decline.
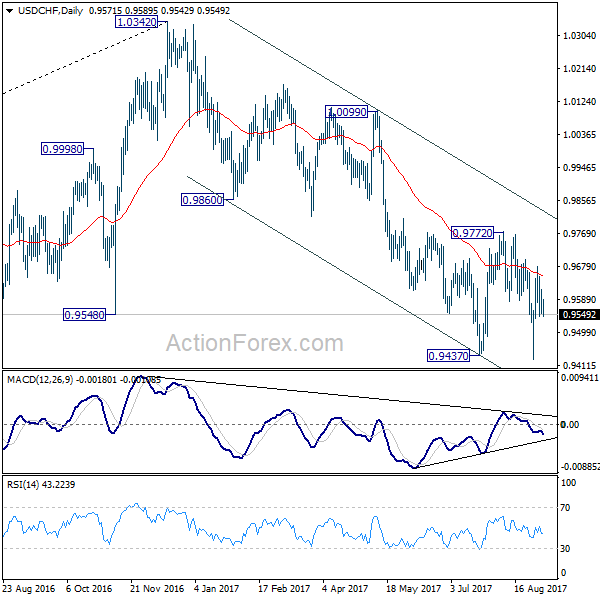
In the bigger picture, current development suggests that 0.9443 key support (2016 low) could be taken out firmly as down trend form 1.0342 extends. There are various interpretation of the price actions. But in any case, medium term outlook will stay bearish as long as 0.9772 resistance holds. Current down trend could extend to 38.2% retracement of 0.7065 (2011 low) to 1.0342 (2016 high) at 0.9090. However, break of 0.9772 will indicate that USD/CHF has successfully defended 0.9443 again and turn outlook bullish for 1.0099 resistance.
USD/JPY Daily Outlook
Daily Pivots: (S1) 109.41; (P) 109.66; (R1) 109.95; More...
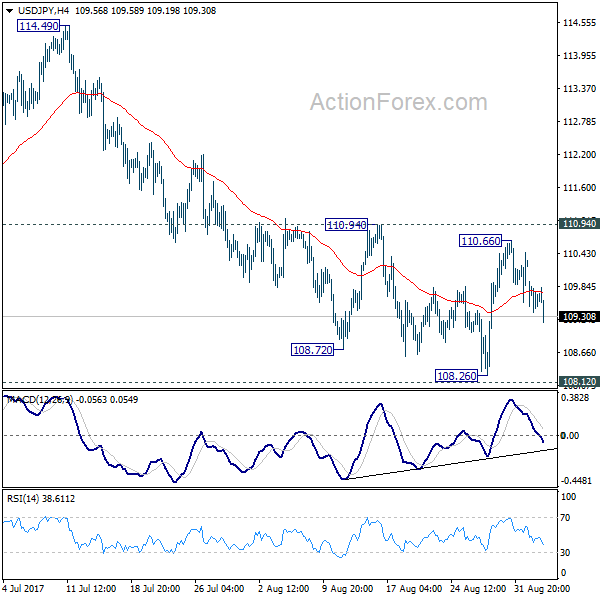
Intraday bias in USD/JPY remains mildly on the downside for retesting 108.12/26 support zone. Decisive break there will resume the whole corrective decline from 118.65. In that case, USD/JPY will target 61.8% retracement of 98.97 to 118.65 at 106.48. In any case, outlook will remain cautiously bearish as long as 110.94 resistance holds. Nonetheless, considering bullish convergence condition in 4 hour MACD, break of 110.94 will indicate near term reversal and bring stronger rebound back towards 114.49 resistance.
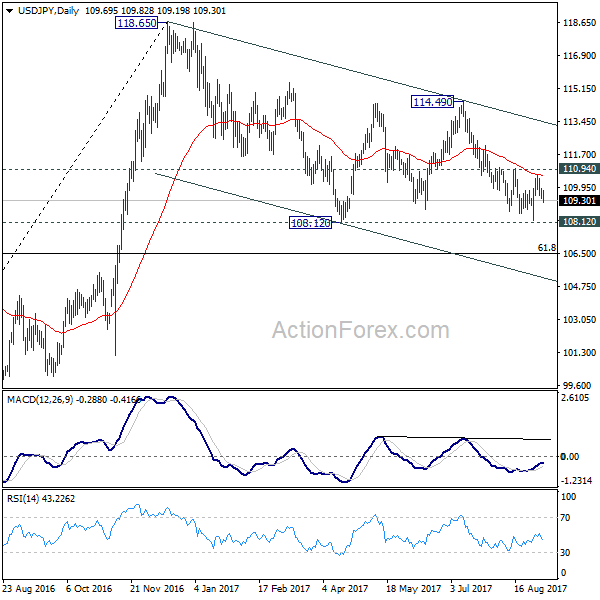
In the bigger picture, the corrective structure of the fall from 118.65 suggests that rise from 98.97 is not completed yet. Break of 118.65 will target a test on 125.85 high. At this point, it's uncertain whether rise from 98.97 is resuming the long term up trend from 75.56, or it's a leg in the consolidation from 125.85. Hence, we'll be cautious on topping as it approaches 125.85. If fall from 118.65 extends lower, downside should be contained by 61.8% retracement of 98.97 to 118.65 at 106.48 and bring rebound.
USD/CAD Daily Outlook
Daily Pivots: (S1) 1.2383; (P) 1.2404; (R1) 1.2435; More....
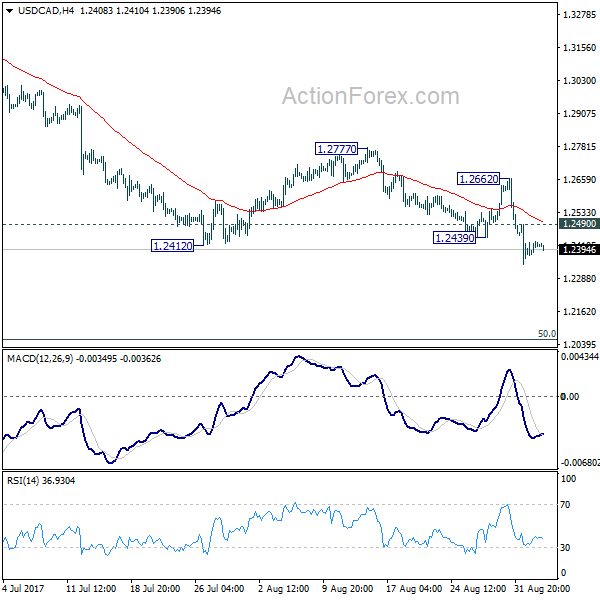
Intraday bias in USD/CAD stays on the downside with 1.2490 minor resistance intact. Current decline from 1.3793 (and 1.4689) is expected to continue and target next long term fibonacci level at 1.2048. On the upside, above 1.2490 minor resistance will turn intraday bias neutral again. But outlook will remain bearish as long as 1.2662 resistance holds.
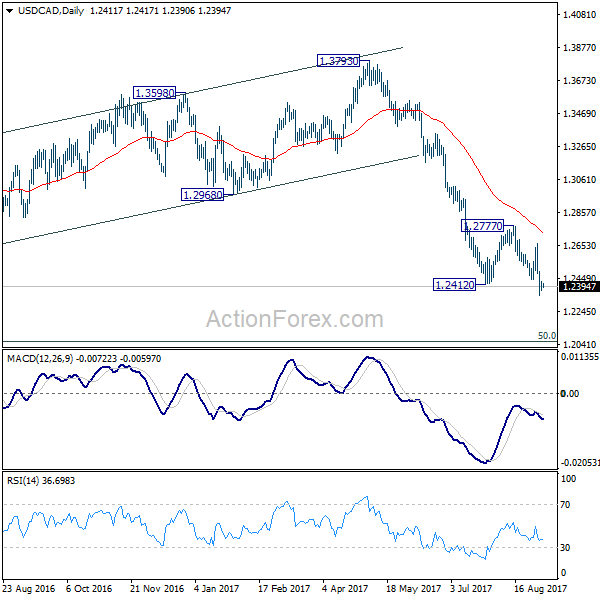
In the bigger picture, price actions from 1.4689 medium term top are seen as a correction pattern. Such corrective fall is expected to extend to 50% retracement of 0.9406 to 1.4869 at 1.2048. At this point, we'd look for strong support from there to contain downside and bring rebound. Break of 1.2777 resistance will indicate reversal and turn outlook bullish for 1.3793 key resistance. However, sustained break of 1.2048 will carry larger bearish implications and bring deeper decline.
USD/CAD Retesting Support
After the stellar Canadian GDP numbers last week, we blogged about the possibility of the Bank of Canada hiking rates, which would lead to further selling in USD/CAD.
Take a look at the updated daily chart where not much has changed from our last look:
USD/CAD Daily:
What you can see however, is that support level we were watching has now broken. If you didn’t get long off the failure at resistance when the GDP number was released, then this is a juicy higher time frame level that you can start to look at managing your risk around.
Now zoom into the intraday charts and let’s take a look at the price action:
USD/CAD 4 Hourly:
I’ve used a 4 hourly chart on this occasion, simply because it clearly shows the swing low levels that we’ve been watching for previous support to possibly turn to resistance.
As long as price is below the daily support level, the intraday zone that I’ve marked with the thinner lines is the key level to look for a turn.
Market Morning Briefing: A Bit Of Weakness In The Pound
STOCKS
Global stocks are all mixed. We will have to wait for more directional clarity as most of the indices are trading near indecisive levels. Shanghai looks very bullish just now but Nifty, Dow and Dax are not very clear for the near term.
Dow (21987.56, +0.18%) is trying to move up in every session but is unable to sustain the day’s highs. A break above 22080 is needed to resume the medium term uprtrend. But we do not negate a fall towards 21800 just now.
Dax (12102.21, -0.33%) need to break above 12200 to show a medium term bullish signal; else a fall back towards 12000-11900could be seen in the next few sessions.
Nikkei (19417.31, -0.47%) has been falling for the last 2-sessions as expected. 19250 is an immediate downside target from where a slight bounce could be expected.
Shanghai (3380.13, +0.02%) is trading along the support and could slowly inch up in the near term. A rise towards 3400-3425 looks possible in the coming sessions.
Nifty (9912.85, -0.62%) came off sharply to test 9850 on the downside. Trade within 10050-9800 levels looks possible for the coming sessions. While below 10050, we may expect a narrow range trade for this week.
COMMODITIES
Gold (1341) is inching towards 1350 as the support at 1335 is still intact. But we are doubtful about the sustainability beyond 1350-55 levels due to short term overbought condition. Muted price action had been seen in Silver (17.96) as the scrip is highly overbought thus a price correction towards 17.50 could be seen soon.
Copper (3.16) moved higher as we had told that above 3.12, higher levels of 3.26 can come into consideration. The only concern in the short term overbought condition which could be resulted short term profit taking anywhere between 3.12-3.26 levels. But we will remain bullish on copper while it is trading above 2.88 levels in the medium term time frame.
No directional move had been seen in Brent (52.16) as it is hovering around the resistance of its near term trading range of 49.70-52.80.Only a close above 52.80 could open up 55 regions, otherwise it might come down towards 51. WTI (47.41) is also trading at yesterday's level, within its range of 46.50-49. We will remain neutral on Brent and WTI while they are trading below 52.80 and 48 regions respectively.
FOREX
Some more dip in the Dollar Index (92.51) compared to yesterday's 92.65, with further strength being seen in the Yen (USDJPY = 109.32, EURJPY = 130.18) and some recovery in the Euro (1.1906). A further dip towards 92.00 is possible this week. The Chinese Yuan continues to be the strongest performing currency.
We had hinted at chances of Yen strength to 109.20-10 against the Dollar on a possible break below 109.50. Some more downside to 108.85 may also be budgeted for within an a broad sideways range of 108.50-110.50 now.
Our target of 129.45 for the week is a decent possibility in Euro-Yen (130.18), but not very much lower than that. Decent medium-term Support is seen near 129.
This suggests that the Euro (1.1906) will be able to stay above 1.1830 over the next few days and may even make a stab at a rise towards 1.20 by the end of the week. Note the ECB meeting is due this Thursday, 7th September. Whether or not the Euro is able to rise past 1.20 is going to be crucial.
A bit of weakness in the Pound (1.2925) yesterday within the indecisive sideways range of 1.28-30. More immediate range for the day is 1.2900-2975.
The Aussie (0.7963) continues to build strength for a possible rise to 0.81. Good Support at 0.7935 now.
The Chinese Yuan (USDCNY = 6.5375) has strengthened further still and could test 6.50. Dollar-Rupee (64.0550) had risen to 64.1750 yesterday. Watch crucial Resistance at 64.10-15 today.
INTEREST RATES
Euro has rebound as The German-US 2 Yr Spread (-2.11%) and German-US 10Yr Spread (-1.76%) are hovering around at yesterdays levels with no further losses.An immediate bounce from the current levels could boost the Eur as well.Besides we have ECB press conference on 7th Sep 17 at 6.00 pm IST, which may add some more clarity towards the future price action in Euro.
Muted price action had been seen in the benchmark US 10Yr yield (2.166%)for last few days. The immediate support at 2.15% is still intact, thus the US 10Yr could rebound towards 2.20 regions by this weekend.
Sign of a possible bounce has been seen though there were no changes in the Japanese 5Yr JGB (-0.14%), 10Yr JGB (0.00%) and the 30Yr JGB (+0.82%) at this writing.
The UK 5Yr and 30Yr Gilt Yields (5Yr 0.45% and 30Yr 1.61%) are continuing their bullish momentum in line with our expectation.The UK 10Yr (1.05%) is also hovering around its crucial resistance of 1.07-08% levels and a close above that could open up 1.25 levels in medium term time frame.
Headline Watch
Headline Watch
Given the holiday thinned trading conditions in NY, traders were content to sit this one rather than mix it up. Japanese Yen as highlighted yesterday will continue to be the G10 focal point among growing debate if USDJPY will remain supported on dips, but the jury is certainly out on this one.While we should expect heightened susceptibility to headline risk however as ' scarehead' diminishes, odds are the markets rebound. In the meantime, traders remain on headline alert. In particular, the market is still intently watching how China responds to this unprecedented N. Korea escalation
Safe havens should stay in vogue as the headline risk remains fraught with danger.So we should expect CHF and JPY remain bid against USD near term, however in the absence of any surprises, FX dealers will key on how the US treasury markets open after the long weekend, which could prove to be the real litmus test for risk and the movements could deluge the FX markets
In addition to the geopolitical risk, traders focus now pivots to Fedspeak and debt ceiling concerns.
Euro
The G-10 markets traded nimbly as dealers took shelter amid scarce liquidity conditions in NY trade. Despite geopolitical issues I expect G-10 trade to remain very wary as the EUR consolidates ahead of the ECB on Thursday.
Japanese Yen
At some point, cooperative denunciation and hard hitting sanctions have to occur as a weak standing UN security council rhetoric has done little to restore tranquillity thus far. But with a gaggle of FED speak this week to add to the noise, conflicting signals may lead to a busy week.
Australian Dollar
The Aussie will be hogging a bit of the stage today with the RBA due out later this morning. No changes are expected, but the markets are on guard as Governor Lowe could lead to the Aussie strength given that AUDUSD is trading at the recent highs.
Given we expect little change in policy or statement so look for the Aussie bullish trend to remain in tact as commodity prices continue to firm on the up beat global growth narrative
Pound Shrugs Off Soft Construction PMI
The British pound is almost unchanged in the Monday session. In North American trade, GBP/USD is trading at 1.2956, up 0.01% on the day. On the release front, British Construction PMI slowed to 51.1, short of the estimate of 52.1 points. This marked the weakest reading since September 2016. US banks are closed for the Labor Day holiday, so traders can expect a quiet North American session. On Tuesday, the UK releases Services PMI, which is expected to dip to 53.5 points.
It was a disappointing end to the week, as US employment numbers were unexpectedly soft on Friday. but the dollar shrugged off the disappointing numbers and held its own against the pound. Nonfarm employment change slowed to 156 thousand, well below the estimate of 180 thousand. This marked a 3-month low. However, with the US labor market still close to capacity (the unemployment rate is just 4.4%), the markets can be forgiving about a softer nonfarm payroll report. Wage growth, or the lack of it, is a more pressing concern. Average Hourly Earnings posted a small gain of 0.1%, missing the estimate of 0.2%. This was down from 0.3% in the previous report, and matched the weakest gain seen in 2017. The lack of wage gains has impacted on inflation levels, which remain well below the Fed's inflation target of 2%. Soft inflation has dampened enthusiasm for a final rate hike in 2017, with the odds of December increase pegged at just 37%.
The Brexit negotiations continue to grind slowly, causing concern in both Brussels and London. A third round of talks ended last week in Brussels, as the head of the EU team, Michel Barnier, complained about the pace of progress. Britain and the EU remain far apart on a range of issues and even the scope of the talks remain in dispute. Britain wants to discuss a future trading relationship with the EU at the same time that points in contention are dealt with, but the Europeans insist on solving the contentious issues first, such as the size of Britain's bill and the jurisdiction of the European High Court on European citizens living in the UK. With plenty of distrust between the sides, the negotiations could grind to a halt if both sides don't show greater flexibility, and such a scenario would likely take a toll on the British pound.
Elliott Wave Trade Ideas Performance Update
7 positions were entered last week with total profit of 140 points and the positions are listed below.
18 Aug : AUD/USD - Long at 0.7895, exited at 0.7900 (+ 5 points)
28 Aug : GBP/USD - Short at 1.2910, exited at 1.2970 ( - 60 points)
29 Aug : EUR/JPY - Long at 129.70, exited at 131.70 (+ 200 points)
30 Aug : GBP/JPY - Short at 142.00, exited at 142.00 ( 0 point)
30 Aug : USD/CAD - Short at 1.2595, exited at 1.2600 (- 5 points)
4 Sep : EUR/JPY - Long at 130.30,
4 Sep : GBP/JPY - Long at 141.60, exited at 141.70 (+ 10 points)
| AUD EUR/JPY EUR/GBP CAD GBP GBPJPY
Jan - 15 -275 - 35 -120
Feb + 140 -17 - 40 +11
Mar - 20 +115 +132 - 19
Apr + 30 - 40 +120 + 45
May - 55 +100 - 6 -65 -60
Jun + 81 +150 - 10 +185 -120 +205
Jul - 40 - 60
Aug +155 +200 + 100 + 195 -45 - 50
Sep +10
Oct
Nov
Dec
Y-T-D + 371 +118 +167 +658 -230 +90