
Sample Category Title
Interest Rates Need To Start Rising Now: BoE’s Michael Saunders
For the 24 hours to 23:00 GMT, the GBP rose 0.15% against the USD and closed at 1.2941, following hawkish remarks from the Bank of England's (BoE) monetary policy committee member, Michael Saunders.
Michael Saunders urged for an immediate interest rate hike in order to combat rising inflation and warned a delay could lead to ‘a more abrupt and painful economic slowdown'. Further, he added that risks emerging from Britain's departure from the European Union does not justify holding off raising interest rates at record low levels.
However, gains in the Pound were limited amid heightened concerns over Brexit as the third round of Brexit negotiations concluded with little fruition, while the European Union's (EU) chief negotiator, Michel Barnier, warned that negotiations were lacking sufficient progress.
In the Asian session, at GMT0300, the pair is trading at 1.2945, with the GBP trading a tad higher against the USD from yesterday's close.
The pair is expected to find support at 1.2883, and a fall through could take it to the next support level of 1.2821. The pair is expected to find its first resistance at 1.2977, and a rise through could take it to the next resistance level of 1.3009.
Ahead in the day, traders will focus on Britain's Markit manufacturing PMI for August.
The currency pair is trading above its 20 Hr and 50 Hr moving averages.

Japan’s Manufacturing Sector Growth Revised Lower In August
For the 24 hours to 23:00 GMT, the USD declined 0.25% against the JPY and closed at 110.06.
In the Asian session, at GMT0300, the pair is trading at 110.05, with the USD trading slightly lower against the JPY from yesterday's close.
Overnight data indicated that Japan's final Nikkei manufacturing PMI rose less than initially estimated to a level of 52.2 in August, while the preliminary figures had indicated an advance to a level of 52.8 and compared to a level of 52.1 in the previous month.
The pair is expected to find support at 109.73, and a fall through could take it to the next support level of 109.41. The pair is expected to find its first resistance at 110.52, and a rise through could take it to the next resistance level of 110.99.
Moving ahead, market participants will look forward to Japan's final GDP numbers for 2Q 2017, slated to release next week.
The currency pair is trading below its 20 Hr and 50 Hr moving averages.

Swiss Franc Trading A Tad Lower This Morning
For the 24 hours to 23:00 GMT, the USD declined 0.37% against the CHF and closed at 0.9596.
In the Asian session, at GMT0300, the pair is trading at 0.9597, with the USD trading marginally higher against the CHF from yesterday's close.
The pair is expected to find support at 0.9557, and a fall through could take it to the next support level of 0.9518. The pair is expected to find its first resistance at 0.9658, and a rise through could take it to the next resistance level of 0.9720.
Going forward, Switzerland's retail sales for July and SVME–PMI for August, scheduled to release in a few hours, will garner a lot of market attention.
The currency pair is trading below its 20 Hr and 50 Hr moving averages.

Canadian Economy Expanded At Its Fastest Annualised Rate In Nearly Six Years In 2Q 2017
For the 24 hours to 23:00 GMT, the USD declined 1.13% against the CAD and closed at 1.2480.
The Canadian Dollar gained ground, after Canada’s gross domestic product (GDP) advanced 0.3% on a monthly basis in June, surpassing market expectations for an advance of 0.1% and boosting odds of another interest rate hike. In the prior month, the GDP had registered a rise of 0.60%. Meanwhile, the nation’s economy expanded at an annualised 4.5% in the second quarter of 2017, growing at its quickest pace in nearly six years, compared to an advance of 3.7% in the prior quarter.
In the Asian session, at GMT0300, the pair is trading at 1.2457, with the USD trading 0.18% lower against the CAD from yesterday’s close.
The pair is expected to find support at 1.2384, and a fall through could take it to the next support level of 1.2312. The pair is expected to find its first resistance at 1.2596, and a rise through could take it to the next resistance level of 1.2736.
The currency pair is trading below its 20 Hr and 50 Hr moving averages.

Daily Technical Analysis: EURUSD, GBPUSD, USDJPY, USDCHF
EURUSD
The EURUSD attempted to push lower yesterday bottomed at 1.1823 but closed higher at 1.1909 and hit 1.1922 earlier today in Asian session. As you can see on my daily chart below, we have a bullish pin bar formation which could signal an end to the bearish correction and resumption of the bullish trend. The bias is bullish in nearest term testing 1.2000 – 1.2070 region. Immediate support is seen around 1.1870. A clear break below that area could lead price to neutral zone in nearest term testing 1.1823 key support. A clear break and daily/weekly close below 1.1823 would signal further bearish correction next week testing 1.1600 region.
GBPUSD
The GBPUSD attempted to push lower yesterday slipped below 1.2870 but whipsawed to the upside and closed higher at 1.2928 and hit 1.2947 earlier today in Asian session. The bias is bullish in nearest term but price is still trapped between 1.2980 – 1.2870 range area and need a clear break from that range area to see clearer direction. A clear break and daily/weekly close above 1.2980 would expose 1.3125 area next week. On the other hand, a clear break and daily/weekly close below 1.2870 would expose 1.2700 area next week. Overall I remain neutral.
USDJPY
The USDJPY attempted to push higher yesterday topped at 110.67 but closed lower at 109.96. The bias is neutral in nearest term but price is still in a bullish phase after formed a valid bullish pin bar on Tuesday with nearest bullish target seen around 111.00 region. Immediate support is seen around 109.85. A clear break below that area could trigger further bearish pressure testing 109.40 but key support remains at 108.70 area. Overall I remain neutral.
USDCHF
The USDCHF failed to continue its bullish momentum yesterday bottomed at 0.9582 and hit 0.9576 earlier today in Asian session. The bias is bearish in nearest term testing 0.9525 but the bullish pin bar formed on Tuesday still provides a valid bullish signal. Immediate resistance is seen around 0.9650. A clear break above that area could lead price to neutral zone in nearest term testing 0.9700 region but key resistance is seen at 0.9765 – 0.9807 region which remains a good place to sell. I prefer to stand aside for now.
Daily Technical Outlook And Review: EUR/USD, GBP/USD, AUD/USD, USD/JPY, USD/CAD, USD/CHF, DOW 30, GOLD
A note on lower timeframe confirming price action...
Waiting for lower timeframe confirmation is our main tool to confirm strength within higher timeframe zones, and has really been the key to our trading success. It takes a little time to understand the subtle nuances, however, as each trade is never the same, but once you master the rhythm so to speak, you will be saved from countless unnecessary losing trades. The following is a list of what we look for:
- A break/retest of supply or demand dependent on which way you're trading.
- A trendline break/retest.
- Buying/selling tails ... essentially we look for a cluster of very obvious spikes off of lower timeframe support and resistance levels within the higher timeframe zone.
- Candlestick patterns. We tend to only stick with pin bars and engulfing bars as these have proven to be the most effective.
We typically search for lower-timeframe confirmation between the M15 and H1 timeframes, since most of our higher-timeframe areas begin with the H4. Stops are usually placed 1-3 pips beyond confirming structures.
EUR/USD
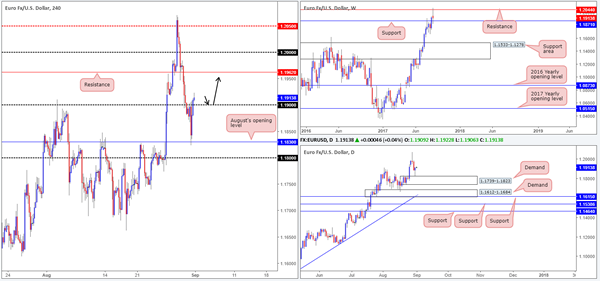
Going into the early hours of yesterday’s US segment, we can see that the single currency bottomed around August’s opening level at 1.1830. Soft US data, along with a USDX (H4) resistance at 11960 and daily supply at 11969-11938, helped lift the pair north, consequently ending the day closing beyond the 1.19 handle.
Similar to the USDX daily supply (only inverse), we also saw EUR daily demand brought into play yesterday at 1.1739-1.1823, which, as you can probably see, formed a beautiful buying tail. Also of particular interest is the weekly timeframe; price recently connected with nearby support at 1.1871.
Suggestions: In a nutshell, the structure of this pair can be boiled down to the following points:
H4 trading above 1.19 – shows room to advance up to resistance at 1.1962.
Daily price trading from demand (USDX from supply) – formed buying tail, and shows little resistance on the horizon.
Weekly action trading from support – could possibly see price retest resistance at 1.2044.
Consequent to the above, we’re looking for price to retest 1.19 and hold as support today. Should this come to realization and price follows up with a full, or near-full-bodied candle, the team would consider a long, targeting 1.1962 as an initial take-profit line.
Data points to consider: US employment report at 1.30pm, US ISM manufacturing PMI at 3pm GMT+1.
Levels to watch/live orders:
- Buys: 1.19 region ([waiting for a reasonably sized H4 bullish candle to form – preferably a full, or near-full-bodied candle – is advised] stop loss: ideally beyond the candle’s tail).
- Sells: Flat (stop loss: N/A).
GBP/USD
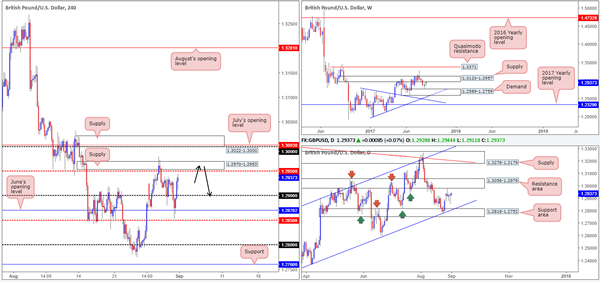
Across the board, we saw the US dollar selloff from (USDX) H4 resistance at 11960 on Thursday. This, as you can see, helped the (GBP) H4 candles recover beautifully from June’s opening level at 1.2870, with the major settling for the day just ahead of the mid-level resistance at1.2950/supply at 1.2970-1.2953.
Over on the bigger picture, weekly price is seen trading from supply pegged at 1.3120-1.2957, and daily action is seen meandering ahead of a resistance area at 1.3058-1.2979. Also noteworthy, daily price shows room to extend as far down as the support area seen at 1.2818-1.2752, which happens to intersect with a channel support taken from the low 1.2365.
Suggestions: Should H4 price challenge the aforementioned H4 supply today and chalk up a bearish candle (preferably a full, or near-full-bodied candle), a sell from this area would be valid, in our opinion.
Data points to consider: UK Manufacturing PMI at 9.30am. US employment report at 1.30pm, US ISM manufacturing PMI at 3pm GMT+1.
Levels to watch/live orders:
- Buys: Flat (stop loss: N/A).
- Sells: 1.2970-1.2953 ([waiting for a reasonably sized H4 bearish candle to form – preferably a full, or near-full-bodied candle – is advised] stop loss: ideally beyond the candle’s wick).
AUD/USD
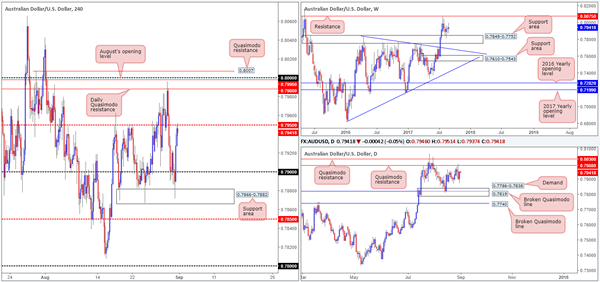
Using a top-down approach this morning, we can see that weekly price remains bolstered by the support area drawn from 0.7849-0.7752. Further buying from this region will likely bring the candles up to resistance pegged at 0.8075. The story on the daily timeframe, however, shows that upside is currently capped by a nearby Quasimodo resistance at 0.7988, followed closely by another Quasimodo resistance at 0.8030.
Bouncing over to the H4 timeframe, recent movement shows the commodity currency surpassed the 0.79 handle – tagged fresh buy orders at 0.7866-0.7882 (support area) – and then advanced (likely helped by gold’s advance) back up to the mid-level resistance at 0.7950 by the day’s end.
Suggestions: With both gold and the Aussie higher timeframe charts showing room to appreciate, we feel 0.7950 will eventually give way today. Technically speaking, a violation of 0.7950 leaves the path north free for price to challenge the daily Quasimodo resistance mentioned above at 0.7988.
With less than 40 pips of room to play with between 0.7950/0.7988, we feel a long above 0.7950 will be somewhat challenging. That is, of course, unless one is able to pin down a long with a small enough stop-loss order to accommodate sufficient risk/reward.
Data points to consider: Caixin manufacturing PMI at 2.45am. US employment report at 1.30pm, US ISM manufacturing PMI at 3pm GMT+1.
Levels to watch/live orders:
- Buys: Flat (stop loss: N/A).
- Sells: Flat (stop loss: N/A).
USD/JPY
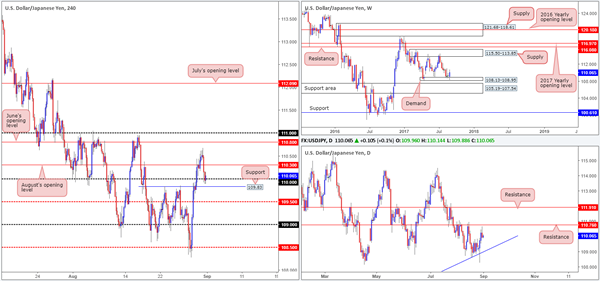
The USD/JPY slid below August’s opening level at 110.30 and attacked the 110 handle on Thursday, after topping around the 110.50 mark on Thursday. The H4 candles have yet to register anything noteworthy at 110, which could imply price may punch lower and challenge the nearby support at 109.83.
On the daily timeframe, price recently came within a few pips of testing resistance at 110.76 and sold off. In the event that the bears remain in the driving seat here, the next downside target can be seen at a trendline support extended from the low 100.08. On the other side of the coin, however, weekly price is seen trading north from a demand base coming in at 108.13-108.95.
Suggestions: To our way of seeing things, neither a long nor short seems attractive at the moment. Not only because of the conflicting signals coming from the higher timeframes, but also due to the somewhat restricted structure being seen on the H4 timeframe.
Data points to consider: US employment report at 1.30pm, US ISM manufacturing PMI at 3pm GMT+1.
Levels to watch/live orders:
- Buys: Flat (stop loss: N/A).
- Sells: Flat (stop loss: N/A).
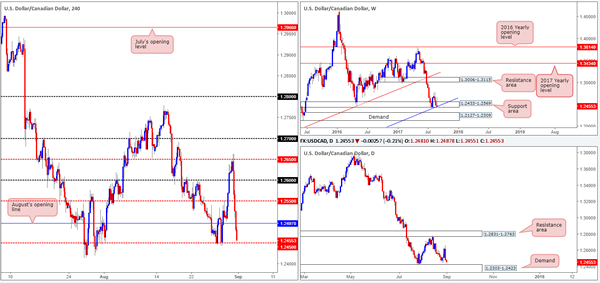
USD/CAD
Following a strong Canadian GDP print, the USD/CAD plummeted over 100 pips lower. The 1.26 handle, the H4 mid-level support at 1.2550 and eventually August’s opening level at 1.2497 were all engulfed, leaving price free to challenge mid-level support 1.2450. Over on oil’s H4 chart, nevertheless, crude is beginning to print bearish candles from a minor H4 resistance at 47.40.
The recent move lower has placed considerable pressure on the weekly demand at 1.2433-1.2569, which fuses nicely with a trendline support etched from the low 0.9633. Traders may have also noticed that daily price is now seen trading just ahead of a demand base coming in at 1.2303-1.2423.
Suggestions: The top edge of daily demand at 1.2423 looks interesting for a long, despite this area being located beneath the aforementioned weekly support zone. Be that as it may, the underlying trend on this pair remains bearish, and buying right now would almost feel like trying to ‘catch a falling knife’. For that reason, we’re going to remain on the sidelines at least until the US job’s report is out of the way, and then look to reassess structure.
Data points to consider: US employment report at 1.30pm, US ISM manufacturing PMI at 3pm GMT+1.
Levels to watch/live orders:
- Buys: Flat (stop loss: N/A).
- Sells: Flat (stop loss: N/A).
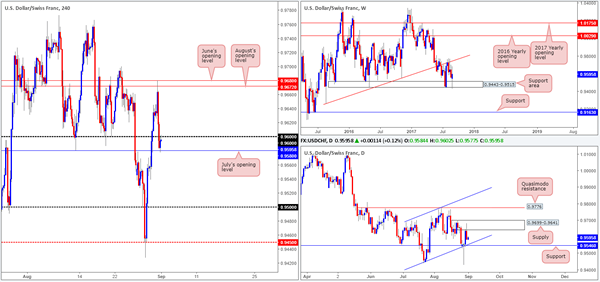
USD/CHF
In recent trading H4 price rallied into both June/August’s opening levels at 0.9680/0.9672, which did a superb job in holding the unit lower. The downside move from these levels was aided by a rally on the EUR/USD and a hefty push lower from USDX (H4) resistance at 11960. As a result of this, the day concluded with price breaching the 0.96 handle and testing July’s opening line at 0.9580.
Another key thing to note regarding yesterday’s selloff is the daily supply at 0.9699-0.9641, and corresponding daily supply seen on the USDX at 11969-11938. Also worth mentioning on the daily chart is that the next downside target can be seen at 0.9546: a nearby support level that converges with a channel support etched from the low 0.9438. Looking up to the weekly timeframe, nonetheless, price is currently lurking mid-range between a support area at 0.9443-0.9515 and a trendline resistance extended from the low 0.9257.
Suggestions: Back on the H4 timeframe, we can see that beyond July’s opening level at 0.9580 there’s room seen for the Swissy to trade as far down as the 0.95 handle (although daily price shows that support at 0.9546 could hinder this move). Above 0.96, nevertheless, a move back up to June/August’s opening levels is also a possibility according to H4 structure. Despite this, one has to take into account that the underside of daily supply positioned at 0.9641 may come into play before the monthly levels are reached!
For that reason, if you intend on trading beyond either 0.96 or 0.9580 today, do remain cognizant of the daily structures highlighted above!
Data points to consider: US employment report at 1.30pm, US ISM manufacturing PMI at 3pm GMT+1.
Levels to watch/live orders:
- Buys: Flat (stop loss: N/A).
- Sells: Flat (stop loss: N/A).
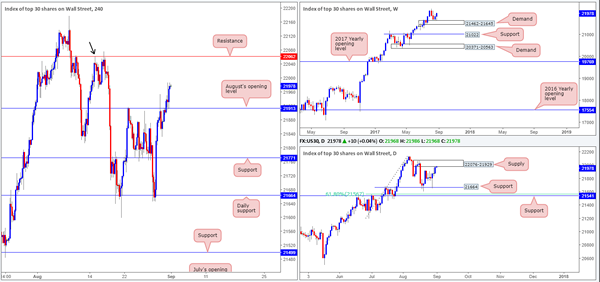
DOW 30
Despite finding a strong pocket of offers around August’s opening level at 21913 on Wednesday, US equities managed to close above this monthly line during yesterday’s segment and clock a high of 21987. The latest move north was likely due to weekly bulls recently making a stand from demand at 21462-21645. Providing that weekly action remains bid from here, the next port of call will likely be fresh record highs.
Although H4 action looks reasonably clear up to resistance at 22062 (also denotes a Quasimodo resistance left shoulder marked by the black arrow), daily price is seen trading from supply at 22076-21929. While this supply boasts strong momentum, let’s not forget that it has formed within an incredibly dominant uptrend. Therefore, we feel this area will eventually give way.
Our suggestions: Given the current daily supply in play, trading this market to the upside is challenging from a technical perspective. Granted, we could assume that the area will engulf due to the uptrend, but this is still extremely risky and not something we’d be willing to base a trade on. As such, we feel waiting on the sidelines, at least until after the US job’s report, may be the better route to take.
Data points to consider: US employment report at 1.30pm, US ISM manufacturing PMI at 3pm GMT+1.
Levels to watch/live orders:
- Buys: Flat (stop loss: N/A).
- Sells: Flat (stop loss: N/A).
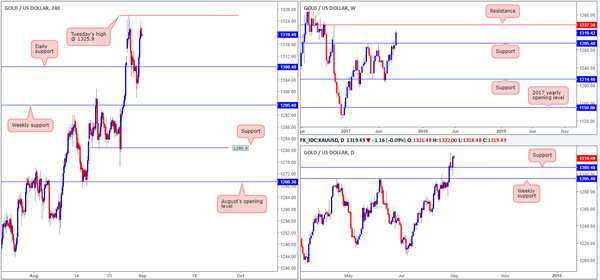
GOLD
Given the broad-based dollar selloff against the majority of its major trading peers yesterday, the price of gold increased in value. At this stage, the odds of weekly price continuing to advance north to shake hands with resistance at 1337.3 is quite high, in our opinion. Adding weight to this theory, we can see that price recently rebounded from a daily support coming in at 1308.4.
Still, before we’re confident of gold’s direction, we’d need to see Tuesday’s high at 1325.9 taken out on the H4 timeframe. This, as far as we can see, is the last major obstacle stopping price from gravitating north.
Our suggestions: A H4 close above Tuesday’s high, followed up with a retest and a H4 bullish candle in the shape of either a full, or near-full-bodied bullish candle would, in our view, be enough to validate a long, targeting the weekly resistance mentioned above at 1337.3.
Levels to watch/live orders:
- Buys: Watch for H4 price to engulf 1325.9 and then look to trade any retest seen thereafter ([waiting for a reasonably sized H4 bull candle to form following the retest is advised] stop loss: ideally beyond the candle’s tail).
- Sells: Flat (stop loss: N/A).
Daily Technical Analysis: EUR/USD Prepares Bearish ABC Zigzag Before Non Farm Payroll (NFP)
Currency pair EUR/USD
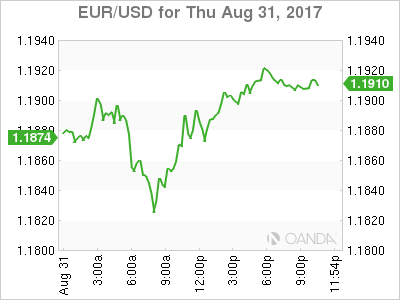
Important numbers are expected to be released today in the US. The Non Farm Payroll (NFP), average hourly earnings, and unemployment rate will be announced and they typically impact the US Dollar and other financial instruments. The reaction of the USD to the news remains to be seen but from an Elliott wave perspective, price has probably completed a wave 5 (purple/green) within wave 3 (blue).
The EUR/USD strong bearish momentum did not break the support trend line (blue), which makes a bullish extension still possible. However, price needs to break above the previous top of 1.2070 to make the scenario more likely. For the moment, an ABC (red) correction is more probable. The Fibonacci levels of wave B (red) could in that case act as resistance levels for a potential bearish turn.

The EUR/USD is probably building an ABC (purple) within a B (red). The invalidation level of the bearish correction is a break above the top at 1.2070.

Currency pair USD/JPY
The USD/JPY broke below the bullish channel (dotted blue). The bearish bounce could indicate that wave C (orange) has been completed but price will need to break below the support zone (green) to confirm this. Otherwise a larger bullish correction towards the 38.2% and resistance zone (red) could occur.
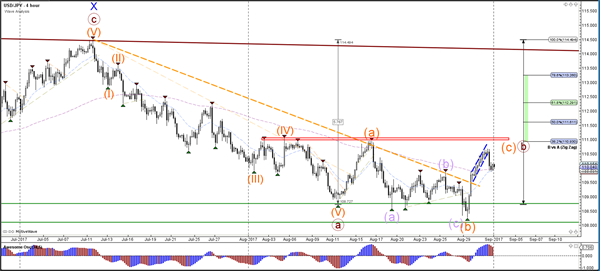
The USD/JPY is most likely building a wave 12 or AB (purple).

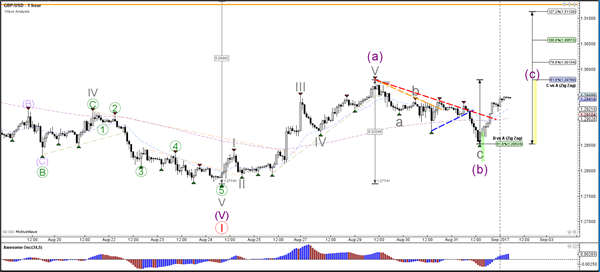
Currency pair GBP/USD
The GBP/USD made a deeper retracement and reached the 61.8% Fibonacci level which acted a support. The orange lines indicate a potential resistance zone.
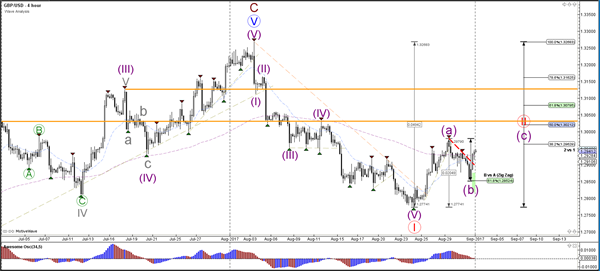
The GBP/USD bullish break above resistance (dotted red) is indicating the potential start of wave C purple).
Market Morning Briefing: The Mentioned Support At 1.1800 Held Well On The Euro
STOCKS
Dow (21948.10, +0.25%) closed near 21950, the immediate resistance we were looking at since the past few days. As mentioned yesterday, a break above 22000 could take it higher towards 22100-22200 in the medium term; else a fall could mean test of lower levels near 21700 again.
Dax (12055.84, +0.44%) has been trying to move up and has been opening the last 3-sessions with a gap-up, unable to sustain the highs in a single session. No bull strength is visible just now. 12200 on the upside is possible in the near term followed by a corrective dip back towards 12000.
19800-19850 is the immediate upside limit for Nikkei (19678.67, +0.17%) just now. Looking at the US-Japan 10Yr yield differential (2.12%), while the yield differential is headed lower towards 2% Dollar Yen (110.04) and Nikkei could be vulnerable to a sharp fall in the coming sessions.
Shanghai (3372.98, +0.36%) recovered sharply giving a false break below 3360 yesterday. If the index manages to sustain above 3360-3375 region, it could indicate the current rally that started from 3200 in August to continue this month as well. In that case, we may negate a fall towards 3275 mentioned yesterday.
Nifty (9917.90, +0.34%) is trapped in the 9950-9750 region just now. We have to remain cautious while below 9950; in case the index fails to break above 9950 in the current rise, it could come off towards 9750 and fall lower in the near term. Else a sustained break above 9950 could give some relief taking the index back towards 10000 or higher. For now preference is for a sharp rejection from 9950.
COMMODITIES
Gold (1324) moved higher as Dollar index failed to hold its ground above 93 regions. Immediate trading range for Gold is 1280-1350 with an interim resistance at 1335. Gold is not overbought yet thus a quick rally could be seen upon a beach of 1335. Similarly Silver (17.54) has also broken its resistance of 17.50 and heading towards 17.80 and 18.00 regions respectively. Both Gold and Silver are out of their short term bearish channel but the supports of 1280 and 16.90 should hold to keep the present bullish momentum intact.
Copper (3.10) is trading within the narrow range of 3.00-3.12. Only above 3.12 (which is still working as strong resistance), higher levels of 3.26 can come into consideration. The only concern in the short term overbought condition which may drag the prices towards 3.00 levels. But we will remain bullish on copper while it is trading above 2.88 levels in the medium term time frame.
Delayed reaction of a weekly shortage in US oil inventory had been seen in both Brent (52.76) and WTI (46.98). Overnight rally pulled the prices up towards their crucial resistance of 52.80 and 49 levels. But we will remain neutral on Brent and WTI, while they are trading below 52.80 and 49 levels on a weekly closing basis.
FOREX
The mentioned Support at 1.1800 held well on the Euro (1.1907), producing a decent bounce. It may now consolidate between 1.1850-2000 for a few days trying to figure out where to go for the nest couple of weeks. Perhaps the upcoming ECB meeting on 7th September will set the direction.
Dollar-Yen (110.04) too turned down well from the mentioned Resistance at 110.65 yesterday. Support at 109.80-50 today. If it breaks, we may see 109.00 next week. On the other hand, should there be a break above 110.65, much higher levels will come into play. Two way possibility in Yen, keep options open. Some greater preference may be given to the upside.
The Euro-Yen (131.04) saw the anticipated dip to 130.80-60 yesterday and is bouncing from there. A rise to 132.45 is possible, which could support the upside preference in Dollar-Yen as well.
Although we were expecting an indecisive range of 1.2825-2925 on the Pound (1.2944) it got bought strongly on an intra-day dip to 1.2850 yesterday. This might suggest increasing strength for the Pound, contrary to our expectation. Continue to watch.
Decent bounce in the Aussie (0.7950) from an intra-day dip to the lower Support at 0.7865 mentioned yesterday. This increases the chances of an eventual rise towards 0.81, but the barrier at 0.80 needs to be broken first.
The Yuan (USDCNY = 6.5785) is trading stronger again. We will be keen to see if the pair bounces from here or not, as we perceive the current levels to be a crucial Support. Let us see.
Dollar-Rupee had closed at 63.90/91 yesterday. It trades at 63.93/94 on NDF just now. It is expected to continue to trade in a range, with the range possibly expanding to 63.80 on the downside.
INTEREST RATES
Euro has managed to rebound from its intraday low asThe German-US 2 Yr Spread (-2.09%) and the German-US 10Yr Spread (-1.76%) both are trying to find support at current levels. If the German-US 2Yr Spread could manage to move up towards -2.00% then it could possible pull up the Euro too.
Sideways move had been seen in the benchmark US 10Yr yield, between 2.09-2.15 regions. But there are rooms for further downside towards 1.97 if the US 10Yr will close below 2.09% on a daily closing basis.
The Japanese 5Yr JGB (-0.14%), 10Yr JGB (0.01%) and the 30Yr JGB (+0.82%) are continuing their consolidation at current levels, suggesting a possible bounce in near term time frame.
The UK 5Yr and 30Yr Gilt Yields moved up (5Yr 0.44% and 30Yr 1.60%) in line with our expectation.The UK 10Yr (1.04%) has also rebound from its low of 1.00.
USD/CAD Canadian Dollar Higher After Strong Q2 GDP
The Canadian dollar rose on Thursday after the economy surprised to the upside with a 4.5 percent GDP growth in the second quarter being expectations of a 3.7 percent increase. This makes Canada the best performing country in the G7 and has put a rate hike before the end of the year firmly on the table. The Bank of Canada (BoC) is set to deliver its rate statement on September 6, which could be too early with market analyst favouring the October monetary policy meeting which could give the central bank enough time to see what its American and European counterparts will be launching in September. Bond markets are pricing in a 37.8 percent probability of a rate hike in September, up from yesterday’s 20.9 percent. The October rate hike has a 86.8 percent chance according to fixed income prices.
Oil prices came back from the lows caused by Hurricane Harvey. The US administration has approved use of the country’s energy reserves to offsets the shutdown in refinery capacity caused by the tropical storm.
The Trump administration has used hardball tactics ahead of the NAFTA renegotiations that are set to begin formally this weekend. Although the treaty itself leaves the door open for any member to exit the deal by giving six months notice, there are winners and losers of the deal in all three countries. American businesses would be hurt by a sudden end to the agreement, although their gain came from the job losses suffered in America that propelled Mr. Trump into the White House. American companies are hard at work lobbying for the deal to be reshaped for the modern world, but instead are getting anxious at Trump’s tweets threatening to end NAFTA. The three nations have signed non-disclosure agreements on the negotiations leaving the market to speculate on the talks as they happen.
Canadian Prime Minister Justin Trudeau was on a call today with US President Donald Trump the topic was the hope of reaching a deal before the end of the year. Later that day Trudeo addressed union workers and promised them a NAFTA deal they can be proud of while in Montreal.

The USD/CAD lost 0.889 percent in the last 24 hours. The currency is trading at 1.2515 near daily lows after a surprise increase in the expected rate of growth of the Canadian economy. The monthly gross domestic product (GDP) release shoed a 4.5 percent rate of growth beating estimates of 3.3 percent. Strong consumer spending was one of the main drivers of the accelerated rate in the second quarter.
The highest rate of growth in six years has put back on the table a follow up rate hike by the Bank of Canada (BoC) before the end of the year. The central bank cut rates twice in 2015 down to 0.50 percent and with a quick pivot in June, announced a rate hike in July against previous expectations of a 2018 first quarter move. The BoC has made it clear that those cuts are no longer needed as the economy has recovered from the impact of low oil prices. A rate hike in the October meeting could still happen given the strong data released today and is propelling the loonie higher versus the greenback.

Energy prices jumped 2.594 percent in the last 24 hours. The price of West Texas Intermediate is trading at 47.15 after the Trump administration has tapped the Strategic Petroleum Reserve to ease the disruption caused by Hurricane Harvey. The US government will loan its reserves to a refinery set in Louisiana, unaffected by the tropical storm in an effort to offset the shutdowns in Texan refineries.
The US also holds gasoline in emergency reserves and could consider tapping into them if gasoline prices remain elevated during the next couple of weeks until refineries can come back online. Harvey affected about a quarter of Texan refineries and is expected to be two to three weeks until they can reassume operations.
Market events to watch this week:
Friday, September 1
4:30 am GBP Manufacturing PMI
8:30 am USD Average Hourly Earnings m/m
8:30 am USD Non-Farm Employment Change
10:00 am USD ISM Manufacturing PMI
Dollar Awaits US Jobs Report
Tax reform talk and improving data give USD a boost
The US dollar recovered form the soft start of the trading week and is looking ahead of the release of the U.S. non farm payrolls (NFP) on Friday, September 1 at 8:30 am EDT. A strong ADP figure published on Wednesday saw private employers add 237,000 positions in August. The official report due on Friday is expected to have added 180,000 jobs after the 209,000 added the month before. Wages will be the real focus as traders will look for evidence that the U.S. Federal Reserve is ready for a third rate hike this year.
Inflation has remained close to flat in the US and its been a subject of discussion on Fed members. The leading camp has decided to risk raising rates with soft inflation but the lack of growth in wages could lead the central bank to close out 2017 with only a reduction of the balance sheet it accumulated during its quantitative easing program.
The second estimate for the US GDP in the second quarter was above the expectations and hit 3 percent. Price and wage inflation remains muted given the economy is growing at a faster pace and could end up taking a third rate hike off the table.
The EUR/USD dropped 0.076 percent on Thursday. The single currency is trading at 1.1891 ahead of the release of US employment data on Friday. The EUR broke through the 1.20 price level earlier in the week but ran out of momentum as the US indicators slowly turned the tide. ADP employment data and a better than expected second GDP estimate have boosted the US dollar ahead of the publication of the influential NFP report due tomorrow.
The USD recovered across the board, with the main exception being the CAD after a strong Q2 GDP release. The moves against the USD seemed overdone but with political turmoil and Hurricane Harvey and little data to go on in the beginning of the week there was hardly anywhere for the USD to go. With some distance from the Jackson Hole summit which brought little support the dollar, economic indicators and a push for tax reform are lifting the USD. The move will be confirmed if on Friday the NFP report not only manages to show a strong headline number of jobs, but also a rise in wages.
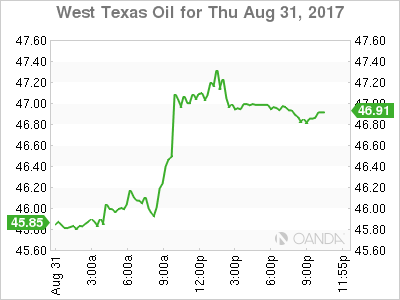
Energy prices jumped 2.594 percent in the last 24 hours. The price of West Texas Intermediate is trading at 47.15 after the Trump administration has tapped the Strategic Petroleum Reserve to ease the disruption caused by Hurricane Harvey. The US government will loan its reserves to a refinery set in Louisiana, unaffected by the tropical storm in an effort to offset the shutdowns in Texan refineries.
The US also holds gasoline in emergency reserves and could consider tapping into them if gasoline prices remain elevated during the next couple of weeks until refineries can come back online. Harvey affected about a quarter of Texan refineries and is expected to be two to three weeks until they can reassume operations.
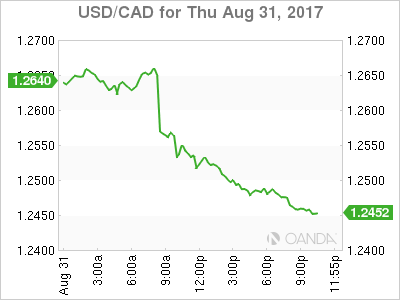
The USD/CAD lost 0.889 percent in the last 24 hours. The currency is trading at 1.2515 near daily lows after a surprise increase in the expected rate of growth of the Canadian economy. The monthly gross domestic product (GDP) release shoed a 4.5 percent rate of growth beating estimates of 3.3 percent. Strong consumer spending was one of the main drivers of the accelerated rate in the second quarter.
The highest rate of growth in six years has put back on the table a follow up rate hike by the Bank of Canada (BoC) before the end of the year. The central bank cut rates twice in 2015 down to 0.50 percent and with a quick pivot in June, announced a rate hike in July against previous expectations of a 2018 first quarter move. The BoC has made it clear that those cuts are no longer needed as the economy has recovered from the impact of low oil prices. A rate hike in the October meeting could still happen given the strong data released today and is propelling the loonie higher versus the greenback.
Market events to watch this week:
Friday, September 1
4:30 am GBP Manufacturing PMI
8:30 am USD Average Hourly Earnings m/m
8:30 am USD Non-Farm Employment Change
10:00 am USD ISM Manufacturing PMI