Sample Category Title
EUR/JPY Candlesticks and Ichimoku Analysis
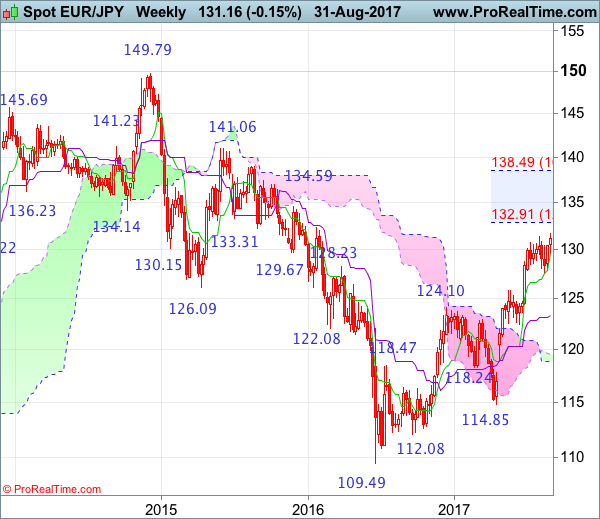
Weekly
• Last Candlesticks pattern: Window
• Time of formation: 24 April 2017
• Trend bias: Up
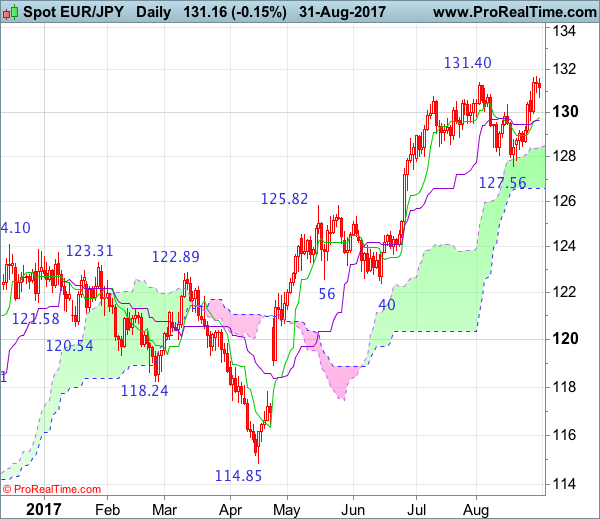
Daily
• Last Candlesticks pattern: Hammer
• Time of formation: 18 May 2017
• Trend bias: Up
EUR/JPY – 130.93
Although the single currency finally resumed recent upmove as the pair broke above previous resistance at 131.40, lack of follow through buying suggests minor consolidation would be seen and pullback to 130.50, then 129.95-00 cannot be ruled out, however, reckon 129.64-66 (current level of the Kijun-Sen and previous support) would limit downside. A daily close below this level would risk retreat to 129.00-10 but break of 128.45-50 is needed to signal a temporary top is possibly formed, bring weakness towards support at 127.56 which is likely to hold from here.
On the upside, above resistance at 131.71 would signal recent upmove is still in progress and may extend headway to 132.00-10, then 132.50-60, however, near term overbought condition would limit upside to 133.10-15 (61.8% projection of 122.40-131.40 measuring from 127.56) and reckon 133.50-60 would hold from here, price should falter well below 134.00-10, risk from there has increased for a retreat to take place later.
Recommendation: Stand aside for this week.
On the weekly chart, as the single currency found renewed buying interest at 127.56 and has finally resumed recent upmove, adding credence to our bullish view that the erratic upmove from 109.49 (2016 low) is still in progress, hence upside bias remains for this move to extend headway to previous chart resistance at 132.33, however, overbought condition should limit upside to 133.10-15 (61.8% projection of 122.40-131.40 measuring from 127.56) and price should falter well below 134.40 (61.8% Fibonacci retracement of entire fall from 149.79-109.49), risk from there is seen for a retreat to take place later.
On the downside, whilst initial pullback to 130.00-10, then the Tenkan-Sen (now at 129.64) cannot be ruled out, reckon 129.66 support would limit downside and bring another rise later. Below 129.00-10 would bring test of 128.45-50 but break of latter level is needed to suggest a temporary top is possibly formed, bring weakness towards support at 127.56 which is likely to hold on first testing. Only a drop below this level would provide confirmation, bring retracement of recent upmove to 126.70-80, then towards 126.00-10 but previous resistance at 125.81 should turn into support and limit euro’s downside.
USD/CAD Candlesticks and Ichimoku Analysis
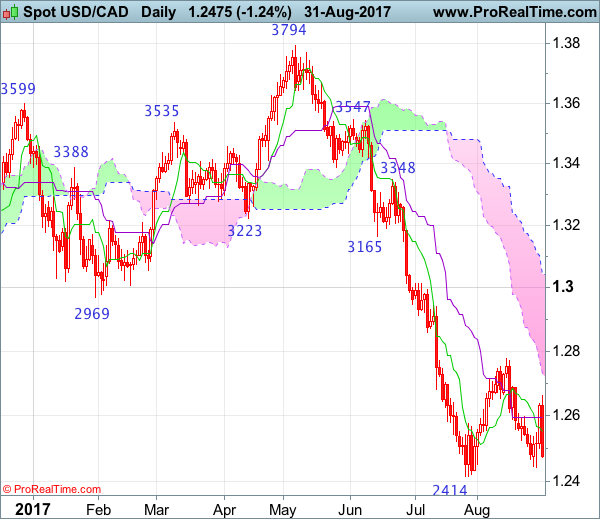
Weekly
• Last Candlesticks pattern: Shooting doji
• Time of formation: 01 May 2017
• Trend bias: Sideways
Daily
• Last Candlesticks pattern: Bearish engulfing
• Time of formation: 5 May 2017
• Trend bias: Down
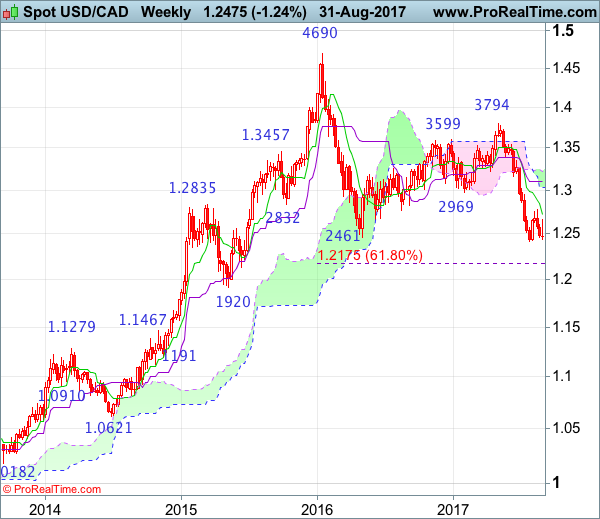
USD/CAD – 1.2490
Although the greenback found support at 1.2441 earlier this week and staged a rebound, renewed selling interest emerged at 1.2663 and price has retreated again, retaining our bearishness and as long as this level holds, downside bias remains for another test of 1.2441, below there would signal recent decline has resumed for retest of 1.2414. Looking ahead, once this support is penetrated, this would confirm resumption of early downtrend to 1.2350-60 and later towards 1.2300 but price should stay well above 1.2240-50, risk from there has increased for a rebound to take place later.
On the upside, expect recovery to be limited to 1.2590-00 and bring another decline later. A break of said resistance at 1.2663 would signal recent downtrend is not ready to resume yet and further consolidation would take place, hence another corrective bounce to 1.2700-10 cannot be ruled out, break there would risk test of previous resistance at 1.2778, having said that, only break of this level would abort and bring retracement of recent decline to 1.2810-20 but price should falter below previous support at 1.2859 (now resistance) and bring another decline later. Looking ahead, only a sustained breach above this level would signal a temporary low is formed instead, bring retracement of recent decline to 1.2900-05 but price should falter well below resistance at 1.3015, bring another selloff later.
Recommendation: Hold short entered at 1.2640 for 1.2440 with stop above 1.2665.
On the weekly chart, although the greenback recovered after holding above recent low at 1.2414 and further consolidation would be seen, reckon upside would be limited to 1.2660-65 and bring another decline, below 1.2441 would bring retest of 1.2414, however, break there is needed to confirm the selloff from 1.4690 top has resumed and extend weakness to 1.2300-10 but oversold condition should prevent sharp fall below 1.2240-50 and price should stay above 1.2175 (61.8% Fibonacci retracement of 1.0621-1.4690), risk from there is seen for another corrective rebound to take place later.
On the upside, whilst recovery to 1.2590-00 cannot be ruled out, said resistance at 1.2663 should hold and bring another decline later. A break of this level would prolong consolidation above 1.2414 and risk rebound towards resistance at 1.2778, above there would risk a stronger corrective bounce to 1.2805-10 resistance, then test of previous support at 1.2859 (now resistance), above there would suggest a temporary low has been formed instead, bring further gain to 1.2900, then towards resistance at 1.2944 but upside should be limited to psychological level at 1.3000 and price should falter below the Kijun-Sen (now at 1.3104), bring another selloff in late Q3.
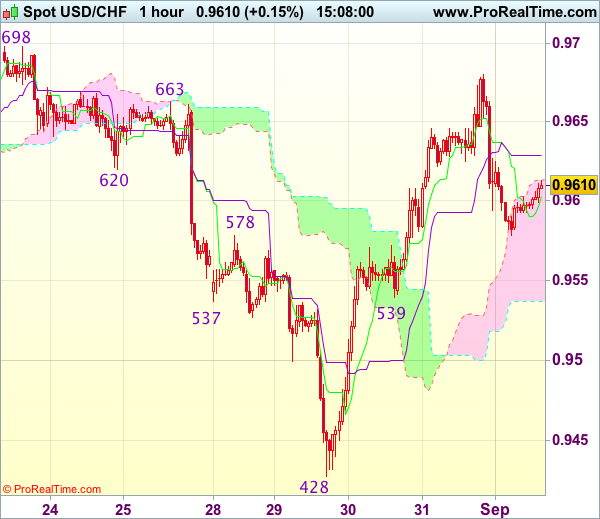
Trade Idea : USD/CHF – Buy at 0.9540
USD/CHF - 0.9609
Most recent candlesticks pattern : N/A
Trend : Down
Tenkan-Sen level : 0.9603
Kijun-Sen level : 0.9629
Ichimoku cloud top : 0.9613
Ichimoku cloud bottom : 0.9537
Original strategy :
Buy at 0.9540, Target: 0.9640, Stop: 0.9505
Position : -
Target : -
Stop : -
New strategy :
Buy at 0.9540, Target: 0.9640, Stop: 0.9505
Position : -
Target : -
Stop : -
Dollar’s retreat after yesterday’s rise to 0.9680 suggests minor consolidation below this level would be seen and pullback to 0.9570-75 is likely, however, reckon downside would be limited to support t 0.9539 and bring another rise later, above 0.9650 would bring test of said intra-day resistance at 0.9680, break there would extend the rise from 0.9428 low to previous resistance at 0.9698-99 but overbought condition should limit upside and reckon 0.9725-30 would hold on first testing.
In view of this, we are looking to buy dollar on further subsequent pullback as 0.9539 support should limit downside and bring another rebound later. Below 0.9500-10 would defer and suggest first leg of rise from 0.9428 has ended, risk weakness to 0.9470 but price should stay well above said support at 0.9428, bring another rebound.
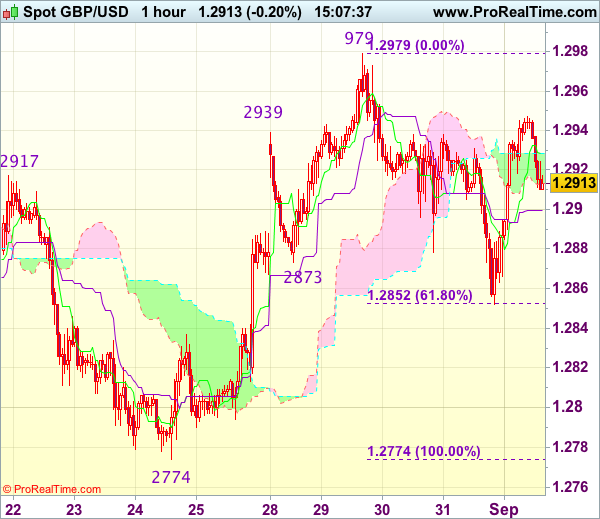
Trade Idea : GBP/USD – Hold long entered at 1.2855
GBP/USD - 1.2912
Most recent candlesticks pattern : N/A
Trend : Near term up
Tenkan-Sen level : 1.2927
Kijun-Sen level : 1.2900
Ichimoku cloud top : 1.2929
Ichimoku cloud bottom : 1.2913
Original strategy :
Bought at 1.2855, Target: 1.2955, Stop: 1.2820
Position : - Long at 1.2855
Target : - 1.2955
Stop : - 1.2820
New strategy :
Hold long entered at 1.2855, Target: 1.2955, Stop: 1.2875
Position : - Long at 1.2855
Target : - 1.2955
Stop : - 1.2875
As cable found renewed buying interest at 1.2852 in line with our bullish expectation and has rebounded, retaining prospect for another rebound to 1.2955-60, however, break of this week’s high of 1.2979 is needed to signal early rise from 1.2774 has resumed and extend gain towards 1.3000 which is likely to hold on first testing and price should falter below previous resistance at 1.3032.
In view of this, we are holding on to our long position entered at 1.2855. Below 1.2975-80 would risk retest of said support at 1.2852 but only break there would shift risk back to downside for the fall from 1.2979 to extend weakness to previous resistance at 1.2837 and possibly towards 1.2800-10 but support at 1.2774 should remain intact.
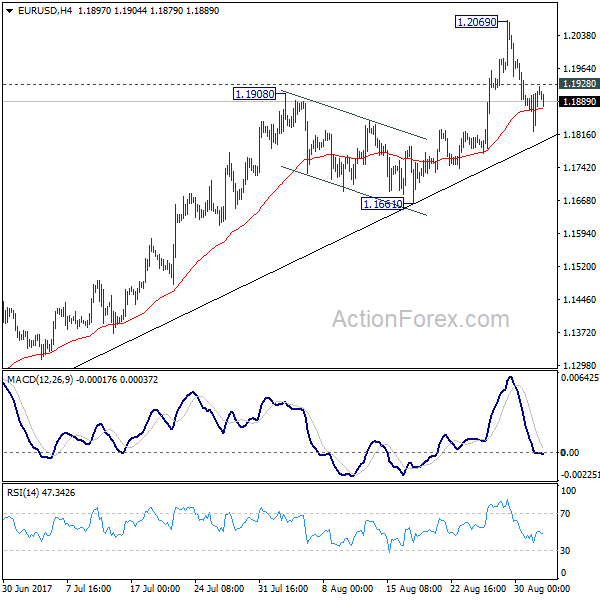
EUR/USD Daily Outlook
Daily Pivots: (S1) 1.1850; (P) 1.1881 (R1) 1.1939; More...
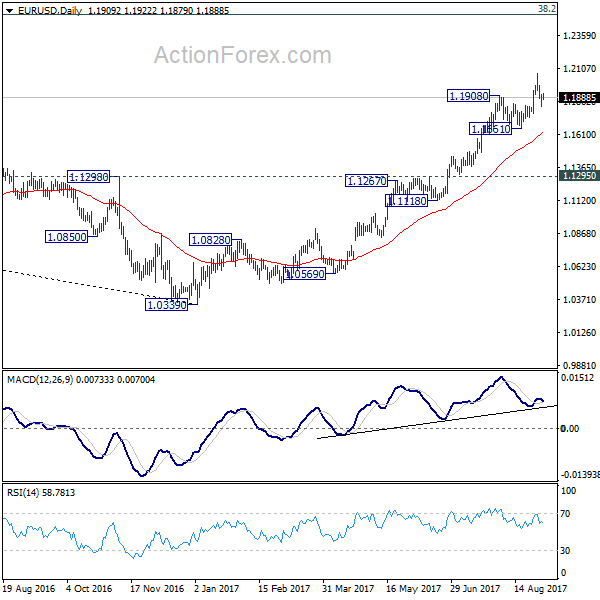
Intraday bias in EUR/USD remains neutral for the moment. While the pull back from 1.2069 is deep, it's held well above 1.1661 support. Thus, near term outlook remains bullish and further rise is expected. Above 1.1928 minor resistance will turn intraday bias back to the upside for retesting 1.2069 high first. Decisive break there will resume whole up trend from 1.0339. This will remain the preferred case as long as 1.1661 holds. However, firm break of 1.1661 will confirm short term topping and bring deeper pull back.
In the bigger picture, an important bottom was formed at 1.0339 on bullish convergence condition in weekly MACD. Sustained trading above 55 month EMA (now at 1.1768) will pave the way to key fibonacci level at 38.2% retracement of 1.6039 (2008 high) to 1.0339 (2017 low) at 1.2516. While rise from 1.0339 is strong, there is no confirmation that it's developing into a long term up trend yet. Hence, we'll be cautious on strong resistance from 1.2516 to limit upside. For now, medium term outlook will remain bullish as long as 1.1295 support holds, in case of pull back.
Trade Idea : EUR/USD – Sell at 1.1975
EUR/USD - 1.1888
Most recent candlesticks pattern : N/A
Trend : Up
Tenkan-Sen level : 1.1897
Kijun-Sen level : 1.1873
Ichimoku cloud top : 1.1970
Ichimoku cloud bottom : 1.1905
Original strategy :
Sell at 1.1950, Target: 1.1850, Stop: 1.1985
Position : -
Target : -
Stop : -
New strategy :
Sell at 1.1975, Target: 1.1850, Stop: 1.2010
Position : -
Target : -
Stop : -
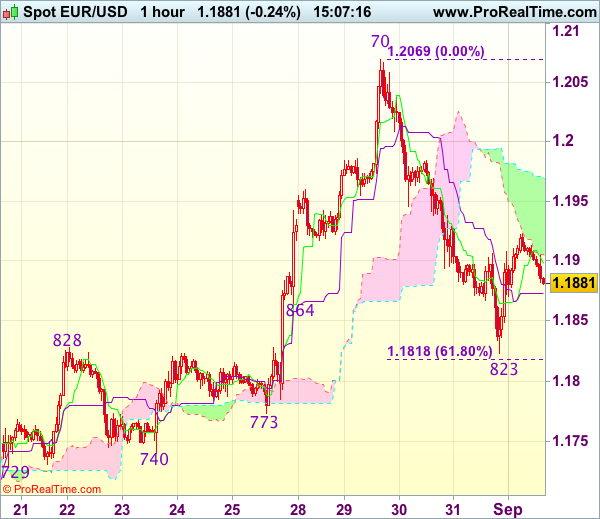
As the single currency found support after falling to 1.1823 yesterday, suggesting consolidation above this level would be seen and corrective bounce to 1.1930-40 is likely, however, reckon upside would be limited to 1.1975-80 and bring another decline to 1.1815-18 (61.8% Fibonacci retracement of 1.1662-1.2070) but downside should be limited to 1.1790-00 and support at 1.1773 should remain intact.
In view of this, we are looking to sell euro on further subsequent recovery as 1.1975-80 should limit upside. Above 1.2000 would risk a stronger rebound to 1.2025-30 but still reckon upside would be limited to 1.2050 and price should falter below said this week’s high at 1.2070, bring another retreat later.
USDCAD Neutral In Near-Term, Maintains Underlying Bearish Picture
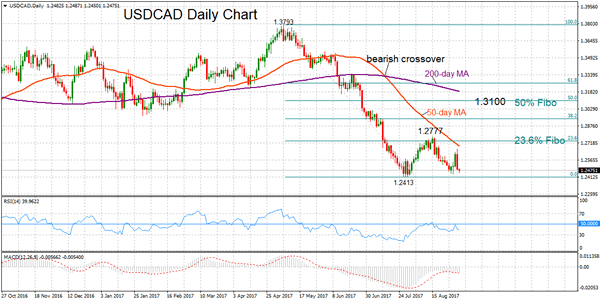
USDCAD remains bearish in the medium-term and neutral in the short-term after the pause in the downtrend that started from the May 5 high of 1.3793 to the July 27 low of 1.2413. Technical indicators are confirming the bearish picture.
The pair has been trading between 1.2413 and 1.2777 since the end of July as these two levels have provided support and resistance. A break below 1.2413 would deliver additional pressure and risk pushing USDCAD towards the next major trough at 1.1919 (May 2015 low).
For now the odds of a further decline from current levels have diminished since the daily momentum signals have softened back to neutral (both MACD and RSI are moving sideways). Strong rejection of the low 1.24-area in late July and a bounce ahead of this level this week suggests that the market is now in a consolidation phase in the near term with scope to rise back towards the 1.2777 high. This is an important resistance level which is near the 23.6% Fibonacci retracement of the downleg from 1.3793 to 1.2413. USDCAD could see a move towards the next Fibonacci level (38.2%) at 1.2938 on a break of 1.2777 and indicate downside pressure has eased. But only a move above 1.3100 (50% Fibonacci) would change the bearish picture to a more bullish one.
The bearish crossover of the 50-day with the 200-day moving average on July 13 keeps the risk to the downside for the medium-term outlook but USDCAD is neutral in the short-term.
Trade Idea : USD/JPY – Buy at 109.55
USD/JPY - 110.21
Most recent candlesticks pattern : N/A
Trend : Near term up
Tenkan-Sen level : 110.10
Kijun-Sen level : 110.28
Ichimoku cloud top : 110.27
Ichimoku cloud bottom : 109.44
Original strategy :
Buy at 109.55, Target: 110.80, Stop: 109.20
Position : -
Target : -
Stop : -
New strategy :
Buy at 109.55, Target: 110.80, Stop: 109.20
Position : -
Target : -
Stop : -
Dollar’s retreat after rising to 110.67 yesterday suggests consolidation below this level would be seen and pullback to 109.85-90 (previous resistance, now support) is likely, however, reckon support at 109.54 would limit downside and bring another rise later, above said resistance would add credence to our view that recent decline from 114.50 has ended at 108.27, then headway to resistance at 110.95 would follow but reckon upside would be limited to 111.15-20 and price should falter below 111.40 (approx. 50% Fibonacci retracement of 114.50-108.27).
In view of this, would not chase this rise here and we are looking to buy dollar on pullback as said support at 109.54 would limit downside and bring another rebound later. A firm break below this support would abort and signal top has been formed, risk weakness to 109.15-20 (61.8% Fibonacci retracement of 108.27-110.67).

GBP/USD Daily Outlook
Daily Pivots: (S1) 1.2877; (P) 1.2906; (R1) 1.2960; More...
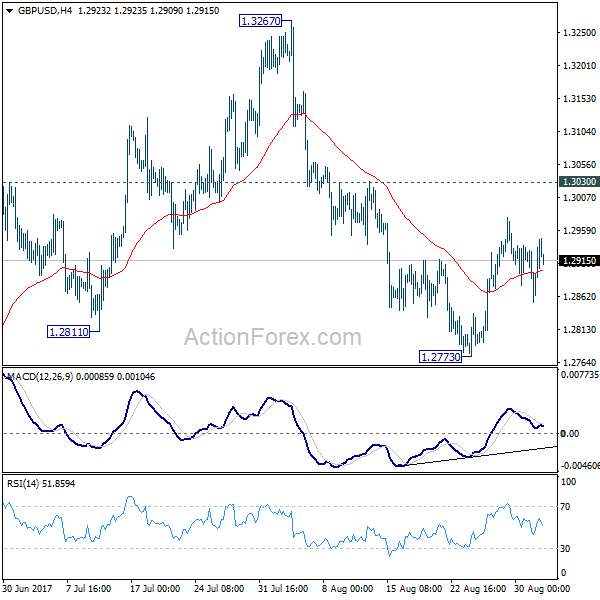
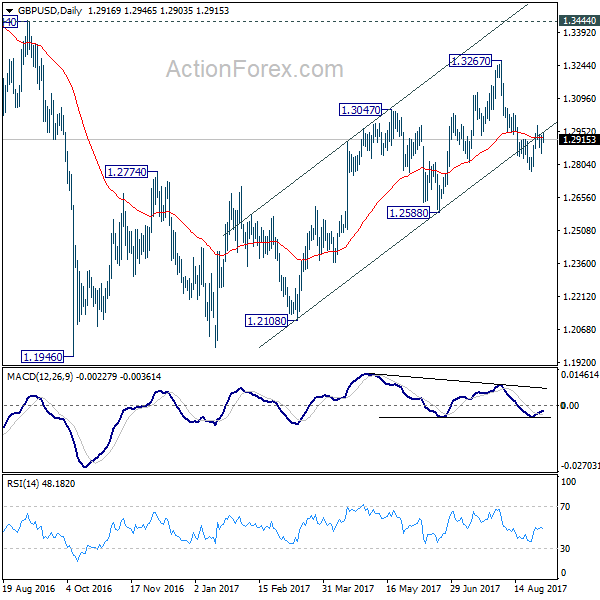
GBP/USD is staying in consolidation from 1.2773 and intraday bias remains neutral for the moment. With 1.3030 resistance intact, there is no change in the bearish outlook. We're favoring the case that correction from 1.1946 is completed at 1.3267. Below 1.2773 will target 1.2588 key near term support first. Decisive break of 1.2588 will confirm our view and target a test on 1.1946 low. Though, break of 1.3030 will dampen this bearish view and turn bias back to the upside for retesting 1.3267.
In the bigger picture, overall, price actions from 1.1946 medium term low are seen as a corrective pattern. While further rise cannot be ruled out, larger outlook remains bearish as long as 1.3444 key resistance holds. Down trend from 1.7190 (2014 high) is expected to resume later after the correction completes. And break of 1.2588 will indicate that such down trend is resuming.
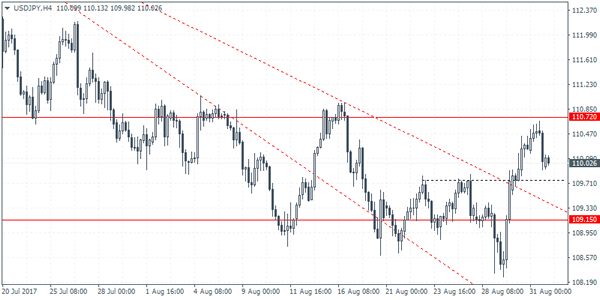
USDJPY Intraday Analysis
USDJPY (110.02): The USDJPY rallied to an 11-day high yesterday before closing on a weaker note. Price action remains bullish, trading above 109.15 support. In the near term, USDJPY is seen falling to the breakout level of the falling trend line at 109.75. A reversal here could signal potential upside in the US dollar. However, this needs to be followed through by a breakout of the resistance at 109.75. This will most likely give way for USDJPY to retest the next resistance level at 113.00. To the downside, in the event of a break down below 109.75, expect some consolidation up to 109.15.