Sample Category Title
US Inflation Data Disappoints
Thursday saw the release, by the US Department of Labor, of Weekly Jobless Claims that came in in-line with expectations at 236K, underscoring a strong labor market. More importantly, US Core Consumption Expenditure came in at 1.4% annualized, decreasing from the previous release of 1.5%. As the preferred measure of inflation, it is drastically lower than the Fed's target of 2%. USD held steady on the back of these releases but was put under downward pressure on comments from US Treasury Secretary Munchin who said a weaker currency is “somewhat better” for trade.
With Tropical Storm Harvey causing the closure of several key gasoline pipelines, the price of Gasoline has risen by more than 10 cents compared to a week ago. This increase is likely to result in a higher Consumption Expenditure in September but the increase is likely to be short lived as the Gulf States rebuild.
Markets will be focusing on today's Nonfarm Payroll, Unemployment and, more importantly, Average Earnings releases to gauge the strength of the US economy. The Nonfarm Payroll report is the last before the next FOMC policy meeting and is likely to determine the timing of the Fed's next rate hike.
EURUSD was little changed overnight, currently trading around 1.1890.
USDJPY is currently trading near to Friday's high around 110.14.
GBPUSD is currently trading towards the day's low around 1.2915.
Gold recovered from recent losses, trading as high as $1,321.98 in early trading. With tensions simmering between the US & North Korea the markets appear to be entering the traditional safe haven that is Gold. Currently, Gold is trading around $1,320.
WTI will continue to be influenced by the devastation caused in the US by Tropical Storm Harvey. Estimates suggest that the closure of many refineries has resulted in the loss of 4.4 million barrels a day of refining capacity. With refining being affected more than production WTI continues to see downward pressure and currently trades around $47.35pb.
At 13:30 BST, the US Department of Labor releases; Nonfarm Payrolls, Average Hourly Earnings (MoM & YoY) and Unemployment for August. The recent positive trend in NFP releases continued in July with 209,000 new positions added which helped reduce the unemployment rate to 4.3%. NFP for August, per market consensus, is expected to come in at 180,000, underscoring a strong US Labour Market. The markets will also be closely watching the Average Hourly Earnings release with many hoping to see an improvement on the previous two readings of 2.5%. Average earnings need to increase for consumer spending to rise, which will then help increase inflationary pressure. Analysis indicates that the market-implied probability that the Fed raises rates by year-end is around 30%. Fed funds futures are not fully pricing in another 0.25% rate hike until September 2018.
Forex Technical Analysis: EUR/USD, USD/JPY, GBP/USD
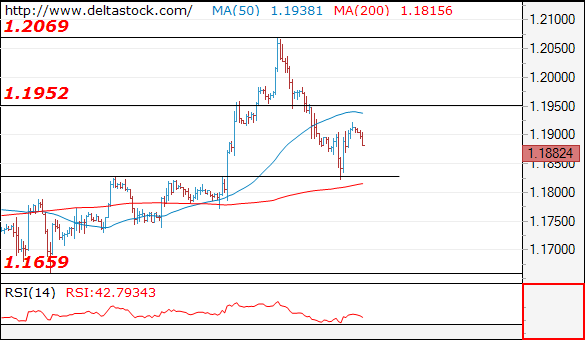
EUR/USD
Current level - 1.1882
Yesterday's test of 1.1830 support shows a reversal of the whole slide since 1.2070 peak and the bias is already positive, for rise towards 1.1950 area. Initial minor support lies at 1.1860.
| Resistance | Support | ||
| intraday | intraweek | intraday | intraweek |
|
1.1950 |
1.2070 |
1.1860 |
1.1830 |
|
1.2070 |
1.2160 |
1.1830 |
1.1580 |
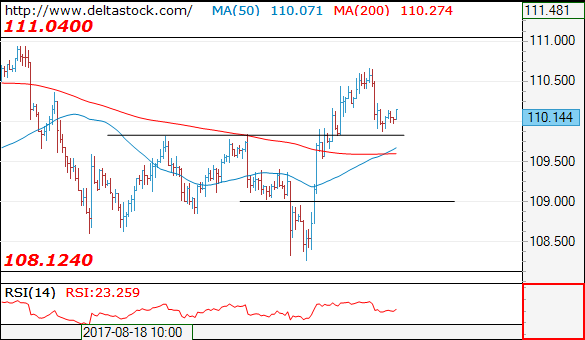
USD/JPY
Current level - 110.14
The bias has switched to negative and my outlook is bearish below 110.40, for a break through 109.80, towards 109.00 area.
| Resistance | Support | ||
| intraday | intraweek | intraday | intraweek |
|
110.40 |
111.00 |
109.80 |
108.10 |
|
111.00 |
112.20 |
109.00 |
107.00 |
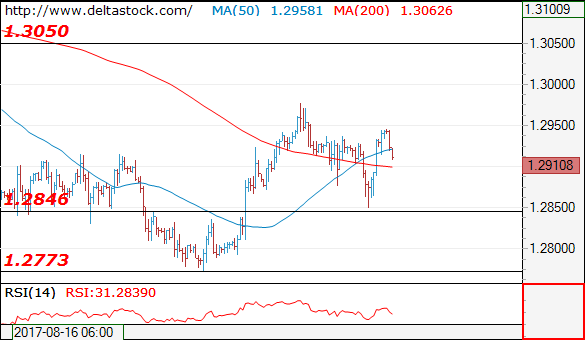
GBP/USD
Current level - 1.2910
The test at 1.2846 has failed and the bias is positive, for a rise towards 1.3050.
| Resistance | Support | ||
| intraday | intraweek | intraday | intraweek |
|
1.2980 |
1.3157 |
1.2846 |
1.2773 |
|
1.3050 |
1.3260 |
1.2773 |
1.2606 |
EUR/JPY Daily Outlook
Daily Pivots: (S1) 130.57; (P) 131.07; (R1) 131.45; More...
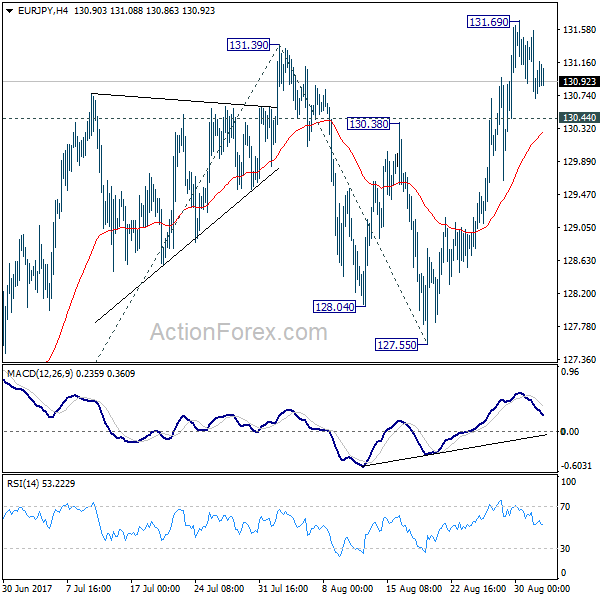
A temporary top is in place at 131.69 and intraday bias is turned neutral first. Near term outlook in EUR/JPY will remain bullish as long as 127.55 support holds. Break of 131.69 will extend the larger rally to 61.8% projection of 122.39 to 131.39 from 127.55 at 133.11 next.
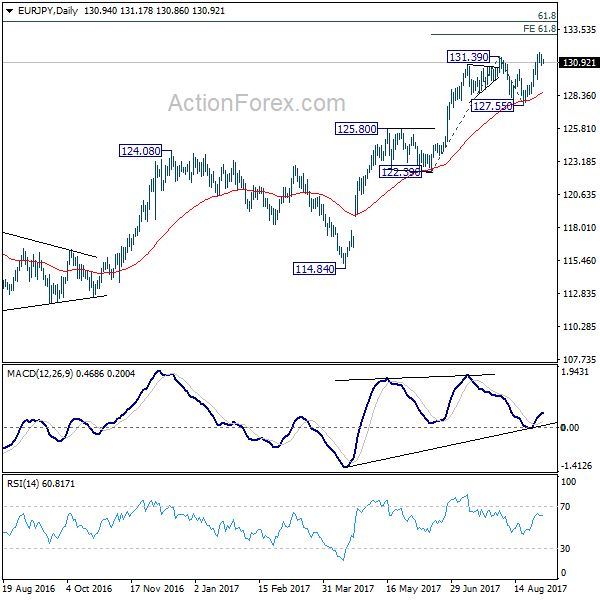
In the bigger picture, the down trend from 149.76 (2014 high) is completed at 109.03 (2016 low). Current rally from 109.03 should be at the same degree as the fall from 149.76 to 109.03. Further rise is expected to 61.8% retracement of 149.76 to 109.03 at 134.20. Sustained break there will pave the way to key long term resistance zone at 141.04/149.76. Medium term outlook will remain bullish as long as 124.08 resistance turned support holds. However, firm break of 124.08 will argue that rise from 109.03 is completed and turn outlook bearish.
GBP/JPY Daily Outlook
Daily Pivots: (S1) 141.51; (P) 142.20; (R1) 142.90; More
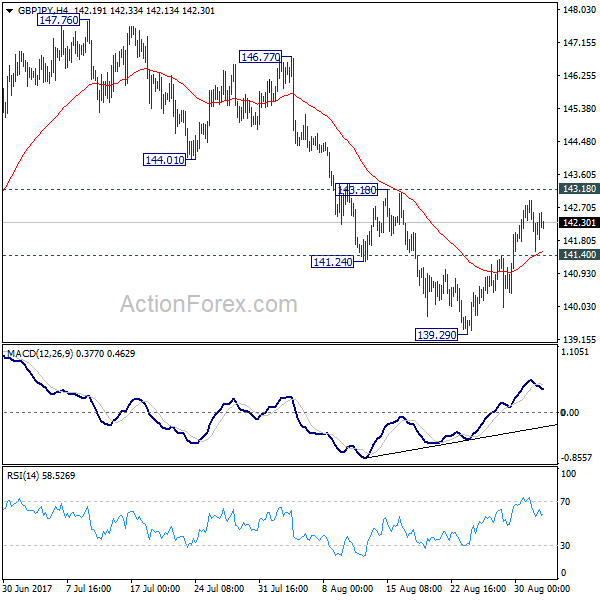
Intraday bias in GBP/JPY remains neutral for the moment. With 143.18 intact, near term outlook stays bearish and deeper decline is in favor. Below 141.40 minor support will turn bias back to the downside first. Break of 139.29 will target 135.58 key support level. At this point, price actions from 148.42 are seen as a sideway consolidation pattern. Hence, we'll expect strong support from 135.58 to contain downside and bring rebound. Meanwhile, break of 143.18 will indicate short term reversal and turn bias back to the upside.
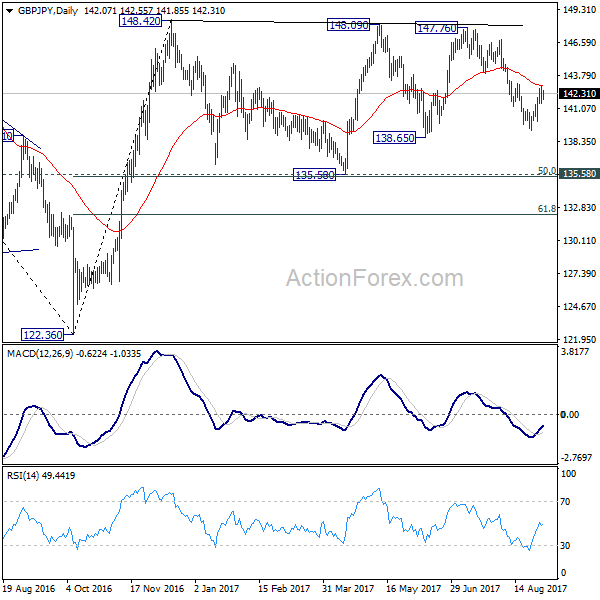
In the bigger picture, the sideway pattern from 148.42 is extending with another leg. We'd expect strong support from 135.58 and 50% retracement of 122.36 to 148.42 at 135.39 to contain downside. Medium term rise from 122.36 is still expected to resume later. And break of 38.2% retracement of 196.85 to 122.36 at 150.43 will carry long term bullish implications. However, firm break of 135.58/39 will dampen the bullish view and turn focus back to 122.36 low.
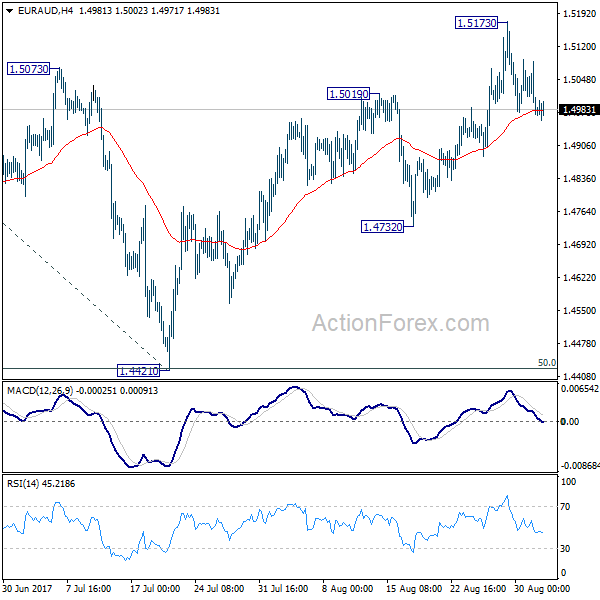
EUR/AUD Daily Outlook
Daily Pivots: (S1) 1.4941; (P) 1.5014; (R1) 1.5057; More....
Intraday bias in EUR/AUD remains neutral for the moment. We're holding on to the bullish view that correction from 1.5226 has completed with three waves down to 1.4421. Further rise is expected and above 1.5173 will target retesting 1.5226 first. Break there will resume whole rebound from 1.3624 and target 61.8% projection of 1.3624 to 1.5226 from 1.4421 at 1.5411 next. Outlook will remain unchanged as long as 1.4732 support holds.
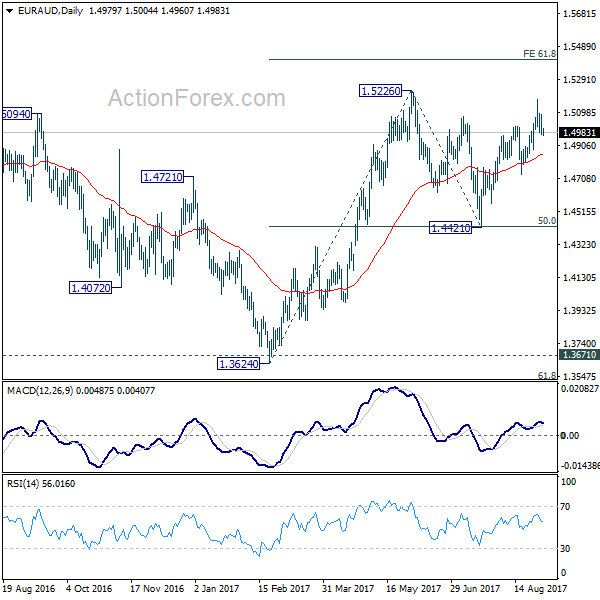
In the bigger picture, we're holding on to the view that corrective decline from 1.6587 medium term has completed at 1.3624. Rise from 1.3624 is expected to extend to retest 1.6587. The corrective structure of the fall from 1.5226 is affirming this view. Above 1.5226 will target a test on 1.6587 key resistance. However, break of 1.4421 will dampen our view and would drag EUR/AUD lower to retest key support zone around 1.3624.
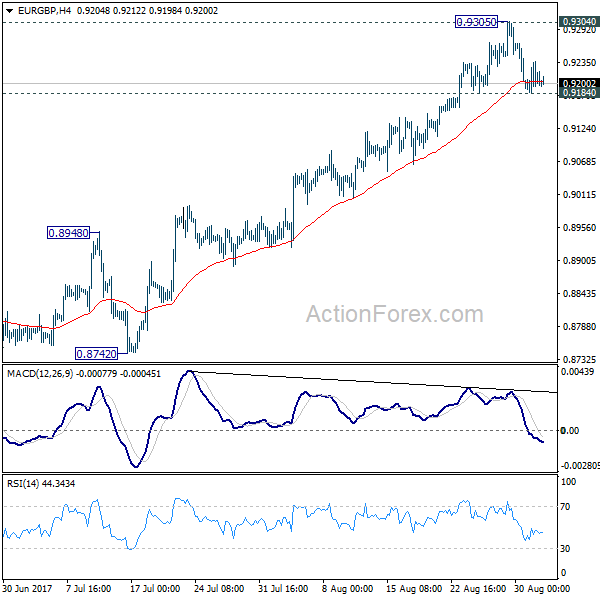
EUR/GBP Daily Outlook
Daily Pivots: (S1) 0.9182; (P) 0.9210; (R1) 0.9234; More
Intraday bias in EUR/GBP is neutral for the moment. We'd stay cautious on rejection from 0.9304 to extend the medium term consolidation pattern. Break of 0.9184 minor support will turn bias back to the downside for pull back to 55 day EMA (now at 0.8986). However, sustained break of 0.9304 will confirm up trend resumption and pave the way to 0.9799.
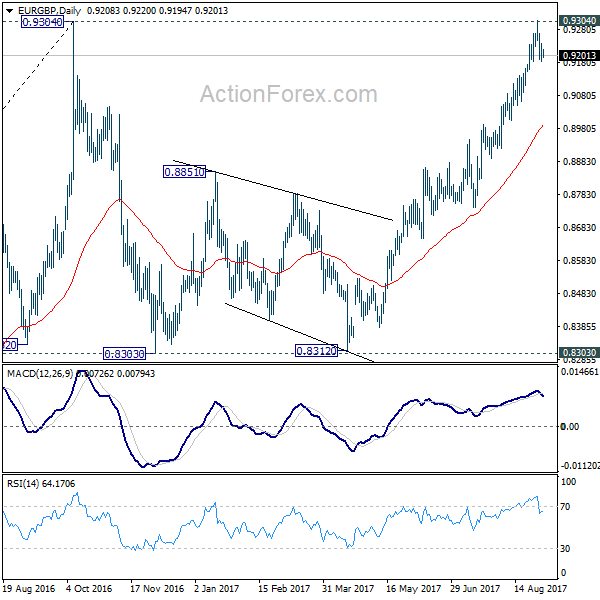
In the bigger picture, price actions from 0.9304 are viewed as a medium term corrective pattern. It's uncertain whether it is finished yet. But in case of another fall, we'd expect strong support from 0.8116 cluster support (50% retracement of 0.6935 to 0.9304 at 0.8120) to contain downside and bring rebound. Whole up trend from 0.6935 is expected to resume after consolidation from 0.9304 completes. Firm break of 0.9799 high will target 61.8% projection of 0.5680 to 0.9799 from 0.6935 at 1.1054.
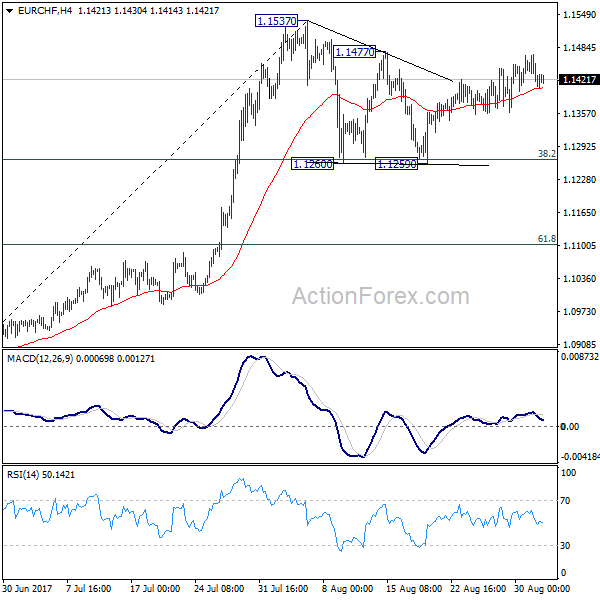
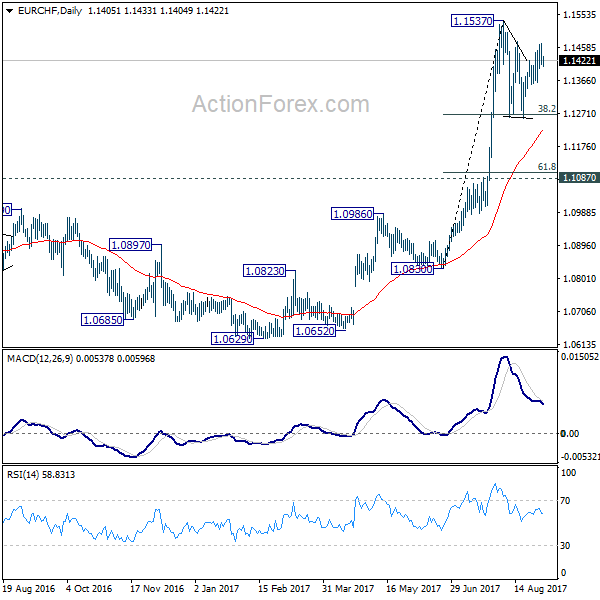
EUR/CHF Daily Outlook
Daily Pivots: (S1) 1.1392; (P) 1.1431; (R1) 1.1454; More...
At this point. EUR/CHF is staying below 1.1477 minor resistance and intraday bias remains neutral first. Consolidation from 1.1537 could extend but downside should be contained by 38.2% retracement of 1.0830 to 1.1537 at 1.1267 to bring rebound. Break of 1.1477 resistance will argue that the consolidation from 1.1537 has completed and larger rise is resuming. Further break of 1.1537 will confirm and target 1.2 key resistance level next.
In the bigger picture, firm break of 1.1198 key resistance confirms resumption of the long term rise from SNB spike low back in 2015. In this case, EUR/CHF would eventually head back to prior SNB imposed floor at 1.2000. For now, this will be the favored case as long as 1.1087 resistance turned support holds.
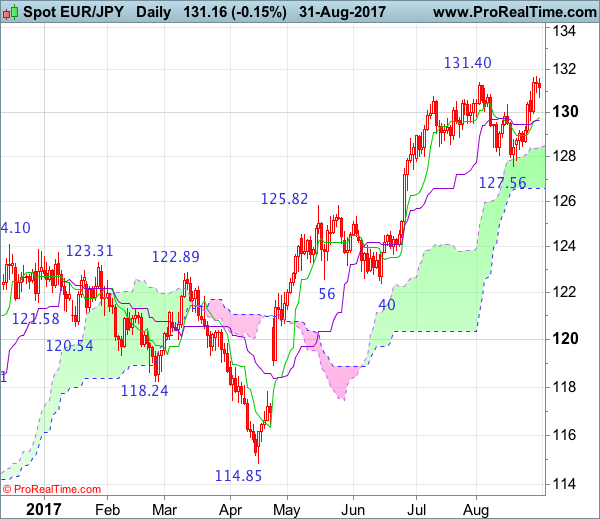
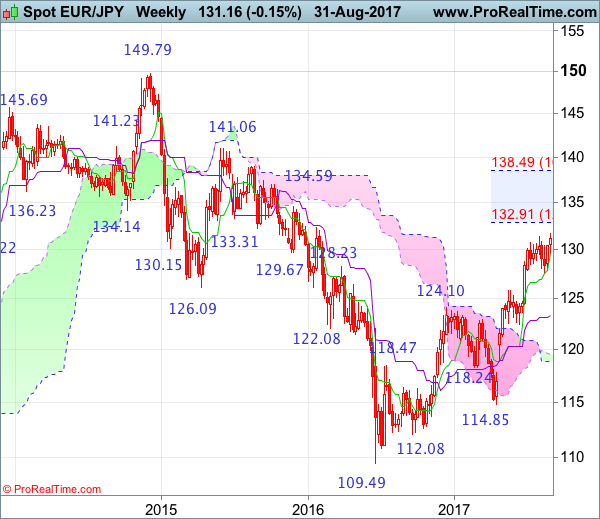
EUR/JPY Candlesticks and Ichimoku Analysis
Weekly
• Last Candlesticks pattern: Window
• Time of formation: 24 April 2017
• Trend bias: Up
Daily
• Last Candlesticks pattern: Hammer
• Time of formation: 18 May 2017
• Trend bias: Up
EUR/JPY – 130.93
Although the single currency finally resumed recent upmove as the pair broke above previous resistance at 131.40, lack of follow through buying suggests minor consolidation would be seen and pullback to 130.50, then 129.95-00 cannot be ruled out, however, reckon 129.64-66 (current level of the Kijun-Sen and previous support) would limit downside. A daily close below this level would risk retreat to 129.00-10 but break of 128.45-50 is needed to signal a temporary top is possibly formed, bring weakness towards support at 127.56 which is likely to hold from here.
On the upside, above resistance at 131.71 would signal recent upmove is still in progress and may extend headway to 132.00-10, then 132.50-60, however, near term overbought condition would limit upside to 133.10-15 (61.8% projection of 122.40-131.40 measuring from 127.56) and reckon 133.50-60 would hold from here, price should falter well below 134.00-10, risk from there has increased for a retreat to take place later.
Recommendation: Stand aside for this week.
On the weekly chart, as the single currency found renewed buying interest at 127.56 and has finally resumed recent upmove, adding credence to our bullish view that the erratic upmove from 109.49 (2016 low) is still in progress, hence upside bias remains for this move to extend headway to previous chart resistance at 132.33, however, overbought condition should limit upside to 133.10-15 (61.8% projection of 122.40-131.40 measuring from 127.56) and price should falter well below 134.40 (61.8% Fibonacci retracement of entire fall from 149.79-109.49), risk from there is seen for a retreat to take place later.
On the downside, whilst initial pullback to 130.00-10, then the Tenkan-Sen (now at 129.64) cannot be ruled out, reckon 129.66 support would limit downside and bring another rise later. Below 129.00-10 would bring test of 128.45-50 but break of latter level is needed to suggest a temporary top is possibly formed, bring weakness towards support at 127.56 which is likely to hold on first testing. Only a drop below this level would provide confirmation, bring retracement of recent upmove to 126.70-80, then towards 126.00-10 but previous resistance at 125.81 should turn into support and limit euro’s downside.
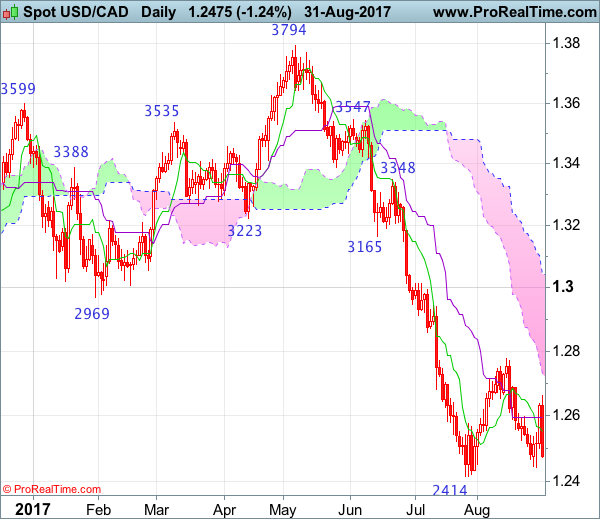
USD/CAD Candlesticks and Ichimoku Analysis
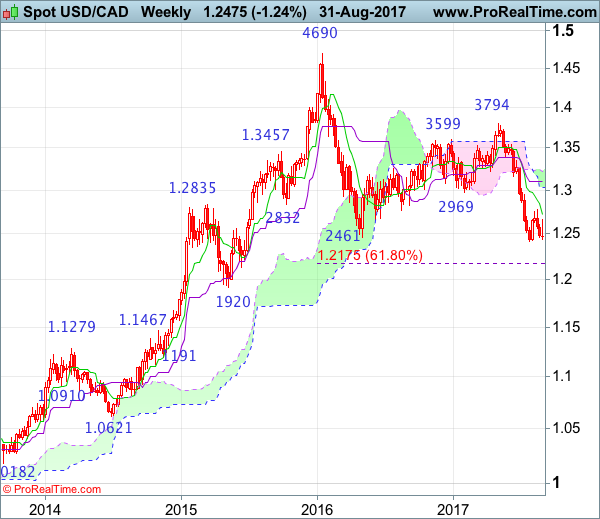
Weekly
• Last Candlesticks pattern: Shooting doji
• Time of formation: 01 May 2017
• Trend bias: Sideways
Daily
• Last Candlesticks pattern: Bearish engulfing
• Time of formation: 5 May 2017
• Trend bias: Down
USD/CAD – 1.2490
Although the greenback found support at 1.2441 earlier this week and staged a rebound, renewed selling interest emerged at 1.2663 and price has retreated again, retaining our bearishness and as long as this level holds, downside bias remains for another test of 1.2441, below there would signal recent decline has resumed for retest of 1.2414. Looking ahead, once this support is penetrated, this would confirm resumption of early downtrend to 1.2350-60 and later towards 1.2300 but price should stay well above 1.2240-50, risk from there has increased for a rebound to take place later.
On the upside, expect recovery to be limited to 1.2590-00 and bring another decline later. A break of said resistance at 1.2663 would signal recent downtrend is not ready to resume yet and further consolidation would take place, hence another corrective bounce to 1.2700-10 cannot be ruled out, break there would risk test of previous resistance at 1.2778, having said that, only break of this level would abort and bring retracement of recent decline to 1.2810-20 but price should falter below previous support at 1.2859 (now resistance) and bring another decline later. Looking ahead, only a sustained breach above this level would signal a temporary low is formed instead, bring retracement of recent decline to 1.2900-05 but price should falter well below resistance at 1.3015, bring another selloff later.
Recommendation: Hold short entered at 1.2640 for 1.2440 with stop above 1.2665.
On the weekly chart, although the greenback recovered after holding above recent low at 1.2414 and further consolidation would be seen, reckon upside would be limited to 1.2660-65 and bring another decline, below 1.2441 would bring retest of 1.2414, however, break there is needed to confirm the selloff from 1.4690 top has resumed and extend weakness to 1.2300-10 but oversold condition should prevent sharp fall below 1.2240-50 and price should stay above 1.2175 (61.8% Fibonacci retracement of 1.0621-1.4690), risk from there is seen for another corrective rebound to take place later.
On the upside, whilst recovery to 1.2590-00 cannot be ruled out, said resistance at 1.2663 should hold and bring another decline later. A break of this level would prolong consolidation above 1.2414 and risk rebound towards resistance at 1.2778, above there would risk a stronger corrective bounce to 1.2805-10 resistance, then test of previous support at 1.2859 (now resistance), above there would suggest a temporary low has been formed instead, bring further gain to 1.2900, then towards resistance at 1.2944 but upside should be limited to psychological level at 1.3000 and price should falter below the Kijun-Sen (now at 1.3104), bring another selloff in late Q3.
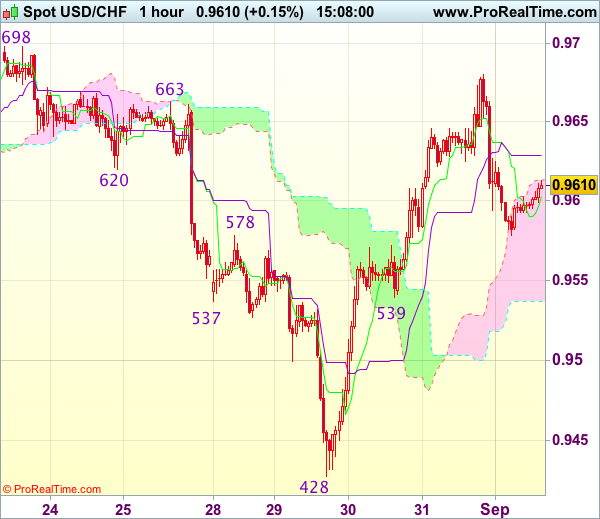
Trade Idea : USD/CHF – Buy at 0.9540
USD/CHF - 0.9609
Most recent candlesticks pattern : N/A
Trend : Down
Tenkan-Sen level : 0.9603
Kijun-Sen level : 0.9629
Ichimoku cloud top : 0.9613
Ichimoku cloud bottom : 0.9537
Original strategy :
Buy at 0.9540, Target: 0.9640, Stop: 0.9505
Position : -
Target : -
Stop : -
New strategy :
Buy at 0.9540, Target: 0.9640, Stop: 0.9505
Position : -
Target : -
Stop : -
Dollar’s retreat after yesterday’s rise to 0.9680 suggests minor consolidation below this level would be seen and pullback to 0.9570-75 is likely, however, reckon downside would be limited to support t 0.9539 and bring another rise later, above 0.9650 would bring test of said intra-day resistance at 0.9680, break there would extend the rise from 0.9428 low to previous resistance at 0.9698-99 but overbought condition should limit upside and reckon 0.9725-30 would hold on first testing.
In view of this, we are looking to buy dollar on further subsequent pullback as 0.9539 support should limit downside and bring another rebound later. Below 0.9500-10 would defer and suggest first leg of rise from 0.9428 has ended, risk weakness to 0.9470 but price should stay well above said support at 0.9428, bring another rebound.