Sample Category Title
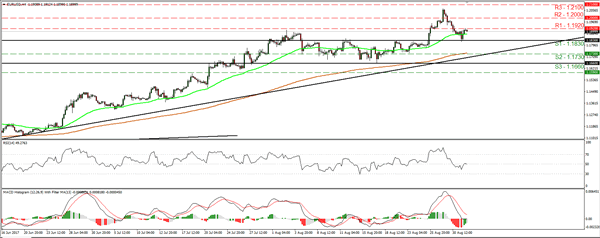
USD/CHF Elliott Wave Analysis
USD/CHF – 0.9600
Although the greenback resumed recent decline as the pair dropped below previous support at 0.9438 earlier this week, lack of follow through selling and the subsequent strong rebound from 0.9428 suggest consolidation above this level would be seen and gain to resistance at 0.9698-99 cannot be ruled out, however, break of resistance at 0.9773 is needed to signal a temporary low has been formed at 0.9428, bring retracement of recent decline to resistance at 0.9808 later which is likely to hold on first testing.
Our preferred count on the daily chart is that early selloff to 0.9630 is an end of the larger degree wave III and major correction is unfolding from there with a leg ended at 1.2298 (Nov 2008 with (a): 1.0625, (b):1.0011 and (c):1.2298), wave b ended at 0.9910 with (a): 1.0370, (b): 1.1967, (c): 0.9910. The rise from there to 1.1730 is the wave c which also marked the end of wave IV and wave V has possibly ended at 0.7068.
On the downside, whilst initial pullback to 0.9570-75 cannot be ruled out, reckon downside would be limited to support at 0.9539 and bring another rebound later. Below 0.9490-00 would dampen this near term bullish view and suggest the rebound from 0.9428 has ended, bring another test of this level later. A drop below this level would signal medium term erratic decline from 1.0344 top (formed back in late 2016) is still in progress for further weakness to 0.9350-60, however, loss of downward momentum should prevent sharp fall below 0.9300-10 and 0.9200-10 should hold, risk from there has increased for a rebound to take place later.
Recommendation: Buy at 0.9540 for 0.9740 with stop below 0.9440
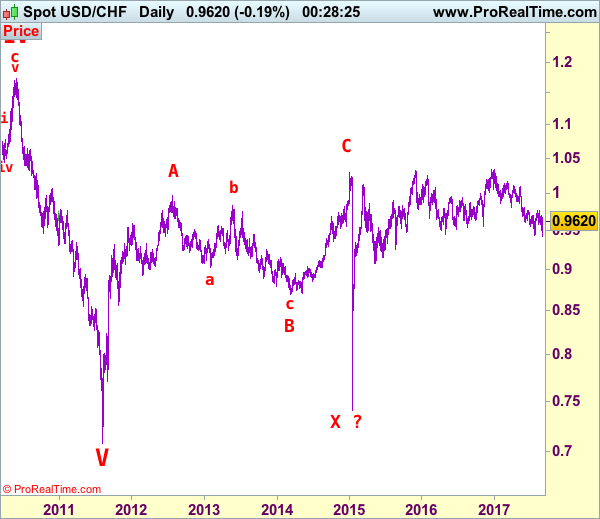
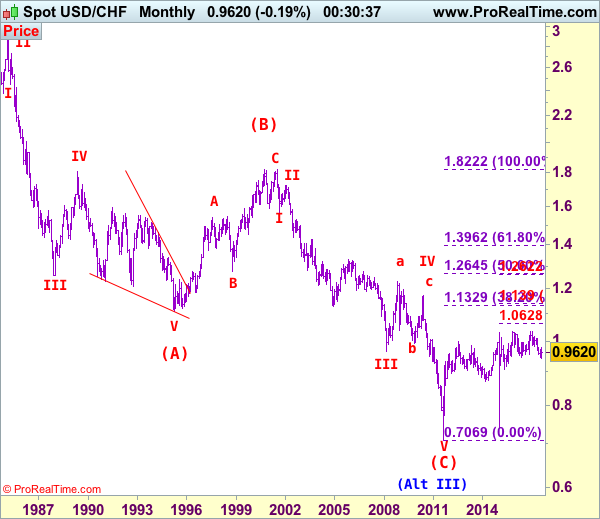
Dollar's long-term downtrend started from 2.9343 (Feb 1995) and it was unfolding as a (A)-(B)-(C) with (A): 1.1100, (B): 1.8310 (26 Oct 2000), then followed by another impulsive wave (C) with wave III ended at 0.9630 (Mar 2008). Under this count, correction in wave IV has possibly ended at 1.1730 and wave V already broke below support at 0.9630 and met indicated downside target at 0.7500 and 0.7400. The reversal from 0.7068 suggests the wave V has possibly ended and the breach of resistance at 0.9595 add credence to this view and indicated upside target at 1.0000 had been met, however, the sharp retreat from 1.0296 to 0.7401 suggests choppy trading would be seen but price should stay above said record low at 0.7068.
Market Update – European Session: UK PMI Manufacturing Beats Expectations
Notes/Observations
Focus on upcoming US payroll data for clarity of a possible 3rd rate hike this year as recent data suggest improving US fundamentals
Major European Manufacturing data remains in growth territory (Beats: Italy, UK Misses: Germany, Sweden, Norway; In-line: France and Euro Zone)
Overnight
Asia:
Japan Aug Final PMI Manufacturing: 52.2 v 52.8 prelim (confirmed 12th month of expansion)
China Aug Caixin PMI Manufacturing beat expectations to its highest level since Feb (51.6 v 51.0e)
China PBoC Research Bureau Head Xu Zhong: Reiterated 'prudent and neutral' monetary policy; China should keep tight property curbs in main cities. Property market had become major source of financial risk. Considering measures related to home mortgage loan growth to reduce volatility related to property market prices
Europe:
UK Trade Sec Liam Fox: UK must not allow itself to be blackmailed by EU over Brexit divorce bill in order to start trade talks; a bad Brexit deal would harm both UK and EU companies
German Chancellor Merkel may double urban transport infrastructure fund to up to €1.0B
Americas:
President Trump to propose initial $5.9B in Harvey aid; said to consider linking debt limit increase to Harvey aid
Treasury Sec Mnuchin: have been working with WH adviser Cohn and lawmakers on tax plan proposal, have been discussing detailed plan. September 29th remains the debt ceiling deadline. Having a weaker USD is somewhat better for trade
Economic data
(IE) Ireland Aug Manufacturing PMI: 56.1 v 54.6 prior (51st straight month of expansion and Highest reading since July 2015)
(IN) India Aug Manufacturing PMI: 51.2 v 47.9 prior
(JP) Japan Aug Domestic Vehicle Sales Y/Y: +4.7% v -1.1% prior
(JP) Japan Aug Consumer Confidence: 43.3 v 43.5e
(PE) Peru Aug CPI M/M: 0.7% v 0.4%e; Y/Y: 3.2% v 3.0%e
(FI) Finland Q2 GDP Q/Q: 0.4% v 1.1% prior; Y/Y: 3.0% v 2.9%
(RU) Russia Aug Manufacturing PMI: 51.6 v 51.8e (13th month of expansion)
(SE) Sweden Aug Manufacturing PMI: 54.7 v 60.5e
(CZ) Czech Q2 Preliminary GDP Q/Q: 2.5% v 2.3%e; Y/Y: 4.7% v 4.5%e
(NL) Netherlands Aug Manufacturing PMI: 59.7 v 58.9 prior (48th month of expansion)
(NO) Norway Aug Manufacturing PMI: 55.7 v 56.9e
(HU) Hungary Aug Manufacturing PMI: 56.6 v 56.5e (20th month of expansion)
(PL) Poland Aug Manufacturing PMI: 52.5 v 53.0e (34th month of expansion)
(ES) Spain Aug Manufacturing PMI: 52.4 v 54.4e (46th month of expansion)
(SE) Sweden Q2 Current Account (SEK): 39.5B v 47.5B prior
(CZ) Czech Aug Manufacturing PMI: 54.9 v 55.8e (12th month of expansion)
(CH) Swiss Aug Manufacturing PMI: 61.2 v 60.2e (highest since Apr 2011)
(IT) Italy Aug Manufacturing PMI: 56.3 v 55.3e (12th month of expansion)
(FR) France Aug Final Manufacturing PMI: 55.8 v 55.8e (confirm its 11th month of expansion)
(DE) Germany Aug Final Manufacturing PMI: 59.3 v 57.4e (confirms 33rd month of expansion)
(EU) Euro Zone Aug Final Manufacturing PMI: 57.4 v 57.4e (Confirms 48th straight month of growth)
(IT) Italy Q2 Final GDP (2nd reading) Q/Q: 0.4% v 0.4%e; Y/Y: 1.5% v 1.5%e
(GR) Greece Aug Manufacturing PMI: 52.2 v 50.5 prior (3rd month of expansion)
(NO) Norway Aug Unemployment Rate: 2.7% v 2.7%e
(UK) Aug PMI Manufacturing: 56.9 v 55.0e (13th month of expansion)
(ZA) South Africa Aug Manufacturing PMI: 44.0 v 42.9 prior (3rd straight contraction)
(DK) Denmark Aug Manufacturing PMI Survey: 61.1 v 63.9 prior
(GR) Greece Q2 GDP Q/Q: 0.5% v 0.2%e; Y/Y: 0.8% v 0.4% prior (2nd straight quarterly growth)
Fixed Income Issuance:
(IN) India sold total INR180B vs. INR180B indicated in 2022, 2031, 2033 and 2055 bonds
SPEAKERS/FIXED INCOME/FX/COMMODITIES/ERRATUM
Equities
Indices [Stoxx600 +0.4% at 375.5, FTSE +0.2% at 7447, DAX +0.5% at 12117, CAC-40 +0.8% at 5124, IBEX-35 +0.5% at 10350, FTSE MIB +0.5% at 21775, SMI +0.1% at 8932, S&P 500 Futures +0.1%]
Market Focal Points/Key Themes:
European Indices continue their march higher with positive corporate data helping drive sentiment. Price action remains muted ahead of the US long weekend and the August NFP figures out later today. Vivendi shares trade sharply higher following their results setting the tone, and helping the CAC outperform. Elsewhere Volvo trades higher after setting new targets whole Indivior weighs on the UK mid caps after falling close to 40% on the day after a court ruling could effect FY17 results.
Equities
Consumer discretionary [Vivendi [VIV.UK] +4.8% (Earnings)]
Industrials: [Volvo [VOLVB] +7.1% (New financial targets)]
Technology: [Sonova [SOON.CH] +1.2% (New CEO), Gemalto [GTO.NL] -4.7% (Earnings), Nets [NETS.DK] +1.5% (Confirms takeover talk)]
Telecom: [ Illiad [ILD.FR] +0.7% (Earnings)]
Healthcare: [ Indivior [INDV.UK] -39% (To appeal court rulings ANDA litigation after court ruled Dr Reddy's did not infringe on patent)]
Speakers
ECB's Nowotny (Austria): As long as we have low inflation, I do not see perspective for higher interest rates
ECB'a Constantio reiterated view that region recovery is becoming broader and more robust. Task of normalizing inflation remained difficult
Canadian rating agency DBRS: UK's 'AAA' sovereign rating will likely not come under threat unless there is a wide-scale deterioration in institutional and structural factors
Iraq Oil Min Luaibi: Fully compliant with global oil production deal; too early to talk about expansion of oil cut agreement. Iraq oil production at 4.32M bpd ; southern exports between 3.22-3.23M bpd
Currencies
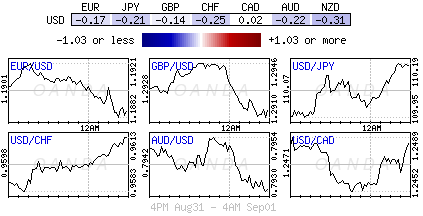
USD trying to hold on to recent gains with the focus turning upon the upcoming US payroll data for clarity of a possible 3rd rate hike this year. Dealers citing the recent trend in US data the suggested an improving picture of fundamentals
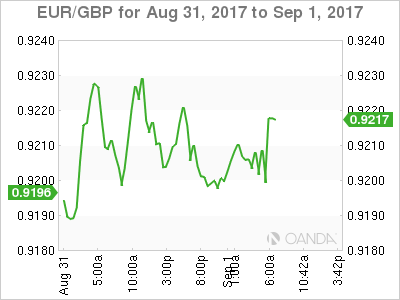
EUR/USD fractionally lower in quiet trade. The pair has moved over 250 pips off its recent 2 ½ highs. Analysts note that ECB was highly unlikely to take any decision on trimming its asset purchases at its Sept policy meeting next week. Overall the market now believing that QE would be phased out only slowly as the euro's rapid gains against the dollar are worrying a growing number of policymakers
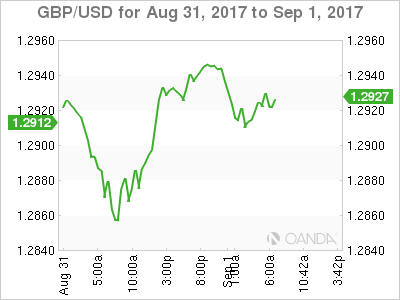
Better-than-expected Aug UK PMI Manufacturing helped the GBP currency firm up against both the USD and EUR pairs. GBP/USD reversed its slight losses to trade at 1.2930 just ahead of the NY morning.
Fixed Income
Bund futures trades at 165.09 down 13 ticks, winding down the week in the upper third of this week’s trading range. Downside targets 164.50 followed by 163.75. To the upside the 165.75 to 166.00 remains key resistance.
Gilt futures trades at 128.26 down 6 ticks, little changed with the focus on next week’s 2065 syndication and BOE reinvestment buybacks. A resumption to the upside could eye 129.25 then 130.10. A move back below 128.25 targets 126.51
Friday’s liquidity report showed Thursday’ excess liquidity rose to €1.731T from €1.729T and use of the marginal lending facility rose to €250M from €109M.
Corporateissuance saw $1.73B come to market this week, the smallest total in 2017. Next week’s forecast is between $35-40B. For the week ending August 30th IG Funds reported inflows of $6.1B, while High Yields funds reported inflows of $0.3B
Looking Ahead
(IT) Italy Aug Budget Balance: No est v €11.2B prior
(RO) Romania Aug International Reserves: No est v $38.2B prior
(ZA) South Africa Aug Naamsa Vehicle Sales Y/Y: 3.2%e v 4.1% prior
(RU) Russia Aug Sovereign Wealth Funds: Reserve Fund: No est v $16.9B prior; Wellbeing Fund: No est v $74.7B prior
(AR) Argentina Aug Government Tax Revenue (ARS): 215.5Be v 237.3B prior
(US) Aug Wards Domestic Vehicle Sales: No est v 12.96M prior; Total Vehicle Sales: No est v 16.69M prior
05:30 (ZA) South Africa to sell combined ZAR650M in I/L 2029, 2038 and 2050 bonds
06:00 (UK) DMO to sell combined £6.0B in 1-month, 3-month and 6-month bills (£2.0B, £2.0B and £2.0B respectively)
06:45 (US) Daily Libor Fixing
07:00 (CA) Canada July MLI Leading Indicator M/M: No est v 0.2% prior
07:30 (IN) India Weekly Forex Reserves
08:00 (BR) Brazil Q2 GDP Q/Q: 0.0%e v 1.0% prior; Y/Y: 0.0%e v -0.4% prior; GDP 4-quarters accumulated: -1.5%e v -2.3% prior
08:00 (BR) Brazil Aug PMI Manufacturing: No est v 50.0 prior
08:00 (CL) Chile July Retail Sales Y/Y: 4.0%e v 4.2% prior
08:00 (CZ) Czech Aug Budget Balance (CZK): No est v 25.0B prior
08:00 (ES) Spain Debt Agency (Tesoro) announces upcoming issuance
08:00 (IN) India announces upcoming Bill auction (held on Wed)
08:05 (UK) Baltic Dry Bulk Index
08:30 (US) Aug Change in Nonfarm Payrolls: +180Ke v +209K prior; Private Payrolls: +170Ke v +205K prior; Manufacturing Payrolls: +9Ke v +16K prior
08:30 (US) Aug Unemployment Rate: 4.3%e v 4.3% prior; Underemployment rate: No est v 8.6% prior
08:30 (US) Aug Average Hourly Earnings M/M: 0.2%e v 0.3% prior; Average Hourly Earnings Y/Y: 2.6%e v 2.5% prior; Average Weekly Hours: 34.5e v 34.5 prior
09:30 (CA) Canada Aug Manufacturing PMI: No est v 55.5 prior
09:45 (US) Aug Final Markit Manufacturing PMI: 52.5e v 52.5 prelim
10:00 (US) Aug ISM Manufacturing: 56.5e v 56.3 prior; Prices Paid: 62.0e v 62.0 prior
10:00 (US) Aug Final University of Michigan Confidence: 97.4e v 97.6 prelim
10:00 (US) July Construction Spending M/M: +0.5%e v -1.3% prior
10:00 (MX) Mexico July Total Remittances: $2.4Be v $2.4B prior
10:00 (MX) Mexico Central Bank (Banxico) Economist Survey
10:00 (BR) Brazil July CNI Capacity Utilization: No est v 77.0% prior
10:30 (MX) Mexico Aug PMI Manufacturing: No est v 51.2 prior
12:00 (IT) Italy Aug New Car Registrations Y/Y: No est v 5.9% prior
13:00 (US) Weekly Baker Hughes Rig Count data
13:00 (MX) Mexico Aug IMEF Manufacturing Index: 51.8e v 51.5 prior; Non-Manufacturing Index: 52.0e v 53.0 prior
14:00 (BR) Brazil Aug Trade Balance: $4.4Be v $6.3B prior; Exports: $18.2Be v $18.8B prior; Imports: $14.0Be v $12.5B prior
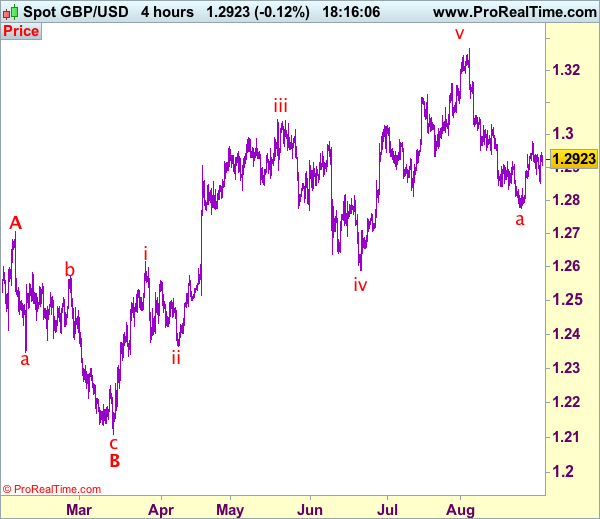
Trade Idea: GBP/USD – Buy at 1.2900
GBP/USD – 1.2933
Original strategy :
Buy at 1.2845, Target:1.3045, Stop: 1.2785
Position: -
Target: -
Stop: -
New strategy :
Buy at 1.2900, Target:1.3050, Stop: 1.2840
Position: -
Target: -
Stop:-
Cable only retreated to 1.2852 before finding renewed buying interest (missed our long entry at 1.28450 and the pair has rebounded again, suggesting the pullback from 1.2979 (this week’s high) has possibly ended there and consolidation with mild upside bias is seen for another test of said resistance, break there would add credence to our view that low has been formed at 1.2774 and extend the corrective rise from there for retracement of recent decline from 1.3269 to 1.3000 and possibly towards resistance at 1.3032.
In view of this, would be prudent to buy sterling on dips. Below said support at 1.2852 would defer and risk weakness towards 1.2800-10, however, only break of latter level would suggest the rebound from 1.2774 has ended instead, risk retest of this level, break there would extend the selloff from 1.3269 top to 1.2750, then towards 1.2700-10 later.
Our preferred count on the daily chart is that cable's rebound from 1.3500 (wave (A) trough) is unfolding as a wave (B) with A ended at 1.7043, followed by triangle wave B and wave C as well as wave (B) has ended at 1.7192, the subsequent selloff is the larger degree wave (C) which is still unfolding with minor wave (III) of larger degree wave 3 ended at 1.1986, hence wave (IV) correction is in progress which could either be a triangle wave (IV) of a complex formation but upside should be limited to 1.3500 and price should falter well below 1.4000, bring another decline in wave (V) of 3 for weakness to 1.1500, then 1.1200.
Strategy: Event Risk To The Fore
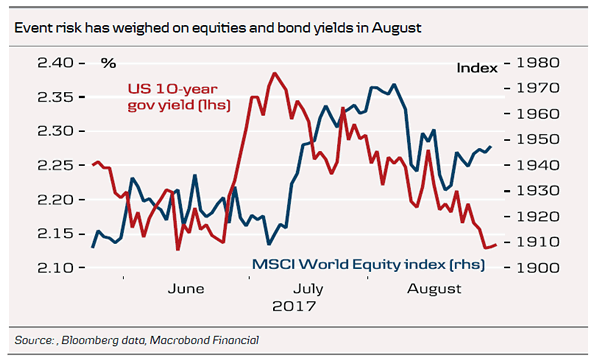
While the global macro backdrop is looking good as we near the end of Q3, event risks have returned to markets after being away for some time.
- First, the crisis with North Korea escalated this week with Pyongyang's launch of a missile that flew over Japan to land in the Pacific.
- Second, the deadline for the US debt limit is getting closer and is only a little more than one month away. A government shutdown is also a risk unless a new budget is agreed by the end of September.
- Third, Hurricane Harvey has become stronger than estimated and is likely to make a small dent in US activity in the very short term.
The increased uncertainty has overshadowed the robust growth picture and sent both equity markets and bond yields lower this week. On the other hand, it has not stopped metal prices from continuing the recent surge – a sign that Chinese growth is rebounding ahead of the 19th National Congress of the Communist Party of China, which takes place this autumn.
What should we make of the above event risks? The short answer is that they are likely to keep a lid on risk appetite in the short term. However, as we do not expect these risks to have a material impact on the global economy, the effects on markets should also prove temporary – and equities and bond yields should eventually recover.
On the first point, the North Korean crisis has turned into a Gordian Knot, with no easy solution but still, given the grave consequences of a war on the Korean Peninsula, the probability of military conflict is in our view low. US president Donald Trump responded to Kim Jong Un's provocation by repeating the phrase that 'all options are on the table', indicating that a military strike against North Korea is possible. However, it does not seem like a credible threat. A military strike comes with the risk of a fierce retaliation with significant casualties in South Korea. The capital Seoul, with 10 million people, is less than 50km from the border with North Korean and North Korea has a significant arsenal of both conventional and chemical weapons.
Then there is the risk from nuclear weapons. Kim Jong Un may act as crazy and unpredictable as possible ('mad man' theory) to make retaliation look credible even if he knows that any attack on South Korea would have devastating consequences for his country – and probably himself. Continued waves of escalation seem likely to us but war does not. Kim Jong Un's latest missile test came partly as a response to annual military exercises in August, with 17,500 US soldiers participating in 10-day war games with the South Korean army. Hence, once these exercises are over, we could see some calm restored. If things calm down again, this should give some support to risk assets.
Debt limit deadlock keeps lid on risk appetite short term
On the issue of the debt limit, we may have to be a bit patient before a solution is on the table. The experience with deadlocked political negotiations is unfortunately that they run until the very last minute and often things look very dire right ahead of the deadline. If this pattern repeats itself, risk appetite may stay subdued until we get to the 'other side' in early October. We see the probability of a failure to raise the debt limit as very small. In our view, too much is at stake. US rating agency S&P warned this week that failure by Congress to raise the debt limit would be likely to be 'more catastrophic' than the failure of Lehman Brothers in 2008. This may be too gloomy but the consequences could be serious, as a default on a US bond would entail a downgrade of US debt and risk causing a recession. The US Treasury Secretary has said that Congress needs to raise the ceiling by 29 September but we expect the so-called X date – the ultimate deadline – to be some day in the first two weeks of October. While the probability of failure is low, the impact would be very high. Thus, we expect equity investors to stay on the sidelines until a deal is struck.
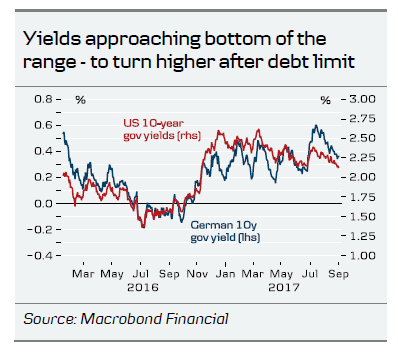
Bond yields low short term – up in Q4
It also means that bond yields are likely to remain low for now. However, we still see a range-trading environment for 10-year US bond yields for the rest of the year and as we are in the low end of the range currently, we look for higher yields once we get the relief rally in risk assets when a deal on the debt limit is struck.
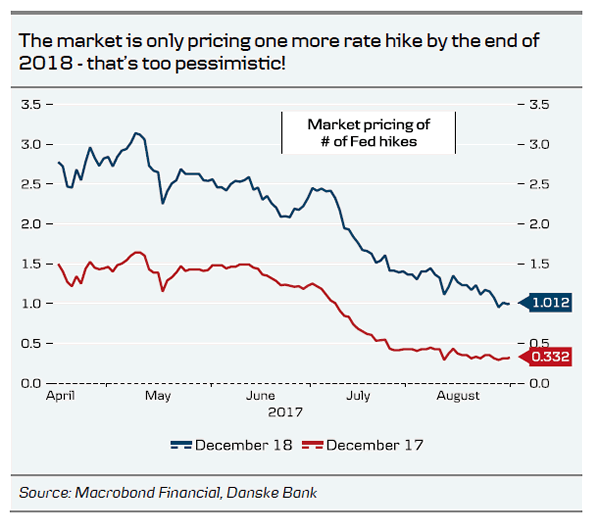
We also still expect the Fed to raise rates again in December, which would give a push up from the short end of the yield curve, as the probability of a December hike is still priced with only 30% probability. While core inflation is likely to remain low in the short term, we expect growth and employment to stay solid.
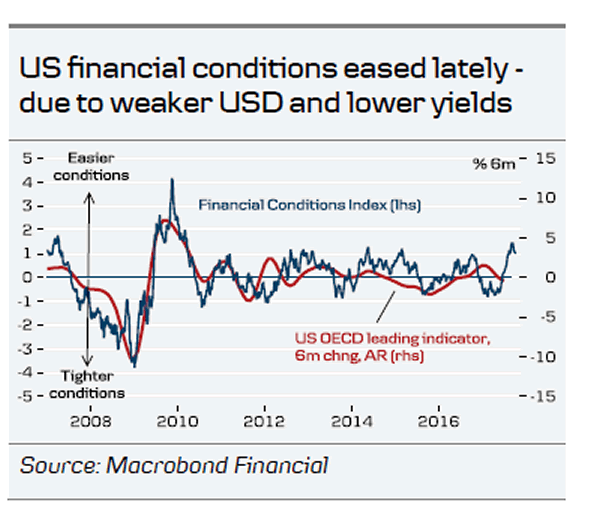
This should keep the Fed on its cautious hiking path, as the Fed expects a continually tightening labour market to push up inflation in the longer term. US financial conditions have also eased quite a bit lately from the lower bond yields and weaker USD. Hence, a Fed hike would moderate only some of the financial easing that has taken place in the market.
Could the negative effects of Hurricane Harvey spoil this? We do not believe so. First, the history from previous big hurricanes such as Hurricane Katrina in 2005 and so-called Superstorm Sandy in 2012 shows that any negative impact is short-lived and if anything the rebuilding afterwards will give a small lift. Second, estimates of the damage so far put the cost of Harvey around USD30-40bn and thus lower than both Katrina (USD160bn) and Sandy (USD70bn). The hurricane may pull forward the date that the debt ceiling is reached into late September but we still expect the deal to come last minute.
Rising EUR/USD trend here to stay – buy on dips
EUR/USD has shown a strong uptrend over the past few months, reaching a new cycle high this week around 1.20. While the cross has corrected slightly this week, we expect the uptrend to continue and recommend a buy-on-dips strategy. We expect EUR positive forces to continue over the coming year: strong positive flows related to the beginning of an ECB exit next year and a big current account surplus (see FX Edge: Power of flows, 23 August) and still attractive valuation on our medium term models. There are a few shortterm positives for the USD, as positioning is now quite long EUR and short USD. Also, a Fed hike in December would be likely to be USD positive. Tighter USD liquidity could also benefit the USD (see FX Edge: The return of USD scarcity, 29 August). However, we do not look for a big correction and expect EUR/USD to trade in a range of 1.15-1.20 on a 1-3M horizon. At the same time, we believe any decline should be used to position for a further move up in EUR/USD on a 6-12M horizon
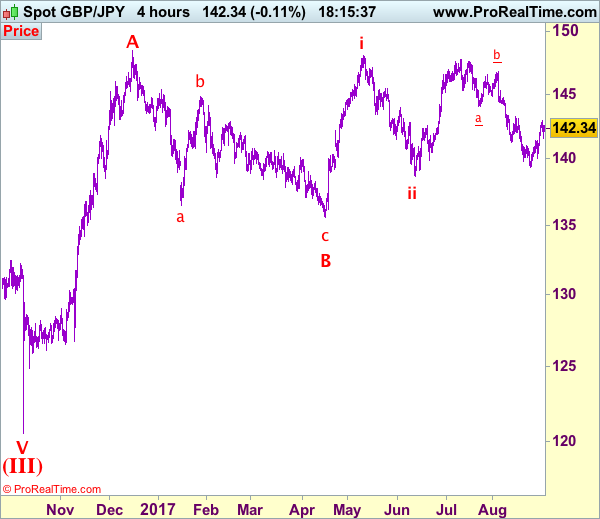
Trade Idea: GBP/JPY – Buy at 141.60
GBP/JPY - 142.45
Original strategy:
Bought at 141.60, Target: 143.60, Stop: 141.00
Position: - 141.60
Target: - 143.60
Stop: - 141.00
New strategy :
Hold long entered at 141.60, Target: 143.60, Stop: 141.60
Position: - Long at 141.60
Target: - 143.60
Stop:- 141.60
Although the British pound retreated after meeting resistance at 142.90 yesterday, as sterling did find renewed buying interest at 141.55-60 (we recommended to buy at 141.60 and a long position was entered) and has rebounded, retaining our bullishness and mild upside bias remains for another test of said resistance, break there would add credence to our view that recent decline has ended at 139.35 and bring at least a strong retracement of recent decline to 143.20 and then 143.50-60, however, near term overbought condition should limit upside and reckon 144.00-10 would hold from here.
In view of this, we are holding on to our long position entered at 141.60. Below said support would risk test of previous resistance at 141.40, break there would defer and risk weakness to 141.00 but reckon downside would be limited to 140.40-45, price should stay well above support at 140.05 and bring another rebound later.
Our preferred count is that larger degree wave V with circle is unfolding from 251.12 with wave (I) 219.34, (II): 241.38 and wave (III) is subdivided into 1: 192.60, 2: 215.89 (23 Jul 2008) and wave 3 ended at 118.87 earlier in 2009. The correction from there to 162.60 is wave 4 which itself is a double three and is labeled as first a-b-c ended at 151.53, followed by wave x at 139.03, 2nd a ended at 162.60, 2nd b at 146.75 and 2nd c leg of wave 4 ended at 163.00. Therefore, the decline from 163.00 to 116.85 is now treated as wave 5 which also marked the end of larger degree wave (III), hence wave (IV) major correction has commenced for retracement of the wave (III) from 241.38 and upside target at 183.95-00 (50% Fibonacci retracement of the wave (II) from 241.38) had been met, a drop below 160.00 would suggest wave (IV) has ended at 195.85, bring decline in wave (V) for initial weakness to 130 (already met) and 120.
D-Day For NFP: Odds To Disappoint?
Friday September 1: Five things the markets are talking about
Will today's U.S non-farm payroll (NFP) be able to move the market? Lately, it has been more about expectations and little about action.
This week's ADP survey offered a positive surprise revealing that the U.S private sector added +237k jobs in August, beating market expectations of around +185k – it was the largest monthly increase in five-months, whilst the June's print was also revised higher by +23k to +201k.
The correlation between the private report and granddaddy of economic indicators historical is not that strong, however, July's NFP and August ADP would suggest that U.S employment sector has accelerated its recovery from previous strong levels.
The ‘but' is that inflation data this week remains a concern for the Fed, which may suggest that even if we get a strong payroll report – a headline print above +180k this morning – it may not mean that a dollar advance is guaranteed. If due to some seasonal aberration, the headline print disappoints, less than +140k, then both the dollar and U.S yields could struggle on the first day of a new month.
The focus will be on today's wage growth figures to gauge the outlook for Fed's monetary policy in the months to come. Despite low unemployment and steady job creation, employee earnings have been stuck at a ‘modest' rate for a long time, drawing caution from U.S policy makers.
Yesterday's U.S personal consumption expenditures price index ex-food and energy, increased +1.4% in the 12-months to July – the smallest rise in 18-months.
Note: Most markets in the Middle East are closed today, while U.S and Canadian markets are closed Monday.
1. Stock rally in light trading
Global equities advance, with mining companies extending gains as industrial metals continued a rally fuelled by positive economic data surprises this week.
In Japan, the Nikkei share average edged up +0.2% overnight, echoing Thursday's stateside gains, but trading was subdued as the market waits for U.S jobs data and its impact on the yen (¥110.08). The broader Topix was up +0.1%.
In Hong Kong, stocks hover over two-year highs on China strength and reforms. Both the Hang Seng index and the China Enterprises Index dripped -0.1%.
Note: The Hong Kong market has climbed for eight months in a row, encouraged largely by stronger-than-expected economic growth in China.
In China, stocks have edged up overnight to cap their third week of gains, supported by robust corporate earnings and signs of accelerated reforms of state firms. The blue-chip CSI300 index rose +0.2%, while the Shanghai Composite Index also added +0.2%.
In Europe, equities continue their march higher with positive corporate data helping drive sentiment. However, price action remains muted ahead of NFP and the U.S long weekend.
Futures on the S&P 500 Index have increased +0.1%, reaching the highest in more than three weeks on its sixth straight advance.
Indices: Stoxx600 +0.4% at 375.5, FTSE +0.2% at 7447, DAX +0.5% at 12117, CAC-40 +0.8% at 5124, IBEX-35 +0.5% at 10350, FTSE MIB +0.5% at 21775, SMI +0.1% at 8932, S&P 500 Futures +0.1%
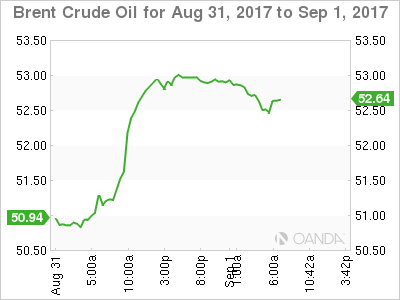
2. Crude declines, as gasoline remains elevated, gold falls
Oil prices remain on the back foot in the wake of Hurricane Harvey, which has paralyzed over a quarter of the U.S refining industry.
Harvey shut at least +4.4m bpd of refining capacity, according to company reports. This has sparked fears of a fuel shortage ahead of the Labor Day weekend, and cut refinery demand for crude oil.
Benchmark Brent crude for November is down -40c at +$52.46 a barrel, while U.S light crude (WTI) is down -45c at +$46.78 a barrel. The contract rebounded +2.8% yesterday, but is still heading for a weekly decline of around -2%.
U.S gasoline prices hit a two-year high above +$2 a gallon on Thursday, settling up +25.52c, or +13.5% at +$2.1399 on the last day of trading in the September contract.
Note: The U.S government tapped its strategic oil reserves (SPR) for the first time in five years yesterday, releasing +1m barrels of crude to a working refinery in Louisiana.
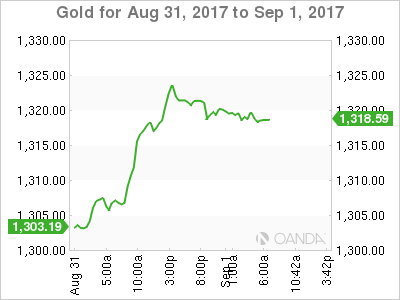
Ahead of the U.S open, gold prices have inched lower (down -0.2% at +$1,318.81 per ounce) as mild profit-taking has set in after recent rallies and as market awaits U.S. jobs data for direction on interest rates, but safe-haven demand is keeping prices atop of their decade highs as tensions over North Korea linger.
3. U.S Treasury's rise as weak inflation persists
U.S Treasury yields fell hard yesterday following the governments report on personal income and outlays for July. The yield on the benchmark U.S 10-year note has fallen to +2.12%, matching the low of late June.
The report showed consumer spending continuing to perk up (although not as much as expected) and personal income rising, but inflation falling well below the Fed +2% target.
Note: U.S 10-year yields have dropped -16 bps in August, the steepest monthly decline since June 2016. At the start of 2017, the market was preparing for yields to be almost +50 bps higher by now.
If U.S payrolls drop this morning (08:30 am EDT) as expected, reducing the chances of a rate rise by the Fed in December, they could push 10-year prices higher and this could also drag 10-year German Bund prices higher – the ECB meet on September 7.
Germany's 10-year yield has declined -1 bps to +0.36%, while U.K 10-year gilts yields have rallied less than +1 bps to +1.034% ahead of today's U.S payroll report.
4. Dollar steady ahead of U.S payrolls
USD is tentatively holding on to its recent gains as the market focuses on today's non-farm payroll (NFP) report for clarity of a possible third Fed rate hike this year.
EUR/USD (€1.1892) is a tad lower in quiet trade. The pair has fallen over -250 pips off its recent three-year highs (€1.2069). The consensus does not think that the ECB will take to take any decision on trimming its asset purchases at next week's policy meeting (Sept. 7). Dealers believe that QE would be phased out ‘slowly' as the EUR's rapid gains outright (+14% year-to-date) is worrying a growing number of ECB policymakers.
This morning, U.K August manufacturing PMI rallied to a four-month high of 56.9 – sterling (£1.2926) rallied after the release, though gains are limited, with markets focused on concerns over a lack of progress in the U.K's talks with the E.U about Brexit.
5. Eurozone manufacturing PMI's rise in August
Activity in the eurozone's manufacturing sector increased last month to a joint 74-month high, led largely by the strong core of Germany, the Netherlands and Austria, a sign that the regions recovery remains strong.
The manufacturing PMI's for the bloc rose to 57.4 in August, up from July's reading of 56.6, and unrevised from the original flash estimate.
The summer surge in factory activity may suggest that rising goods production will support another strong GDP reading for Q3.
Spotlight Falls On The US Employment Report
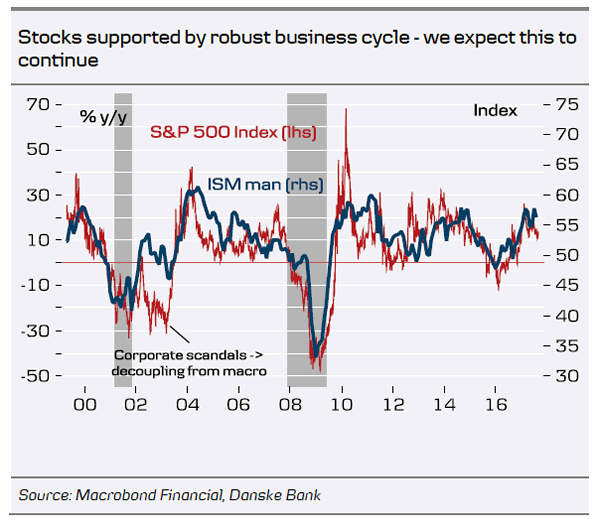
Today, investors will probably be sitting on the edge of their seats in anticipation of the US employment report for August. The consensus is for nonfarm payrolls to have risen by 180k, less than the 209k in July, but still a decent number consistent with further tightening in the labor market. Actually, bearing in mind that the ADP report showed that the private sector gained much more jobs than what was anticipated, we see the possibility for the NFP number to exceed its forecast as well. The unemployment rate is expected to have remained very low at 4.3%, while average hourly earnings are forecast to have slowed somewhat in monthly terms, but this would still drag the yoy rate slightly higher. Following the strong upside revision of Q2 GDP and the robust ADP print, another set of encouraging data could push higher the probability for another Fed hike this year.
However, we stick to our guns that the primary determinants of whether the Fed will indeed proceed with another rate increase this year may be inflation data. The minutes of the July gathering showed that the number of policymakers who are concerned with regards to inflation has increased, while data after that meeting showed inflation remained subdued, casting more doubts on whether the softness in recent months can indeed be attributed to idiosyncratic factors. In our view, a strong rebound in inflation is needed before rate-hike expectations rise materially and help the dollar reverse its latest downtrend. The next CPI data are scheduled for the 14th of September, less than a week before the Fed meets to decide on policy. Although a single improvement may not be enough to guarantee a September hike, it could revive hopes that more encouraging prints may allow that to happen in December.
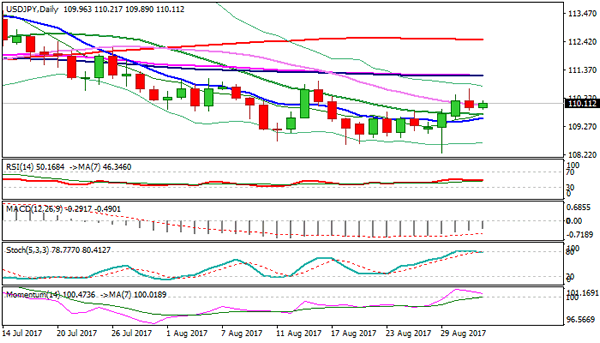
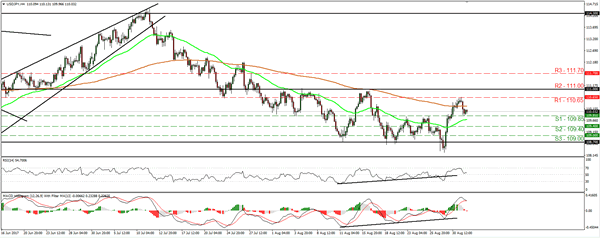
USD/JPY traded lower yesterday after it hit resistance at 110.65 (R1). Nevertheless, the slide was stopped at 109.85 (S1). The pair continues to trade within the sideways range between 108.70 and 111.00 (R2), which keeps the short-term outlook flat in our view. Having said that, today's jobs data, if strong, could help the pair rebound within the range and challenge once again yesterday's high of 110.65 (R1). If the bulls are strong enough to break that level, we would expect them to aim for the 111.00 (R2) barrier, the upper bound of the aforementioned range.
Sources say that the strong euro increases chance of slower QE-exit
Despite Eurozone's inflation accelerating by more than anticipated, the euro came under renewed selling interest on Thursday after sources familiar with ECB discussion told Reuters that “rapid gains by the euro against the dollar are worrying a growing number of policymakers”. They also noted that this raises the chance that that asset purchases will be phased out only slowly and that the ECB is highly unlikely to take any decision at next week's policy meeting.
The reports poured cold water on expectations that the ECB may remove more dovish aspects from its forward guidance when it meets next week. Specifically, there was speculation that this time around, the Bank may remove from its statement the easing bias that QE can be expanded both in terms of size and duration if needed. EUR-traders now turn their attention to ECB Vice President Constancio's speech, scheduled during the European morning today, to see whether his remarks will indeed confirm the aforementioned sources.
EUR/USD slid during the European morning Thursday following the Reuters reports. Nevertheless, the pair hit the key support of 1.1830 (S1) and during the US session it rebounded to test 1.1920 (R1). We maintain the view that the broader path of the pair is to the upside as marked by the uptrend line taken from the low of the 17th of April. Nonetheless, we prefer to remain sidelined today as strong US jobs data combined with more EUR-strength concerns by Constancio could cause the rate to correct lower, even below the key support of 1.1830 (S1).
As for the rest of today's events:
During the European morning, we get the UK manufacturing PMI for August. Expectations are for the index to decline marginally, but to remain at a healthy level. In any case, we don't expect such a print to affect the BoE's policy plans. We also get the final manufacturing PMIs from several European countries and the Eurozone as a whole. In the US, besides the employment data, the ISM manufacturing PMI for August is also coming out and the forecast is for the index to tick down, but to remain at a healthy level. We think that this time, the ISM print may attract less attention than usual, as investors may still be digesting the all-important employment data.
USD/JPY
Support: 109.85 (S1), 109.40 (S2), 109.00 (S3)
Resistance: 110.65 (R1), 111.00 (R2), 111.70 (R3)
EUR/USD
Support: 1.1830 (S1), 1.1730 (S2), 1.1660 (S3)
Resistance: 1.1920 (R1), 1.2000 (R2), 1.2100 (R3)
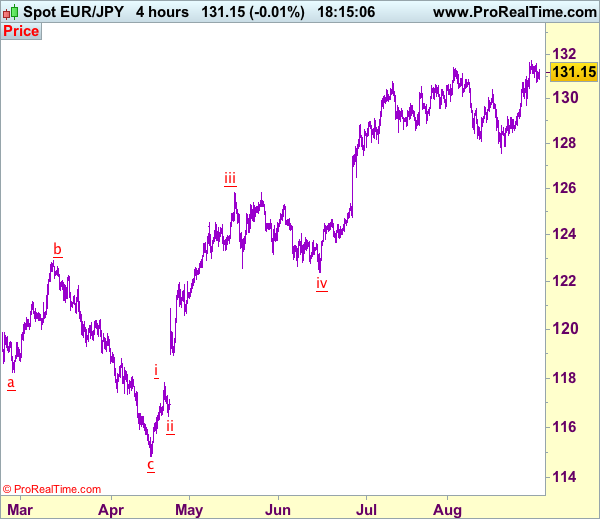
Trade Idea: EUR/JPY – Buy at 130.30
EUR/JPY - 131.23
Original strategy:
Buy at 130.50, Target: 132.50, Stop: 129.90
Position: -
Target: -
Stop: -
New strategy :
Buy at 130.30, Target: 132.30, Stop: 129.70
Position: -
Target: -
Stop:-
As the single currency retreated after rising to 131.71 earlier this week, suggesting consolidation below this level would be seen and pullback to 130.70 and then 130.40-45 (38.2% Fibonacci retracement of 128.33-131.71) cannot be ruled out, however, reckon 130.00-05 (50% Fibonacci retracement) would hold and bring rebound later, Above said resistance at 131.71 would signal recent upmove has resumed and extend gain to 132.00-10 but overbought condition should prevent sharp move beyond 132.50-60 and reckon 133.00-10 would hold from here, bring retreat later.
In view of this, would not chase this rise here and we are looking to buy euro on subsequent pullback as 130.30 should limit downside and bring another rise later. Below 130.00 would risk another test of said support at 129.66 but only break there would signal top is formed instead, risk correction to 129.10-15.
Our latest preferred count is that wave (ii) is ABC-X-ABC which ended at 123.33 and wave (iii) is unfolding with wave iii ended at 100.77, followed by wave iv at 111.57 and wave v as well as the wave (iii) has ended at 97.04, followed by wave (iv) at 111.43 and wave (v) has ended at 94.12 which is also the end of the larger degree v, this also implied the major wave (C) has also ended there, hence major correction has commenced from there with (A) leg unfolding in its lower degree wave c which has possibly ended at 145.69. Under this count, A-B-C wave (B) has commenced with A leg ended at 136.23, wave B at 143.79 and wave C has possibly ended at 149.79.
Our larger degree count is that the decline from 139.26 is wave (C) and is sub-divided into a diagonal triangle i-ii-iii-iv-v with wave i - 105.44, wave ii- 123.33, wave iii - 97.03, wave iv - 111.43, followed by the final wave v as well as the end of wave (C) at 94.12, this also mark the bottom of larger degree wave B. Under this count, major rise in wave C has commenced as an impulsive wave with minor wave III ended at 145.69, wave V is still in progress for further gain to 150.00. Having said that, this so-called wave V could well be the first leg of larger degree 5-waver wave C and this wave C should bring at least a retest of wave A top at 169.97 (July 2008).
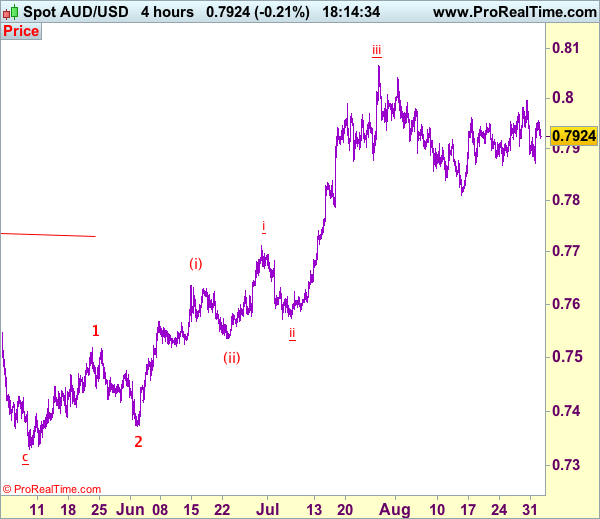
Trade Idea: AUD/USD – Stand aside
AUD/USD – 0.7924
New strategy :
Stand aside
Position: -
Target: -
Stop:-
Although aussie found support at 0.7871 yesterday and staged a rebound and gain to 0.7960-70 cannot be ruled out, the pair needs to penetrate indicated resistance at 0.7996 to revive bullishness and signal the pullback from 0.8066 has ended, bring subsequent retest of this level which is likely to hold from here. If said resistance at 0.7996 continues to hold, then further choppy trading would take place.
On the downside, below support at 0.7867-71 would signal the rebound from 0.7808 has ended instead, bring another leg of corrective decline towards this level later. Below 0.7808 would signal the wave iv correction from 0.8066 is still in progress for weakness to 0.7786 support, however, oversold condition should prevent sharp fall below 0.7750 and price should stay above i top at 0.7712, bring rebound later. We are keeping our latest bullish count that recent impulsive waves is unfolding as (1 2, (i)(ii), i ii) and may extend headway towards 0.8150.
On the 4-hour chart, the move from 0.8066 is the wave 5 with i: 0.8860, ii: 0.8315, wave iii is an extended move ended at 1.0183, iv: 0.9706 and wave v has ended at 1.1081 (also the top of entire wave 5). The subsequent selloff is the major correction which is unfolding as ABC-X-ABC and 2nd A leg has ended at 0.8848, followed by a-b-c wave B which ended at 0.9758, hence, 2nd C wave is now in progress and indicated downside target at 0.7000 and 0.6950 had been met, so further fall to 0.6710-20 cannot be ruled out.
Technical Outlook: USDJPY – Lift Above 111.00 Or Return Below 109.46 Are Post – NFP Data Scenarios
The pair is holding around 110.00 handle as trading narrows ahead of US NFP data.
Yesterday's strong upside rejection at 110.66 (Fibo 38.2% of 114.49/108.26 descend) and close in red daily candle with long upper shadow signaled that bulls, attracted by daily cloud twist, ran out of steam and taking a breather.
Today's action was so far contained above strong support at 109.75 (4-hr cloud top / 20SMA / Fibo 38.2% of 108.26/110.66 upleg) and bullish sentiment is expected to remain firm while the latter support holds.
Otherwise, sustained break lower would generate initial signal of lower top and spark fresh weakness.
US jobs data are likely to spark stronger activity, with bullish release to boost the greenback through key barriers at 111.00 (former high) and 111.17 (converged 55/100SMA).
Alternatively, loss of 109.75 handle would expose 109.46 (daily Tenkan-sen) and signal an end of corrective phase from 108.26 on sustained break lower.
Res: 110.21, 110.66, 111.00, 111.17
Sup: 109.75, 109.46, 109.18, 108.83