Sample Category Title
USD/CAD Mid-Day Outlook
Daily Pivots: (S1) 1.2418; (P) 1.2541; (R1) 1.2605; More....
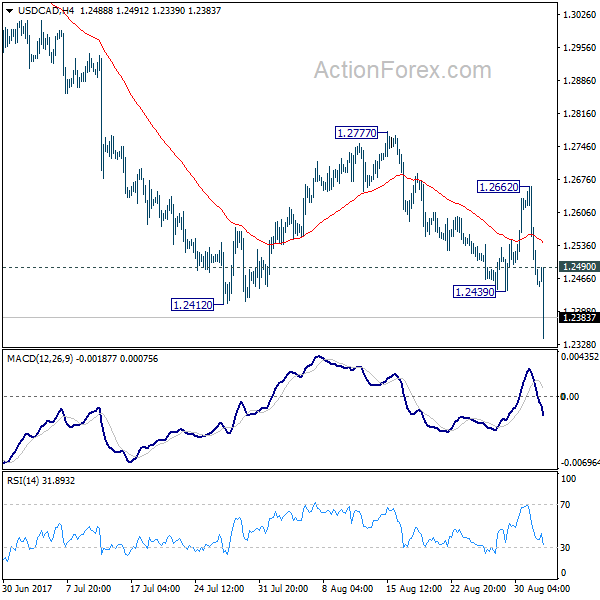
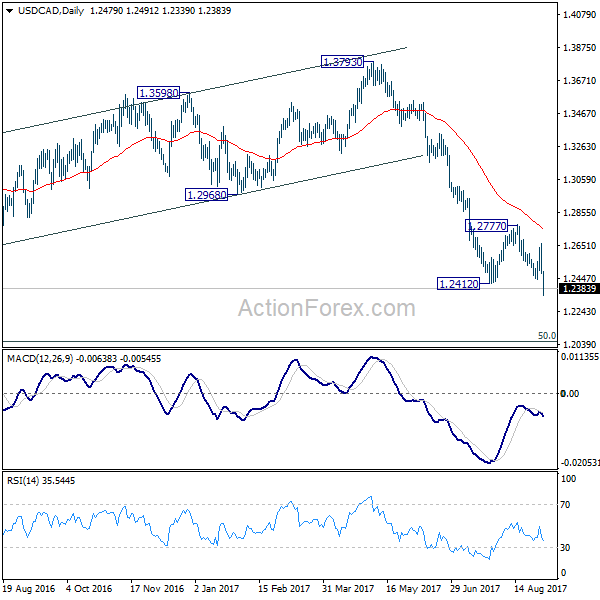
USD/CAD's drops sharply to as low as 1.2339 and break of 1.2412 low confirms resumption of medium term fall from 1.3793. Intraday bias is back on the downside. Current decline should now target next long term fibonacci level at 1.2048. On the upside, above 1.2490 minor resistance will turn intraday bias neutral again. But outlook will remain bearish as long as 1.2662 resistance holds.
In the bigger picture, price actions from 1.4689 medium term top are seen as a correction pattern. Such corrective fall is still expected to extend to 50% retracement of 0.9406 to 1.4869 at 1.2048. At this point, we'd look for strong support from there to contain downside and bring rebound. Nonetheless, on the upside, sustained break of 1.2968, 38.2% retracement of 1.3793 to 1.2412 at 1.2940 will be the first sign of completion of the correction and will turn focus back to 1.3793 key resistance.
USD/JPY Mid-Day Outlook
Daily Pivots: (S1) 109.67; (P) 110.16; (R1) 110.46; More...
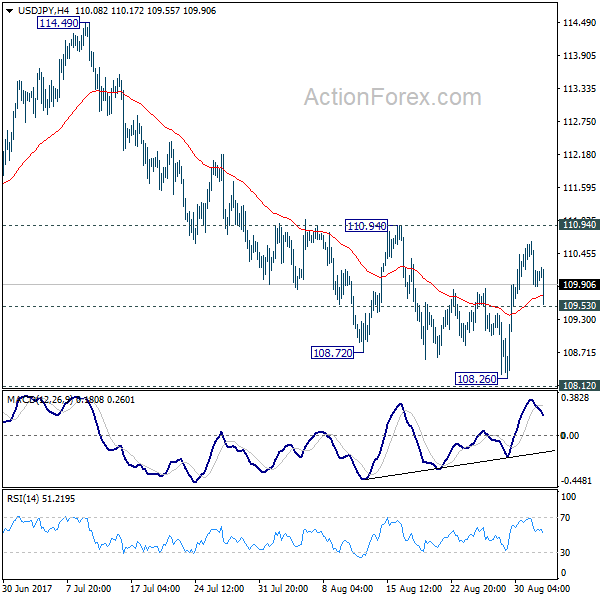
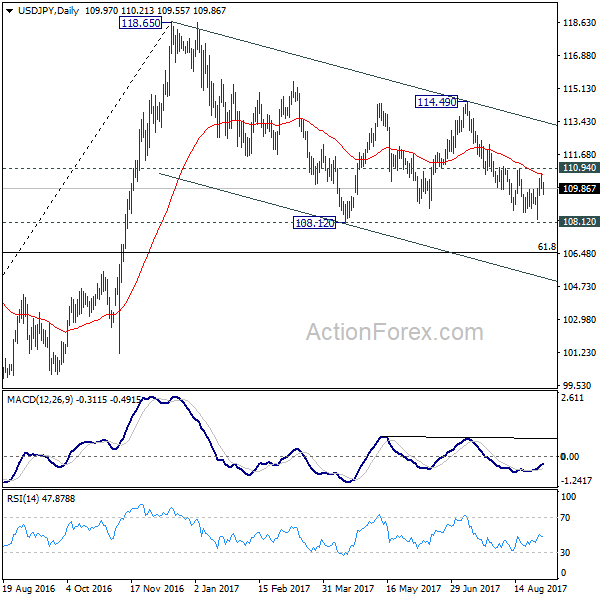
At this point, USD/JPY is staying in range of 109.53/110.94 and intraday bias remains neutral first. After all, with 110.94 resistance intact, outlook stays bearish and deeper decline is still expected. On the downside, below 109.53 minor support will turn bias to the downside for 108.12 support first. Firm break of 108.12 support will resume the whole corrective decline from 118.65. In that case, USD/JPY will target 61.8% retracement of 98.97 to 118.65 at 106.48. Nonetheless, considering bullish convergence condition in 4 hour MACD, break of 110.94 will indicate near term reversal and bring stronger rebound back towards 114.49 resistance.
In the bigger picture, the corrective structure of the fall from 118.65 suggests that rise from 98.97 is not completed yet. Break of 118.65 will target a test on 125.85 high. At this point, it's uncertain whether rise from 98.97 is resuming the long term up trend from 75.56, or it's a leg in the consolidation from 125.85. Hence, we'll be cautious on topping as it approaches 125.85. If fall from 118.65 extends lower, downside should be contained by 61.8% retracement of 98.97 to 118.65 at 106.48 and bring rebound.
USD/CHF Mid-Day Outlook
Daily Pivots: (S1) 0.9552; (P) 0.9616; (R1) 0.9649; More....
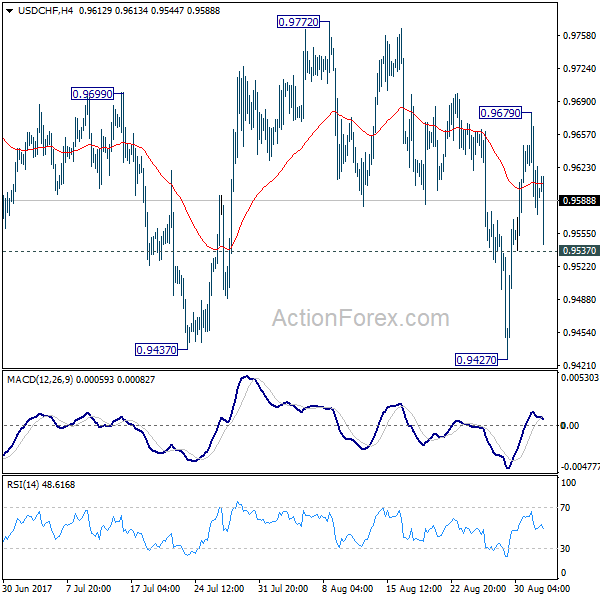
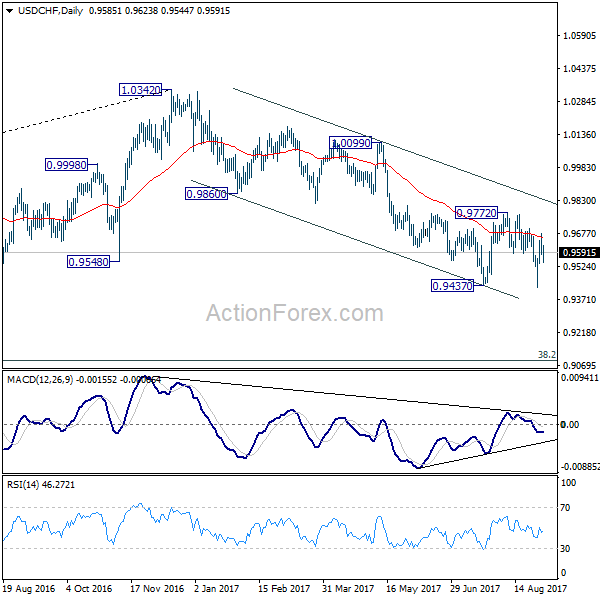
USD/CHF's dipped to 0.9544 in early US session but quickly recovers. Intraday bias is neutral for the moment first. As noted before, considering it's close to to 0.9443 key support, consolidation from 0.9427 might extend further. But still, break of 0.9772 resistance is needed to confirm near term reversal. Otherwise, outlook stays bearish for another decline. Below 0.9537 minor support will turn bias back to the downside for retesting 0.9427 first. Break of 0.9427 will resume whole decline from 1.3042.
In the bigger picture, current development suggests that 0.9443 key support (2016 low) could be taken out firmly as down trend form 1.0342 extends. There are various interpretation of the price actions. But in any case, medium term outlook will stay bearish as long as 0.9772 resistance holds. Current down trend could extend to 38.2% retracement of 0.7065 (2011 low) to 1.0342 (2016 high) at 0.9090.
GBP/USD Mid-Day Outlook
Daily Pivots: (S1) 1.2877; (P) 1.2906; (R1) 1.2960; More...
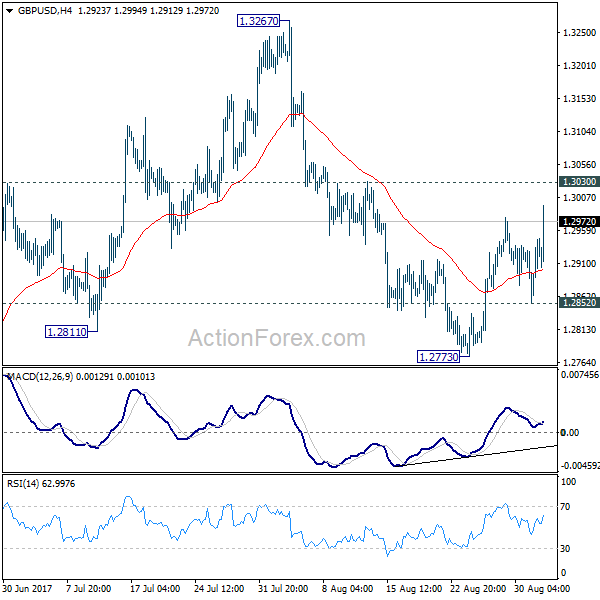
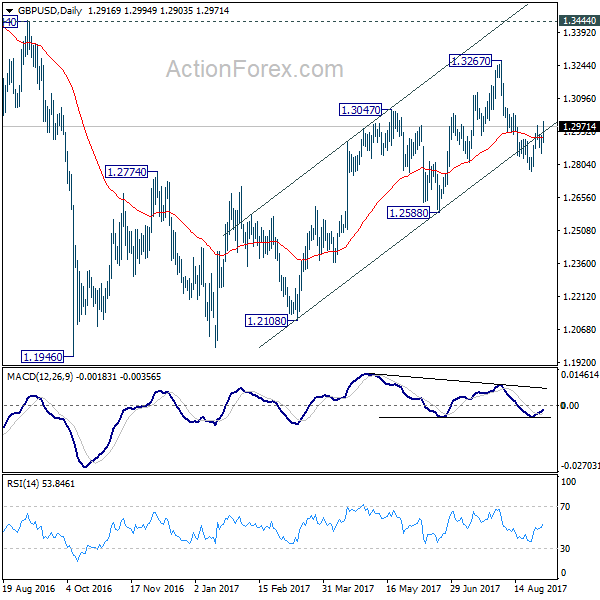
GBP/USD's rebound from 1.2773 extend today but it's staying below 1.3030 resistance. Intraday bias remains neutral with bearish near term outlook. We're favoring the case that correction from 1.1946 is completed at 1.3267. Below 1.2852 will turn intraday bias back to the downside for 1.2588 key near term support first. Decisive break of 1.2588 will confirm our view and target a test on 1.1946 low. Though, break of 1.3030 will dampen this bearish view and turn bias back to the upside for retesting 1.3267.
In the bigger picture, overall, price actions from 1.1946 medium term low are seen as a corrective pattern. While further rise cannot be ruled out, larger outlook remains bearish as long as 1.3444 key resistance holds. Down trend from 1.7190 (2014 high) is expected to resume later after the correction completes. And break of 1.2588 will indicate that such down trend is resuming.
EUR/USD Mid-Day Outlook
Daily Pivots: (S1) 1.1850; (P) 1.1881 (R1) 1.1939; More...
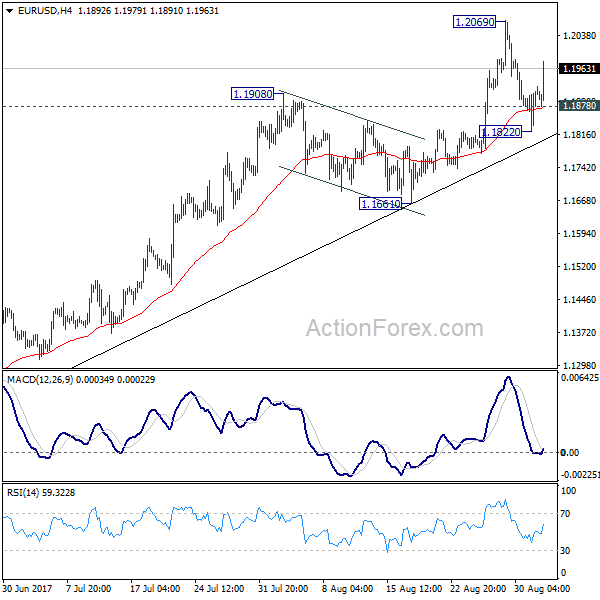
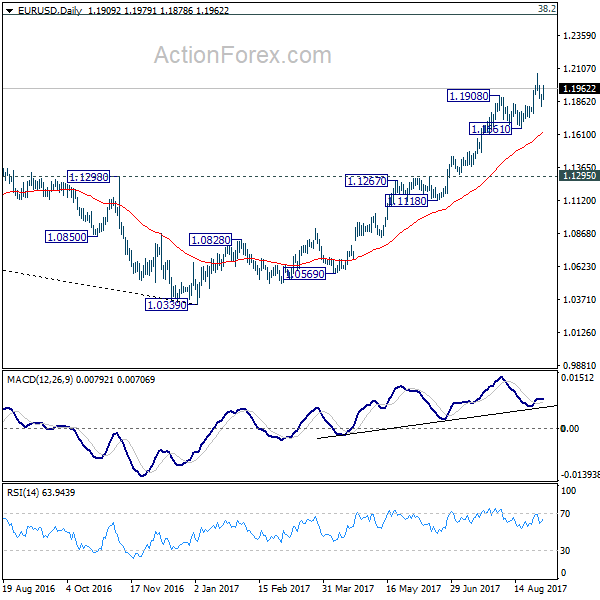
EUR/USD's strong rebound suggests that pull back from 1.2069 has completed at 1.1822 already. Intraday bias is turned back to the upside for retesting. 1.2069 first. Break there will resume medium term rise from 1.0339 and should target next key fibonacci level at 1.2516. On the downside, below 1.1878 minor support will extend the correction from 1.2069 with another fall. But downside should be contained well above 1.1661 support to bring rally resumption.
In the bigger picture, an important bottom was formed at 1.0339 on bullish convergence condition in weekly MACD. Sustained trading above 55 month EMA (now at 1.1768) will pave the way to key fibonacci level at 38.2% retracement of 1.6039 (2008 high) to 1.0339 (2017 low) at 1.2516. While rise from 1.0339 is strong, there is no confirmation that it's developing into a long term up trend yet. Hence, we'll be cautious on strong resistance from 1.2516 to limit upside. For now, medium term outlook will remain bullish as long as 1.1295 support holds, in case of pull back.
Dollar Back Under Pressure after All the Way Bad Non-Farm Payroll Report
* Quick update: Dollar reversed post NFP loss quickly, except versus Canadian Dollar. Further recovery is seen after ISM manufacturing beat expectation and rose to 58.8 in August.
Dollar is back under selling pressure in early US session after all the way bad non-farm payroll report. NFP showed only 156k growth in August, below expectation of 180k. Prior month's figure was revised down from 209k to 189k. Unemployment rate rose to 4.4%, up from 4.3%. And more disappointingly, average hourly earnings grew a mere 0.1% mom, below expectation of 0.2% mom and slowed from prior month's 0.3% mom. EUR/USD took out 1.1928 minor resistance and should have completed this week's pull back. Further rise is now in favor through 1.2 handle back to retest 1.2069 high. USD/CAD dives through 1.2412 low and is now resuming medium term down trend. US will also release ISM manufacturing later today but it's unlikely to help the greenback.
Former ECB President Trichet: Euro strength due to Dollar problems
Former ECB President Jean-Claude Trichet said that there are a lot of factors behind Euro's strength. One of them is that "real economy in Europe is picking up now very, very visibly." But he emphasized that "U.S. difficulty and particularly the hesitation on what to do as regards (with) new investment, as regards (with) taxation and so forth - and the difficulty of the present (U.S.) administration are playing also an important role. And, "because the problem is more that the dollar is weak vis-à-vis all currencies (rather) than the euro is very strong vis-à-vis all currencies."
According to a Reuters poll, nearly 3/4 of 66 economists surveyed expected ECB to announce a change in the quantitative easing program in October. Only 15 expected it at the September 7 meeting next week. All respondents expected that ECB will extend the asset purchase beyond December, but reduce the monthly amount from EUR 60b. Most expected a EUR 20b reduction to EUR 40b a month. Meanwhile, 58 of 63 economists who answered an extra question said ECB will completely end the asset purchase by the end of next year. Among them, 10 expected it to end by June.
In our report ECB Policy Stance Not to be Affected by Strong Euro, we also argue that recent strength is due to the unattractiveness of other currencies. And, while September may not be the timing for an announcement, the strength of Euro is unlikely to alter ECB's stance. And the central bank will still conclude the tapering plan latest in October.
Also from Eurozone, PMI manufacturing was finalized at 57.4 in August, unrevised. Germany PMI manufacturing was revised down to 59.3. France PMI manufacturing was unrevised at 55.8. Italy PMI manufacturing rose to 56.3 in August, up from 55.1, above expectation of 55.3. From Swiss, SVME PMI rose to 61.2 in August, up from 60.9, above expectation of 60.2. Swiss retail sales dropped -0.7% yoy in July.
More verbal changes between EU and UK on Brexit
The verbal exchanges between EU and UK officials regarding Brexit negotiation continue to heat up. EU Parliament's Brexit coordinator Guy Verhofstadt said that "UK ministers seem to want to devise a new customs union and seek to recreate all of the EU's structures, in order to continue to benefit from the best elements of the EU, without it being called the EU". He criticized that as "not serious, fair or even possible given the negotiating time remaining". Verhofstadt emphasized that "The UK has informed us it is leaving, which we regret -- but all we have ever asked for is that this disruptive decision is implemented in an orderly fashion and that we first agree to the divorce before planning a new future together."
UK International Trade Secretary Liam Fox hit back at EU chief negotiator Michel Barnier, who said that UK is being mired in "nostalgia" rather than taking a realistic approach in the Brexit negotiation. Fox said that "We can't be blackmailed into paying a price on the first part". And, we think we should begin discussions on the final settlement because that's good for business, and it's good for the prosperity both of the British people and of the rest of the people of the European Union."
Meanwhile, UK's Brexit Secretary David Davis said that the's a "determined optimist" about Brexit talks. "Because I fundamentally believe that a good deal is in the interests of both the UK and the EU and the whole of the developed world." And he emphasized that "the answer to that concern is not to turn inwards and become isolationist. And that is where a strong, outward looking United Kingdom can play an instrumental role."
There are only two more rounds of meeting scheduled before EU summit on October 19-20. It's looking rather unlikely that "sufficient progress" would be made by then for moving on to trade agreement.
UK PMI manufacturing beat expectations
UK PMI manufacturing rose to 56.9 in August, up from 55.1, beat expectation of 55.0. That's also the highest level in four months. Director at IHS Markit Rob Dobson noted in the statement that "the manufacturing economy remains in good health despite Brexit uncertainty". And, that "should help support ongoing growth in the economy in the third quarter, which will add fuel to hawkish policy makers' calls for higher interest rates."
China PMI showed improved manufacturing sector
China PMI Caixin PMI manufacturing rose to 51.6 in August, up from 51.1, above expectation of 51.0. Caixin and IHS Markit noted in the statement that "companies expanded their production schedules and buying activity, while business confidence rose to its highest for five months." And, that was result of solid foreign demand that drove new order growth and export sales. Zhengsheng Zhong, Director of Macroeconomic Analysis at CEBM Group, also said in the accompanying statement that "overall operating conditions of the manufacturing sector improved further as market demand strengthens, but if prices rise too quickly the profitability of companies in the middle of a supply chain may be under pressure."
Also released in Asian session, Japan consumer confidence dropped to 4.3.3 in August, down from 43.8 and missed expectation of 43.6. PMI manufacturing was revised down to 52.2 in August. Capital spending rose only 1.5% in Q2. From New Zealand, terms of tarde index rose 1.5% qoq in Q2, below expectation of 3.0% qoq.
EUR/USD Mid-Day Outlook
Daily Pivots: (S1) 1.1850; (P) 1.1881 (R1) 1.1939; More...
EUR/USD's strong rebound suggests that pull back from 1.2069 has completed at 1.1822 already. Intraday bias is turned back to the upside for retesting. 1.2069 first. Break there will resume medium term rise from 1.0339 and should target next key fibonacci level at 1.2516. On the downside, below 1.1878 minor support will extend the correction from 1.2069 with another fall. But downside should be contained well above 1.1661 support to bring rally resumption.
In the bigger picture, an important bottom was formed at 1.0339 on bullish convergence condition in weekly MACD. Sustained trading above 55 month EMA (now at 1.1768) will pave the way to key fibonacci level at 38.2% retracement of 1.6039 (2008 high) to 1.0339 (2017 low) at 1.2516. While rise from 1.0339 is strong, there is no confirmation that it's developing into a long term up trend yet. Hence, we'll be cautious on strong resistance from 1.2516 to limit upside. For now, medium term outlook will remain bullish as long as 1.1295 support holds, in case of pull back.
Economic Indicators Update
| GMT | Ccy | Events | Actual | Forecast | Previous | Revised |
|---|---|---|---|---|---|---|
| 22:45 | NZD | Terms of Trade Index Q/Q Q2 | 1.50% | 3.00% | 5.10% | 3.90% |
| 23:50 | JPY | Capital Spending Q2 | 1.50% | 8.30% | 4.50% | |
| 00:30 | JPY | PMI Manufacturing Aug F | 52.2 | 52.8 | 52.8 | |
| 01:45 | CNY | Caixin PMI Manufacturing Aug | 51.6 | 51 | 51.1 | |
| 05:00 | JPY | Consumer Confidence Index Aug | 43.3 | 43.6 | 43.8 | |
| 07:15 | CHF | Retail Sales (Real) Y/Y Jul | -0.70% | 1.70% | 1.50% | 1.70% |
| 07:30 | CHF | SVME PMI Aug | 61.2 | 60.2 | 60.9 | |
| 07:45 | EUR | Italy Manufacturing PMI Aug | 56.3 | 55.3 | 55.1 | |
| 07:50 | EUR | France Manufacturing PMI Aug F | 55.8 | 55.8 | 55.8 | |
| 07:55 | EUR | Germany Manufacturing PMI Aug F | 59.3 | 59.4 | 59.4 | |
| 08:00 | EUR | Eurozone Manufacturing PMI Aug F | 57.4 | 57.4 | 57.4 | |
| 08:30 | GBP | PMI Manufacturing Aug | 56.9 | 55 | 55.1 | |
| 12:30 | USD | Change in Non-farm Payrolls Aug | 156K | 180K | 209K | 189k |
| 12:30 | USD | Unemployment Rate Aug | 4.40% | 4.30% | 4.30% | |
| 12:30 | USD | Average Hourly Earnings M/M Aug | 0.10% | 0.20% | 0.30% | |
| 13:30 | CAD | Manufacturing PMI Aug | 54.6 | 55.5 | ||
| 13:45 | USD | Manufacturing PMI Aug F | 52.8 | 52.6 | 52.5 | |
| 14:00 | USD | ISM Manufacturing Aug | 58.8 | 56.5 | 56.3 | |
| 14:00 | USD | ISM Prices Paid Aug | 62 | 63 | 62 | |
| 14:00 | USD | U. of Michigan Confidence Aug F | 96.8 | 97.3 | 97.6 | |
| 14:00 | USD | Construction Spending M/M Jul | -0.60% | 0.50% | -1.30% |
DAX Gains Ground As Eurozone, German Mfg. PMIs Show Strong Expansion
The DAX index has posted gains in the Friday session. The DAX is currently trading at 12,152.50, up 0.80% on the day. On the release front, European manufacturing reports were as expected. German Manufacturing PMI improved to 59.3, close to the forecast of 59.4 points. The Eurozone Manufacturing PMI showed a similar trend, rising to 57.4, which matched the estimate. In the US, the focus will be on employment data, led by nonfarm payrolls.
The robust German economy has led the way for a stronger eurozone economy, and there was further good news on Friday, as German and eurozone manufacturing PMIs improved in August and indicated strong expansion. Manufacturing was buoyed by domestic demand as well as a stronger global economy which has increased demand for German and European exports. The sharp readings underscore improvement in the eurozone economy, which has led to speculation that the ECB may taper its ultra-accommodative monetary policy. The bank’s assets purchases program is scheduled to end in December, and analysts expect the ECB to withdraw stimulus in early 2018. Still, the ECB has not provided much guidance as to its plans. ECB President Mario Draghi opted not to discuss monetary policy at last week’s meeting of central bankers at Jackson Hole, which has increased speculation that the issue will be addressed at the bank’s policy meeting on September 7. In June, Draghi spoke in positive terms about the eurozone economy, and the markets seized on his comments and sent the euro soaring. Given this kind of market behavior, any comments about monetary policy at next week’s policy meeting could have a strong impact on the euro.
After a sparkling US GDP report on Wednesday, will nonfarm payrolls follow suit? The markets are braced for a weak reading, with nonfarm payrolls forecast to weaken to 180 thousand. If these key reports don’t beat expectations, the US dollar could lose ground. The markets will be keeping a close eye on US wage growth numbers, as a weak reading would signify that inflation levels remains soft, and could lower the likelihood of a rate hike in December, which is currently below 40%.
Euro Unchanged As German, Eurozone Mfg. PMIs Meet Expectations
EUR/USD continues to hover close to the 1.19 line in the Friday session. Currently the pair is trading at 1.1924, up 0.03% on the day. On the release front, manufacturing reports were as expected. German Manufacturing PMI improved to 59.3, close to the forecast of 59.4 points. The Eurozone Manufacturing PMI showed a similar trend, rising to 57.4, which matched the estimate. In the US, the focus will be on employment data, with the release of Average Hourly Earnings and Nonfarm Payrolls. This will be followed by ISM Manufacturing PMI.
The German and eurozone manufacturing sectors continued to show strong expansion in August, buoyed by domestic demand as well as a stronger global economy which has increased demand for German and European exports. The sharp readings underscore improvement in the eurozone economy, which has led to speculation that the ECB may taper its ultra-accommodative monetary policy. The bank’s assets purchases program is scheduled to end in December, and analysts expect the ECB to withdraw stimulus in early 2018. Still, the ECB has not provided much guidance as to its plans. ECB President Mario Draghi opted not to discuss monetary policy at last week’s meeting of central bankers at Jackson Hole, which has increased speculation that the issue will be addressed at the bank’s policy meeting on September 7. In June, Draghi spoke in positive terms about the eurozone economy, and the markets seized on his comments and sent the euro soaring. Given this kind of market behavior, any comments about monetary policy at next week’s policy meeting could have a strong impact on the euro.
After a sizzling US GDP report on Wednesday, will we see an encore from wage growth and nonfarm payrolls? The markets are braced for weak readings, with Average Hourly Earnings expected to gain just 0.2%, and nonfarm payrolls forecast to weaken to 180 thousand. If these key reports don’t beat expectations, the US dollar could lose ground. The markets will be keeping a close eye on the wage growth numbers, as a weak number would signify that inflation levels remains soft, and could lower the likelihood of a rate hike in December, which is currently below 40%.
Technical Outlook: WTI Oil Eases After Strong Recovery Rally On Thursday
WTI Oil price eased on Friday after previous day's strong rally which pared a part of heavy losses that oil suffered this week. Recovery on profit-taking peaked at $47.45 (capped by Fibo 38.2% of $50.41/$45.57 descend) on Thursday, but oil prices remain under strong pressure after Hurricane Harvey paralyzed over a quarter of US refining industry and reduced refinery demand for crude oil.
Overall picture remains negative, as WTI contract is on track for the fifth weekly close in red and the biggest weekly fall since the first week of July.
Negative fundamentals are supported by bearish technicals, as studies on daily chart remain in full bearish setup and maintain downside pressure.
Daily Tenkan-sen limited Thursday's recovery and caps today's action, marking initial resistance at $47.02, along with daily cloud which twists on Monday, expected to pressure the price.
Break below the base of narrowing daily cloud ($47.52) would open $46.30 (Fibo 61.8% of Thursday's rally) and risk further weakness on break.
Only sustained break above Tenkan-sen and lift above Thursday's high would sideline immediate bearish pressure and signal further recovery.
Res: 47.02, 47.45, 47.99, 48.56
Sup: 46.52, 46.30, 46.00, 45.57
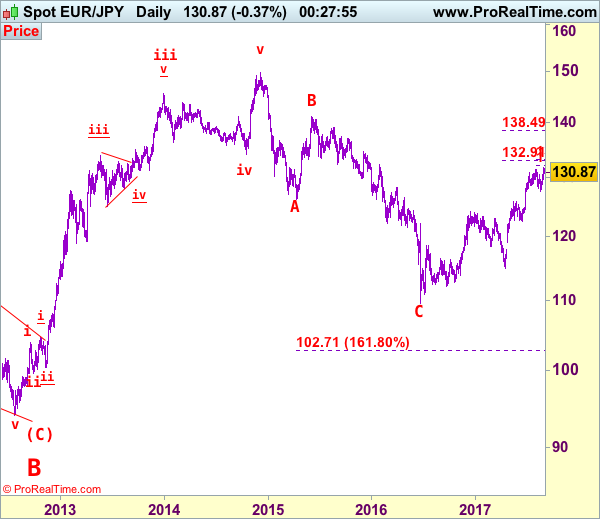
EUR/JPY Elliott Wave Analysis
EUR/JPY - 131.20
Although the single currency broke above previous resistance at 131.40 earlier this week, lack of follow through buying and current pullback from 131.71 suggest consolidation with initial mild downside bias would be seen and pullback to 130.00-10 cannot be ruled out, however, reckon minor support at 129.66 would limit downside and bring another rise later. Above said resistance at 131.71 would signal the major rise from 109.49 low (2016 low) is still in progress for further gain to 132.00-10, then 132.50-60, however, overbought condition should prevent sharp move beyond 133.10–15 (61.8% projection of 122.40-131.40 measuring from 127.56) and price should falter well below previous chart resistance at 134.59, bring retreat later.
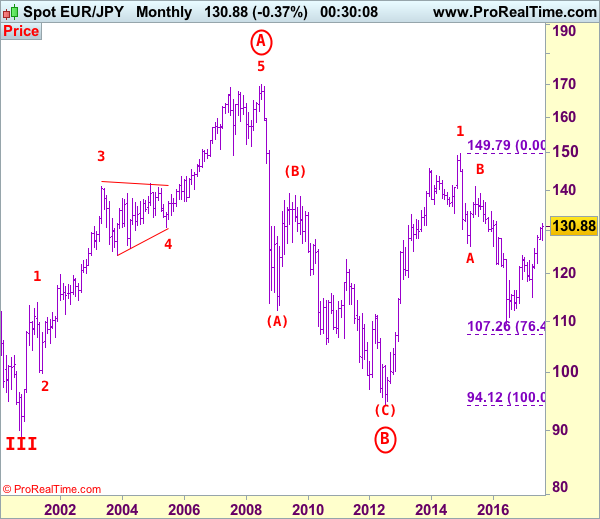
The daily chart is labeled as attached, early selloff from 169.97 (July 2008) to 112.08 is wave (A) of B instead of end of entire wave B and then the rebound from there to 139.26 is wave (B), hence, wave (C) has possibly ended at 94.12 with a diagonal triangle as labeled in the daily chart, hence upside bias is seen for further gain. Recent rally above indicated retracement level at 116.69 (50% Fibonacci retracement of the intermediate fall from 139.26-94.12) adds credence to this view and signal major reversal has commenced but first leg of this wave C has possibly ended at 149.79, hence wave 2 has commenced with wave A ended at 126.09, followed by wave B at 141.06, wave C commenced and could have ended at 109.49, above 126.00 would add credence to this view, then headway to 130.00 would follow.
On the downside, whilst initial pullback to 130.00-10 is likely, reckon downside would be limited to 129.60-70 and bring another rise later. Below previous resistance at 129.18 would suggest top is possibly formed, risk weakness to 128.45-50 but break there is needed to add credence to this view, bring retracement of recent rise to 128.00-10, then towards previous support at 127.56 which is likely to hold from here. In the event euro drops below 127.56, this would signal correction of recent upmove has commenced and bring subsequent fall to 126.45-50 and later towards previous resistance at 125.82 which is likely to remain intact.
Recommendation: Stand aside for this week.
To re-cap the corrective upmove from the record low of 88.93 (18 Oct 2000), the wave A from there is subdivided as: 1:88.93-113.72, 2:99.88 (1 Jun 2001), 3:140.91 (30 May 2003), 4:124.17 (10 Nov 2003) and 5 ended at record high of 169.97 (21 Jul 2008). The brief but sharp selloff to 112.08 is viewed as a-b-c x a-b-c wave (A) of B. The subsequent rebound to 139.26 is (B) of B and (C) of (B) has possibly ended at 94.12 and in any case price should stay well above previous chart support at 88.93, bring rally in larger degree wave C towards 150.00.