Sample Category Title
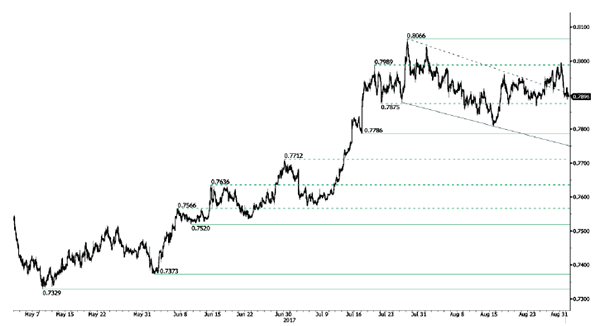
AUD/USD Moving Lower
AUD/USD has broken downtrend channel. Hourly support can be found at 0.7786 (18/07/2017 low). Hourly resistance is given at 0.8066 (27/07/2017 high). Expected to further consolidate.
In the long-term, we are waiting for further signs that the current downtrend is ending. Key supports stand at 0.6009 (31/10/2008 low) . A break of the key resistance at 0.8295 (15/01/2015 high) is needed to invalidate our long-term bearish view.
USD/CAD Heading Higher
USD/CAD buying pressures are back. Hourly support is given at a distance at 1.2414 (27/07/2017 low) while resistance is now given at a distance at 1.2778 (15/08/2017 low). Expected to show renewed short-term bearish pressures if resistance at 1.2778 holds.
In the longer term, the pair has broken longterm support that can be found at 1.2461 (16/03/2015 low) before bouncing back. Strong resistance is given at 1.4690 (22/01/2016 high). The pair should head further lower.
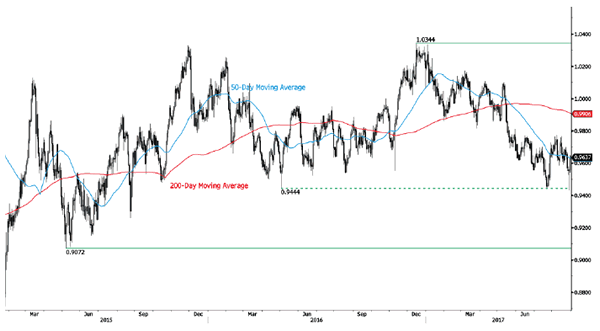
USD/CHF Bouncing Back Higher
USD/CHF is trading up. Strong resistance is given at 0.9771 (15/06/2017 high). The pair is likely to head further lower way below the broken hourly support at 0.9584 (08/11/2017 low). Expected to show renewed bearish pressures.
In the long-term, the pair is still trading in range since 2011 despite some turmoil when the SNB unpegged the CHF. Key support can be found 0.8986 (30/01/2015 low). The technical structure favours nonetheless a long term bullish bias since the unpeg in January 2015
USD/JPY Short-Term Increase
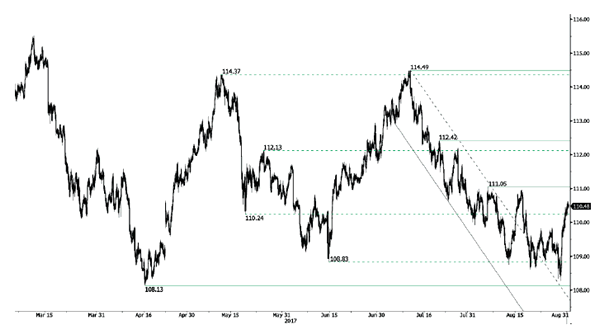
USD/JPY is bouncing off support at 108.13 (17/04/2017 low). The pair is heading towards resistance at 111.05 (04/08/2017 high). Expected to show another leg higher.
We favor a long-term bearish bias. Support is now given at 96.57 (10/08/2013 low). A gradual rise towards the major resistance at 135.15 (01/02/2002 high) seems absolutely unlikely. Expected to decline further support at 93.79 (13/06/2013 low).
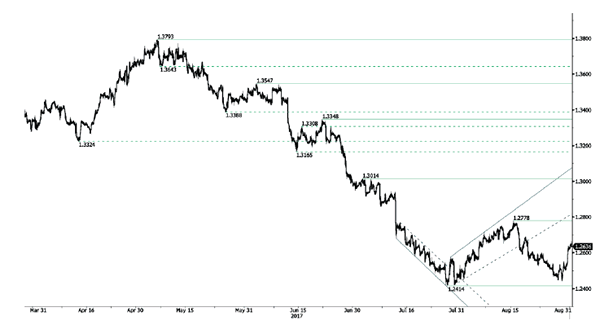
GBP/USD Important Downside Risks
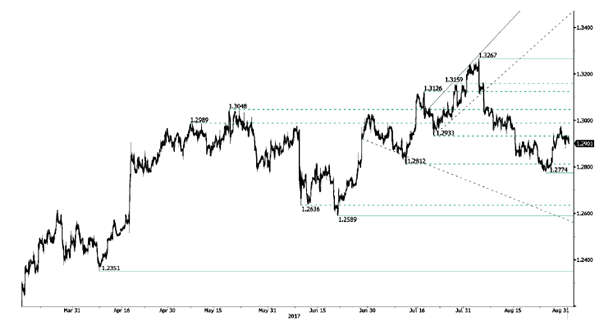
GBP/USD bearish momentum has bounced around support given at 1.2774 (24/08/2017 high). Hourly resistance is given at 1.3031 (11/08/2017 high). Expected to show short-term bearish pressures.
The long-term technical pattern is even more negative since the Brexit vote has paved the way for further decline. Long-term support given at 1.0520 (01/03/85) represents a decent target. Long-term resistance is given at 1.5018 (24/06/2015) and would indicate a long-term reversal in the negative trend. Yet, it is very unlikely at the moment.
EUR/USD Continued Consolidation
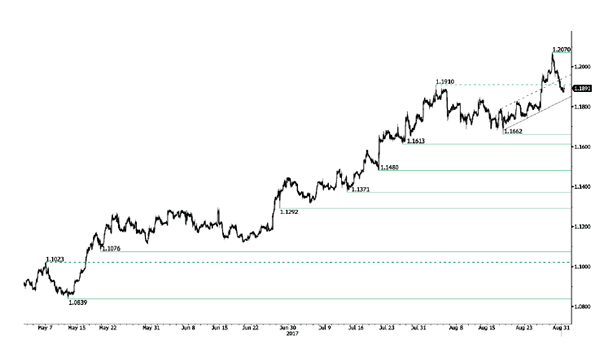
EUR/USD is consolidating lower. Hourly resistance can be found at 1.2070 (29/08/2017 high) while hourly support lies at a distance at 1.1662 (17/08/2017 low). Expected to show increasing bearish pressures.
In the longer term, the momentum is now turning largely positive. We favour a continued bullish bias. Key resistance is holding at 1.2252 (25/12/2014 high) while strong support lies at 1.0341 (03/01/2017 low).
Strong Data Ignites Dollar Rally
USD buoyed amid upside surprise in growth data
The US dollar received a much needed fresh boost yesterday amid the release of better-than-expected data from the world’s largest economy. Firstly, the second print on the second quarter GDP was revised to 3%q/q (annualised) from 2.6% first estimate amid a substantial upside revision to customer spending and stronger business investment. Personal consumption edged up to 3.3%q/q (annualised) from 3%.
In the jobs market, the employment report released by ADP saw a sharp rise in payrolls in August. Us companies added 237,000 jobs in August (versus 189,000 estimated), while previous month’s reading was upwardly revised to 201,000 from 178,000. It does bode well for Friday’s NFPs!
The greenback extended gains against all G10 currencies yesterday. The worst performer was the New Zealand dollar that fell 1.35% with NZD/USD on its way to test its 200dma that currently stands at $0.7130. The Canadian dollar also suffered a small sell-off with USD/CAD climbing as high as 1.2663.
The show will go on today as a fresh batch of key data is due for release. Personal income and spending, which are both expected to have improved in July (+0.3%m/m and +0.4%m/m respectively) will be published this afternoon. Then the Fed’s favourite measure of inflation, core personal consumption expenditures, should have eased further in July as economists expect a reading of 1.4%y/y. Finally, July’s NFPs (180k exp and 205k prior), together with the complete jobs report, will be published on Friday.
The mood is slowly starting to shift in favour of the USD, finally. Therefore it is reasonable to expect the greenback to extend gains rapidly, especially should the US economy continue to surprise investors in a good way. After tumbling more 1.50% yesterday, EUR/USD takes a breather at around 1.1890. Even though we maintain our bearish on the pair, a negative surprise in data this afternoon could nip the USD recovery in the bud. Indeed, investors will remain highly sensitive to hard data ahead of the next FOMC meeting.
Hurricane Harvey may impact crude oil prices
The U.S Energy Department has released US inventories data which shows a decline of 5.932 million barrels during the week ending August 25. It is the ninth consecutive weeks of decline and crude oil has lost 1% and is now challenging its 6-week low.
The tropical storm Harvey is ravaging Houston and some US refineries out there are now closed temporarily. Yet, markets are clearly not fearing any potential shortages within the short-term. Indeed, Crude oil is most of the time very easy to replace. This is why we think that any shortage longer than a week or ten day will drive crude oil prices higher. For the time being, this natural disaster is not particularly weighing on prices.
The trend in the US rig count is bearish due to sustainable low prices. Now markets will start pricing in the next OPEC meeting late November. We do not consider that any production cut will be applied. The market share war will continue and no relief to the US refinery industry are on the roadmap.
Anyway, we keep on believing that the upside pressures on oil are likely. In particular, at the moment, there is a seasonal effect that is back. In September the demand for crude oil is likely to increase as the summer season is over and overproducing oil is definitely not a viable long-term project.
Crude Oil Drops As Harvey Swamps Inventories
Crude couldn't rally on much lower inventories as Harvey and spread trading swamps Brent Crude finally.
Hurricane Harvey submerged another massive drawdown in the official U.S. Crude Inventories last night, washing Brent by two percent in the process. The reduction came in at -5.4 million barrels against an expected 1.75 million drawdown. It continues the trend of falling oil in storage in the U.S. The data, however, was collected pre-Harvey and with fully 25% of the U.S. refining capacity offline, the stress is being felt in refined downstream products with gasoline process hitting two-year highs. Next week's inventory numbers, should the data even be able to be collected, will likely show a substantial increase as crude pumped out of the ground searches for a refinery home to go to that isn't under water.
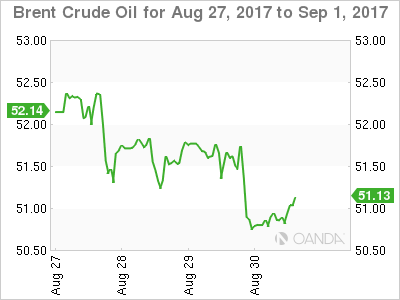
Brent
Brent spot fell from 51.75 to 50.75, trading in Asia a smidgen higher at 50.85 this morning. It has broken a rising trend line support at 51.10 in the process which becomes intraday resistance. Must hold support now is a triple bottom at 49.90 with a daily close implying a deeper correction is possible to the 47.00 area. Until this line is broken, however, the technical picture remains that Brent is in a long term consolidation of its past month's gains.
WTI
WTI spot, by contrast, fell only 50 cents overnight from 46.20 to 45.70, opening in Asia at 45.80. The relative outperformance versus Brent could be due to a couple of factors. Firstly, a lot of Hurricane Harvey bad news is now built into the price against a background of lower inventories anyway. Secondly, with the premium of Brent over WTI having moved to multi-year highs, traders may have been tempted to sell Brent and buy WTI to take advantage of this.
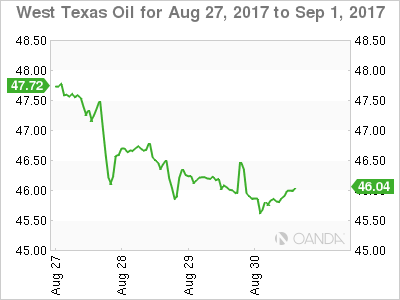
WTI spot has support at the 45.00 area and resistance at 47.00, but will most likely trade of Harvey headlines and spread traders.
Solid US Data Help The Dollar To Recover Further
The dollar continued to recover on Wednesday following stronger-than-expected US economic data. The greenback has been in a recovery mode since Tuesday and accelerated after both the ADP employment report for August and the 2nd estimate of Q2 GDP came out much better than expected.
These data are more than welcome for FOMC policymakers, who are in the very difficult position to decide the proper timing for the next increase in borrowing costs. Actually, yesterday's releases helped the probability for another rate hike by year-end to rise to near 41% from roughly 33% on Tuesday. If the official jobs data tomorrow confirm that the US economy enjoyed another month of stellar employment gains, that probability could rise further.
Having said that though, we have to repeat that the biggest determinant on whether the Fed will proceed with another hike this year is inflation. The minutes of the July gathering showed that the number of policymakers who are concerned with regards to inflation has increased. As such a decent rebound in prices is needed to make some of them change their mind. The next CPI data are scheduled for the 14th of September, less than a week before the Fed meets to decide on policy. Although a single improvement may not be enough to guarantee a September hike, it could revive hopes that more encouraging prints may allow that to happen in December.
Eurozone inflation data take center stage
Today, Eurozone's preliminary CPIs for August will take center stage. The forecasts are mixed, with the headline rate expected to tick up and the core rate anticipated to tick down. We share the view for an uptick in the headline rate, but we see the risks surrounding the core forecast as tilted to the upside, perhaps for an unchanged rate, or even a fractional increase.
We base our view for the headline rate on the bloc's composite PMI for the month, which showed that output prices rose at the fastest pace in three months. In addition, Germany's CPI rate came in higher than anticipated, which enhances the likelihood for a similar reaction in the bloc's print. As for the core rate, the yearly change in oil prices remains close zero, which makes us believe that if the headline inflation rate indeed increases, the core rate may move in a similar fashion. Any positive surprise in these rates could heighten speculation that the ECB is set to announce some changes to its QE program soon and thereby, bring EUR under renewed buying interest.
EUR/USD continued sliding yesterday, falling below the support (now turned into resistance) of 1.1900 (R1). Although the rate may continue a bit lower and perhaps challenge the key support of 1.1830 (S1), we still believe that the broader path remains positive. On the daily chart, the pair continues to trade above the medium-term uptrend line taken from the low of the 17th of April. Encouraging inflation prints from Eurozone today may be proven the catalyst for a rebound from near the 1.1830 (S1) support. A break back above 1.1900 (R1) may confirm the rebound and could set the stage for extensions towards the round number of 1.2000 (R2).
As for today's events:
Besides Eurozone's CPIs, we get Canada's GDP data for Q2. Our own view is that the nation's economy may have grown at the same pace as previously, with downside risks. Even though April's and May's average monthly GDP is roughly equal to the average of the Q1 monthly prints, the soft retail sales for June suggest that the economy may have lost some momentum towards the end of Q2. A potential slowdown could hurt the Loonie somewhat on the news, but we doubt that it will have much effect on the elevated market expectations regarding another BoC rate hike this year, as a slight slowdown would still be in line with the Bank's latest forecasts.
USD/CAD edged north yesterday following the strong US data. The rate emerged above the resistance (now turned into support) of 1.2600 (S1) and now looks to be headed towards the 1.2700 (R1) barrier, defined by the peak of the 18th of August. A slowdown in Canada's economic growth may help the pair to reach that level and if the bulls are strong enough to break it, then we may see extensions towards our next resistance of 1.2775 (R2).
As for the bigger picture, although USD/CAD may trade higher for a while, it remains below the longer-term downtrend line taken from the peak of the 11th of May. This combined with the fact that on the 29th of August the rate failed to break the key support of 1.2415 (S3) and instead formed a low fractionally higher than that level, make us take the sidelines with regards to the overall outlook of this pair. The picture may become clearer next week when the BoC meets to decide on interest rates.
From the US, we get personal income & spending, as well as the core PCE price index, all for July. Both the income and spending rates are expected to have risen from the previous month, while no forecast is available for the PCE index. Given that the core CPI rate for the month remained unchanged, our own view is that the core PCE rate may have held steady as well. We also get the nation's Chicago PMI for August, pending home sales for July, and initial jobless claims for the week ended August 25th.
We have two speakers on the agenda: BoE MPC member Michael Saunders and Dallas Fed President Robert Kaplan.
EUR/USD
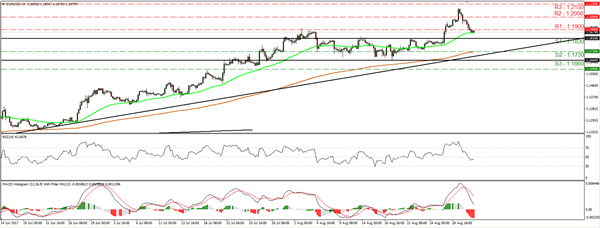
Support: 1.1830 (S1), 1.1730 (S2), 1.1660 (S3)
Resistance: 1.1900 (R1), 1.2000 (R2), 1.2100 (R3)
USD/CAD
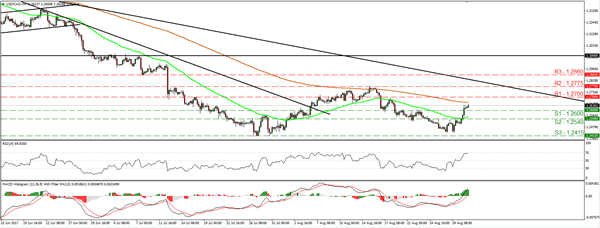
Support: 1.2600 (S1), 1.2540 (S2), 1.2415 (S3)
Resistance: 1.2700 (R1), 1.2775 (R2), 1.2860 (R3)
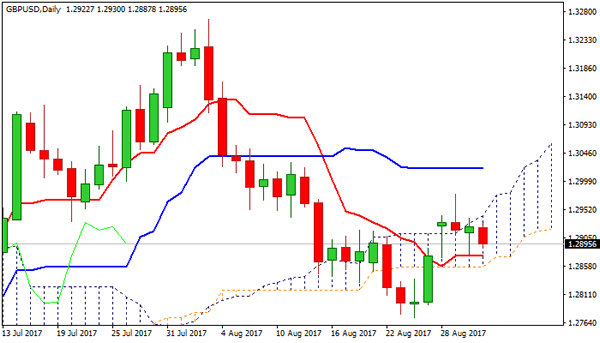
Technical Outlook: GBPUSD – Softer Tone On Thursday But No Clear Direction While Within The Cloud
Cable is holding soft tone on Thursday and trades within daily cloud, with fresh weakness probing below 1.2900 handle, following strong downside rejection at 1.2875 (daily Tenkan-sen) on Wednesday.
Subsequent bounce was capped by daily cloud top, below which the pair closed for the day, signalling that the downside remains vulnerable.
Studies on daily chart are turning to full bearish setup, seeing risk of retesting Tenkan-sen and cloud base (1.2857). Firm break here is needed to signal further weakness and confirm lower top at 1.2978 (29 Aug upside rejection).
Falling 20SMA maintains downside pressure, however, the pair may extend action without clear direction while the price holds within the cloud.
Alternative scenario requires lift above 55 SMA (1.2938) to ease immediate downside pressure, but close above cracked Fibo 38.2% of 1.3268/1.2773 descend at 1.2962 is needed to turn near-term bias higher.
Res: 1.2918, 1.2942, 1.2962, 1.2983
Sup: 1.2875, 1.2857, 1.2821, 1.2793