Sample Category Title
Trade Idea: GBP/USD – Buy at 1.2845
GBP/USD – 1.2886
New strategy :
Buy at 1.2845, Target:1.3045, Stop: 1.2785
Position: -
Target: -
Stop:-
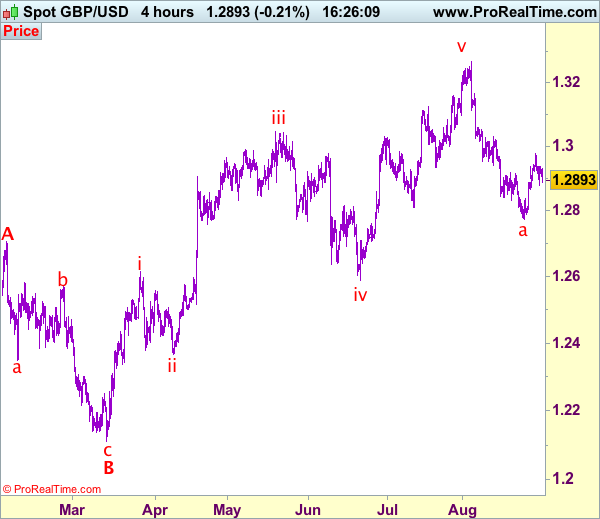
Although cable’s retreat from this week’s high of 1.2979 has kept price under near term pressure and initial downside risk remains for weakness to 1.2840-50, if our view that low has been formed at 1.2774 is correct, downside should be limited and 1.2800-10 should hold, bring another rebound later, above 1.2940-5- would signal the retreat from 1.2979 has ended, bring another bounce to this level, above there would add credence to this view and extend the corrective rise from 1.2774 low for retracement of recent decline from 1.3269 to 1.3000 and possibly towards resistance at 1.3032.
In view of this, would be prudent to buy sterling on further fall. Below 1.2800-10 suggest the rebound from 1.2774 has ended instead, risk retest of this level, break there would extend the selloff from 1.3269 top to 1.2750, then towards 1.2700-10 later.
Our preferred count on the daily chart is that cable's rebound from 1.3500 (wave (A) trough) is unfolding as a wave (B) with A ended at 1.7043, followed by triangle wave B and wave C as well as wave (B) has ended at 1.7192, the subsequent selloff is the larger degree wave (C) which is still unfolding with minor wave (III) of larger degree wave 3 ended at 1.1986, hence wave (IV) correction is in progress which could either be a triangle wave (IV) of a complex formation but upside should be limited to 1.3500 and price should falter well below 1.4000, bring another decline in wave (V) of 3 for weakness to 1.1500, then 1.1200.
Trade Idea: GBP/JPY – Buy at 141.60
GBP/JPY - 142.45
Original strategy:
Exit short entered at 142.00
Position: -
Target: -
Stop: -
New strategy :
Buy at 141.60, Target: 143.60, Stop: 141.00
Position: -
Target: -
Stop:-
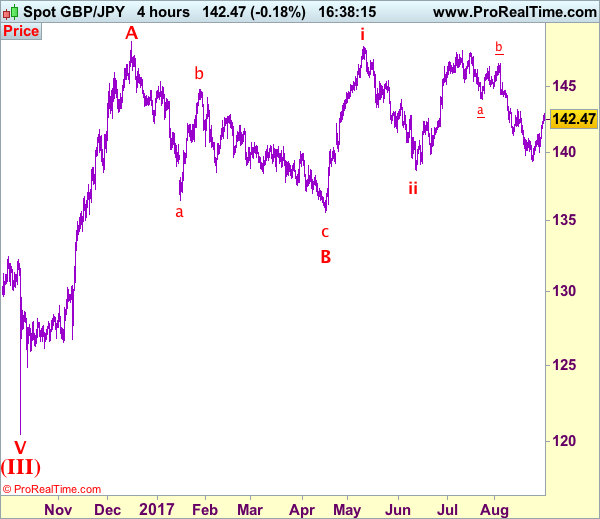
As the British pound has surged again after staging a strong rebound from 139.35 (last week’s low), suggesting recent decline has ended there and consolidation with mild upside bias is seen for this move to bring at least a strong retracement of recent decline, hence further gain to 143.20 would be seen, however, near term overbought condition should limit upside to 143.50-60 and reckon 144.00-10 would hold from here.
In view of this, would be prudent to turn long on pullback as 141.50-60 should limit downside. Below previous resistance at 141.40 would defer and risk weakness to 141.00 but reckon downside would be limited to 140.40-45, price should stay well above support at 140.05 and bring another rebound later.
Our preferred count is that larger degree wave V with circle is unfolding from 251.12 with wave (I) 219.34, (II): 241.38 and wave (III) is subdivided into 1: 192.60, 2: 215.89 (23 Jul 2008) and wave 3 ended at 118.87 earlier in 2009. The correction from there to 162.60 is wave 4 which itself is a double three and is labeled as first a-b-c ended at 151.53, followed by wave x at 139.03, 2nd a ended at 162.60, 2nd b at 146.75 and 2nd c leg of wave 4 ended at 163.00. Therefore, the decline from 163.00 to 116.85 is now treated as wave 5 which also marked the end of larger degree wave (III), hence wave (IV) major correction has commenced for retracement of the wave (III) from 241.38 and upside target at 183.95-00 (50% Fibonacci retracement of the wave (II) from 241.38) had been met, a drop below 160.00 would suggest wave (IV) has ended at 195.85, bring decline in wave (V) for initial weakness to 130 (already met) and 120.
USDJPY Maintains Neutral Bias In Medium Term, Key 108 Support Holds
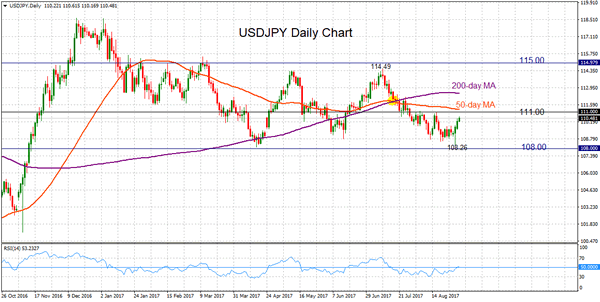
USDJPY maintains a neutral bias in the medium term and has been in a range between 108.00 and 115.00 since April. In the short term, the downside pressure has eased and prices bounced after touching a low of 108.26 last week.
The market has been holding above the year-to-date low of 108.12 which was reached on April 17. To the upside, the market looks capped below the July 11 high of 114.49.
The recovery from the multi-month low of 108.26 is still in progress as USDJPY gained upside momentum, while RSI is rising, breaking above 50 into bullish territory. There is scope to rise toward the mid-August high at 110.94. From here, clearing barriers at the key 111.00 level and 50-day moving average close-by would target 112.50 (200-day MA) ahead of a re-test of 114.49. Prices would need to rise above the top of the range at 115.00 in order to see a shift out of the medium-term neutral phase.
Meanwhile, a firm break of the 108.26 low and strong support at 108.00 would resume the whole corrective decline from 114.49 and shift the trend to bearish.
The underlying trend remains neutral for the medium-term while the short-term downtrend from 114.49 remains intact unless USDJPY moves above 111.00.
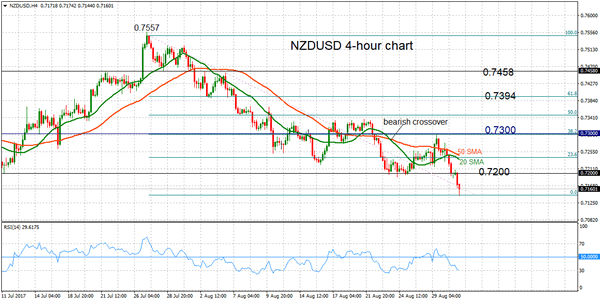
NZDUSD Increasingly Bearish After Drop Below 0.72
NZDUSD maintains a bearish bias as it resumed its downside following a break of a key level at 0.7200. The pair is now at its lowest level since June 6 at 0.7144. Both the short and medium-term picture has turned bearish.
Looking at the 4-hour chart, the downtrend that started from the July 27 high of 0.7557 remains in progress and is highlighted by the bearish crossover of the 20-period moving average with the 50-period MA on August 23. Momentum to the downside has gained traction as RSI is steeply sloping down. It should be noted that the indicator is approaching oversold levels at 30 which could result in a pause in the market’s descent for now.
Failure to rise back above the key support-turned-resistance level at 0.7200 anytime in the near term would increase downside pressure and strengthen the bearish case. From here, the focus would turn to another key area at 0.7057 which acted as support as well as resistance in the recent past. The key psychological 0.7000 level is another support which if broken would target the multi-month low at 0.6817 (touched on May 11).
A sustained move back into the 0.7200 handle would ease immediate downside pressure but only a rise back above the 0.7300 would help shift the focus back to the upside. Resistance at 0.7394 is important since it is the 61.8% Fibonacci retracement of the downtrend from the 0.7557 peak (July 27). Rising above it would target 0.7458 which is another key level that acted as both support and resistance recently. From here NZDUSD could see a re-test of the multi-year high at 0.7557 to change both the short-term and medium-term trend to bullish.
Trade Idea: EUR/JPY – Buy at 130.50
EUR/JPY - 131.43
Original strategy:
Buy at 130.50, Target: 132.50, Stop: 129.90
Position: -
Target: -
Stop: -
New strategy :
Buy at 130.50, Target: 132.50, Stop: 129.90
Position: -
Target: -
Stop:-
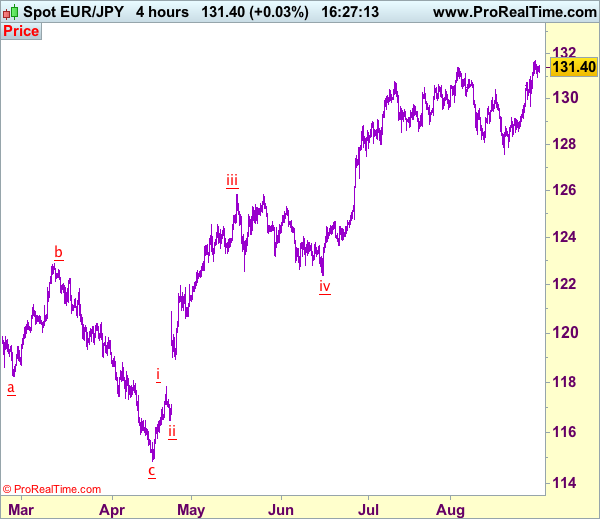
As the single currency has maintained a firm undertone after recent anticipated rally, reinforcing our bullish view that recent upmove has resumed and upside bias remains for this move to extend further gain to 132.00-10 but near term overbought condition should prevent sharp move beyond 132.50-60 and reckon 133.00-10 would hold from here, bring retreat later.
In view of this, would not chase this rise here and we are looking to buy euro on subsequent pullback as 130.45-50 should limit downside and bring another rise later. Below 130.00 would risk another test of said support at 129.66 but only break there would signal top is formed instead, risk correction to 129.10-15.
Our latest preferred count is that wave (ii) is ABC-X-ABC which ended at 123.33 and wave (iii) is unfolding with wave iii ended at 100.77, followed by wave iv at 111.57 and wave v as well as the wave (iii) has ended at 97.04, followed by wave (iv) at 111.43 and wave (v) has ended at 94.12 which is also the end of the larger degree v, this also implied the major wave (C) has also ended there, hence major correction has commenced from there with (A) leg unfolding in its lower degree wave c which has possibly ended at 145.69. Under this count, A-B-C wave (B) has commenced with A leg ended at 136.23, wave B at 143.79 and wave C has possibly ended at 149.79.
Our larger degree count is that the decline from 139.26 is wave (C) and is sub-divided into a diagonal triangle i-ii-iii-iv-v with wave i - 105.44, wave ii- 123.33, wave iii - 97.03, wave iv - 111.43, followed by the final wave v as well as the end of wave (C) at 94.12, this also mark the bottom of larger degree wave B. Under this count, major rise in wave C has commenced as an impulsive wave with minor wave III ended at 145.69, wave V is still in progress for further gain to 150.00. Having said that, this so-called wave V could well be the first leg of larger degree 5-waver wave C and this wave C should bring at least a retest of wave A top at 169.97 (July 2008).
Dollar Extends Gains As Economic Confidence Rises, Aussie Weaker After CAPEX, Kiwi Hits 2 ½ – Month Low
The dollar had a relatively winning battle against its peers overnight, extending its positive momentum after investors restored their confidence in the US economy despite geopolitical risks remaining high and huge damages from the ongoing tropical storm Harvey. On the other hand, the Australian dollar performed poorly, failing to find support on positive economic data, while the Kiwi was the worst performer after figures out of New Zealand came in disappointing.
While waters continued rising in southeast Texas and slow-moving powerful Harvey entered southwest Louisiana, causing death to at least 35 people and damage amounting to tens of billions of dollars, the greenback stretched its uptrend, digesting yesterday's upbeat data out of the country. Second estimates for GDP growth showed on Wednesday that the economy surprisingly expanded by a 3% pace, recording the fastest growth in a year. ADP National Employment report showed yesterday as well that employment in the private sector rose unexpectedly by 237,000 in August, signaling that non-farm payrolls, expected to be released on Friday, might also surprise to the upside.
Moreover, Trump during his first major speech on tax reforms on Wednesday in Missouri reiterated that corporate tax cuts are necessary to boost employment in America. The president called for corporate taxes to be reduced to 15% from 35%. On the same day, Trump, commenting on North Korea's most dangerous missile test which crossed above Japan and landed in the Pacific Ocean, said that “talking is not the answer”, while the US defense secretary Jim Mattis stated afterwards that “We are never out of diplomatic solutions”.
Later in the day, investors will keep a close eye on core PCE price index, initial jobless claims and pending home sales for additional evidence on the improving US economic conditions.
Dollar/yen jumped to a two-week high at 110.61 in the Asian session before it retreated to 110.52. Meanwhile, preliminary numbers on Japanese industrial production for the month of July, published earlier today, indicated that on a monthly basis, industrial output turned negative, decreasing by 0.8% and missing the forecast of a 0.5% fall. In June, industrial production increased by 2.2% m/m.
The euro extended its downtrend on the back of a stronger dollar ahead of the ECB policy meeting next week. Although recent figures out the area pointed to sustainable economic growth, ECB policymakers are anticipated to think twice about giving hawkish signals as they are now more concerned about euro's strength. Note that, euro/dollar reached 2 ½-year high of 1.1295 on Monday.
In Australia, new capital expenditure (CAPEX) was better than expected in the second quarter. While analysts forecasted businesses to spend 0.3% q/q more on new capital, the actual spending stood higher at 0.8%. However, this was below the previous mark of 0.9% which was upwardly revised from 0.3%.
Moreover, Australia's biggest export partner, China, released its PMI readings for the month of August. Manufacturing PMI edged up by 0.3 points to 51.7, surpassing the 51.3 forecasted. In contrast, non-manufacturing PMI declined by 1.1 points to 53.4.
The aussie retreated by 0.09% versus the greenback to $0.7899.
The kiwi performed poorly relative to its counterparts, sinking by 0.56% to a 2 ½-month low of $0.7143 before it inched up to $0.7162. This came after the ANZ business confidence index in New Zealand disappointed markets, decreasing by 1.1 points to 18.3 in August. Besides that, recent remarks from the RBNZ Governor Graeme Wheeler that a lower New Zealand currency was needed, weighed on the kiwi.
Turning to commodities, crude oil prices and gold were lower. WTI crude edged down by 0.02% to $45.95 per barrel, while Brent dropped by 0.20% to $50.76. Gold fell by 0.20% to $1305.80 per ounce.
Chinese Economic Data Support European Markets | Eurozone Inflation And French Labour Reforms Under Focus
The Chinese manufacturing PMI reading (51.7) came ahead of the market forecast (51.3)
The dot plots are telling us a very different picture in comparison to the Fed fund rate.
The ECB's last piece of the puzzle is keeping them on a leash from triggering the tapering process
European markets and US futures are trading higher due to the more optimistic reading of the Chinese economic data. We have additional encouraging signs for the economy and it established that the economic growth is picking up steam. The Chinese manufacturing PMI reading (51.7) came ahead of the market forecast (51.3). This indicates a more cheerful picture for the People Bank of China which is more inclined to curb its process of loose monetary policy. More healthy economic readings like this increase the odds that the PBoC would be more likely to achieve a new phase for its economy which is moderate growth. However, some are still hesitant about the recovery due to the lack of evidence in structural changes.
Having said that, we do anticipate the overall market reaction to remain reticent ahead of the key economic number, the US NFP data due tomorrow. The dot plots are telling us a very different picture in comparison to the Fed fund rate. Looking at the recent odds for another rate hike for this year, it douses any hopes for the dollar bulls because inflation data is in no rush to rear its head. Hurricane Harvey is going to create a major dent for the upcoming quarterly GDP readings. Similarly, the labour market would also feel the impact and an uptick in the unemployment claims isn't going to push the Fed closer to their targets.
When it comes to the Euro, there are two events where you want to keep your focus on. Yesterday we had the robust inflation number for Germany and today it is the Eurozone's inflation data. The ECB's last piece of the puzzle which is keeping them on a leash from triggering the tapering process. The expectations are that the number may have ticked up to 1.5% which would be a sturdy reading relative to the previous number of 1.3%. The ECB only needs to see this number keep improving, at least for now.
The other event has more of a historical importance in a sense that it would try to shake the foundation of the labour market in France. Emmanuel Macron, the French president has a vision for France and labour reforms are the very pillars which would support that. The country's Prime Minister is going to lay out a plan under which employers would have the bargaining power to not only negotiate the hours but also the pay. If successfully implemented, President Macron will be remembered in the history because in the past three decades many have talked about that, but no actions had followed. Edouard Philippe, the prime minister of the country, will be delivering his speech today and the markets will be watching the reaction very closely.
The dollar weakness means one thing, your decade's long relationship between metals and the dollar has come back to life. There is no doubt that the dollar index has shown some phenomenal upward moves from its recent low and yesterday it also gained a lot of strength from the revised US Q2 GDP number. After all, a bigger denominator number (the dollar) creates pressure for the metals. However, the long term trend for the dollar is skewed to the downside and this is behind the copper and aluminium strength. Because the economic growth under its own merit does not have the ability to push the metals to their current level. This is the key thing which is taking place in the metal market.
Trade Idea: AUD/USD – Stopped profit and stand aside
AUD/USD – 0.7999
Original strategy :
Bought at 0.7895, stopped profit at 0.7900
Position: - Long at 0.7895
Target: -
Stop: - 0.7900
New strategy :
Stand aside
Position: -
Target: -
Stop:-
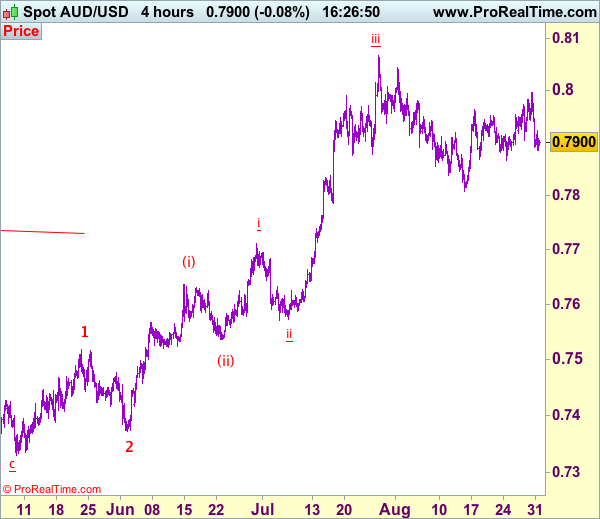
Aussie’s retreat from 0.7996 turned out to be much deeper than expected, dampening our bullishness and further consolidation would take place, near term downside risk remains for weakness to 0.7865-57, however, break there is needed to suggest the rebound from 0.7808 has ended instead, bring another leg of corrective decline towards this level later. Below 0.7808 would signal the wave iv correction from 0.8066 is still in progress for weakness to 0.7786 support, however, oversold condition should prevent sharp fall below 0.7750 and price should stay above i top at 0.7712, bring rebound later. We are keeping our latest bullish count that recent impulsive waves is unfolding as (1 2, (i)(ii), i ii) and may extend headway towards 0.8150.
In view of this, would be prudent to stand aside in the meantime. Above 0.7925-30 would bring another corrective bounce to 0.7950-60, however, said resistance at 0.7996 should hold, bring further choppy trading. Only above 0.7996-0.8000 would revive bullishness and signal the pullback from 0.8066 has ended, bring subsequent retest of this level.
On the 4-hour chart, the move from 0.8066 is the wave 5 with i: 0.8860, ii: 0.8315, wave iii is an extended move ended at 1.0183, iv: 0.9706 and wave v has ended at 1.1081 (also the top of entire wave 5). The subsequent selloff is the major correction which is unfolding as ABC-X-ABC and 2nd A leg has ended at 0.8848, followed by a-b-c wave B which ended at 0.9758, hence, 2nd C wave is now in progress and indicated downside target at 0.7000 and 0.6950 had been met, so further fall to 0.6710-20 cannot be ruled out.
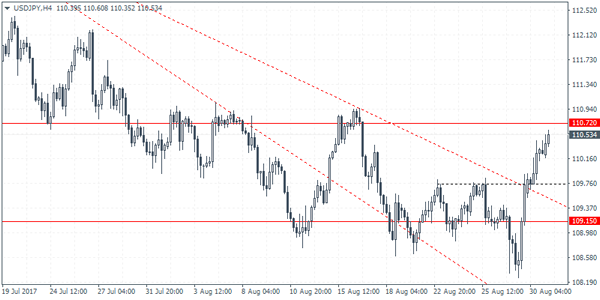
USDJPY Intraday Analysis
USDJPY (110.53): The USDJPY is seen making strong gains for what could be a third consecutive day. This comes after price retested the support level near 109.15 - 108.26. The resistance at 110.72 is now in focus, and we could expect theprice to struggle to breakout above this level. Therefore, a near-term decline could be expected. Support is seen coming in at 109.75 which previously served as minor resistance. A retest back to this level to establish support will validate the upside with USDJPY likely to break past 110.72 followed by a potential rally towards 113.00.
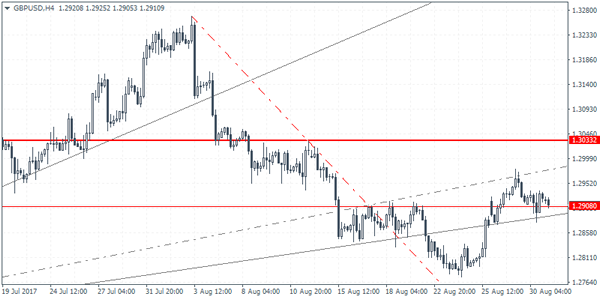
GBPUSD Intraday Analysis
GBPUSD (1.2910): The British pound managed to maintain some gains in yesterdays trading. Price action remains flat at the moment, but the medium-term bullish momentum could push GBPUSD further to the upside. The resistance level of 1.3033 could be the near-term test for the currency pair. For the moment, GBPUSD is seen retesting the support level at 1.2908. As long as this support holds, we can expect to see some near term gains. Thisis also validated by the fact that GBPUSD managed to break past the falling trend line and the previously held support level is now the prime target for resistance to be established.