Sample Category Title
Technical Outlook: EURUSD Stays Within Tight Range After Solid EU CPI Data Failed To Trigger Stronger Upside
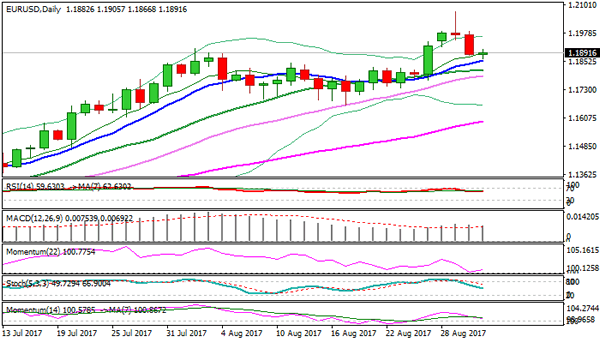
The Euro is trading within tight range on Thursday, holding so far above solid support at 1.1859, provided by rising 10SMA.
Strong fall on Wednesday completed reversal pattern on daily chart, but near-term bears are showing no signs of resuming lower after strong bearish signal.
The pair showed mild reaction on better than expected EU inflation data (Aug annualized CPI ticked to 1.5% vs 1.4% forecast and 1.3% in July).
The numbers are supportive, however, stronger acceleration higher and break above 1.1910/45 pivots is needed to generate firmer bullish signal.
Otherwise, the downside is expected to stay at risk and violation of 10SMA would trigger deeper pullback and expose next supports at 1.1812 (20SMA) and 1.1791 (30SMA).
Res: 1.1910, 1.1945, 1.1984, 1.2000
Sup: 1.1859, 1.1812, 1.1791, 1.1773
EUR/GBP Elliott Wave Analysis
EUR/GBP – 0.9217
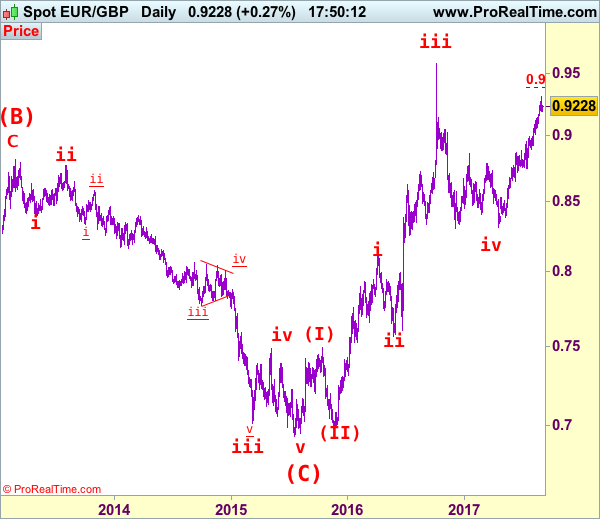
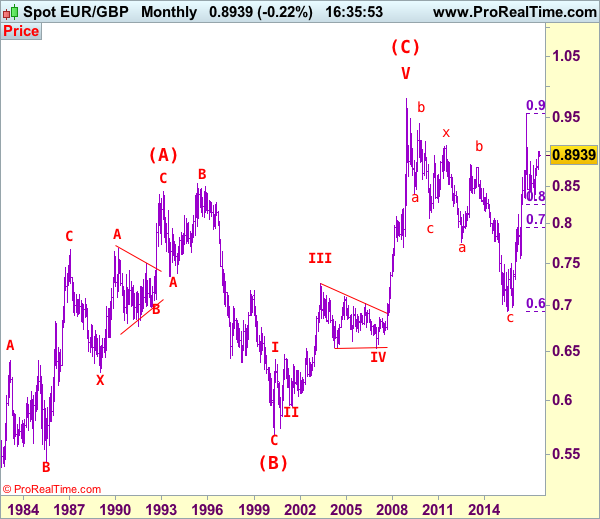
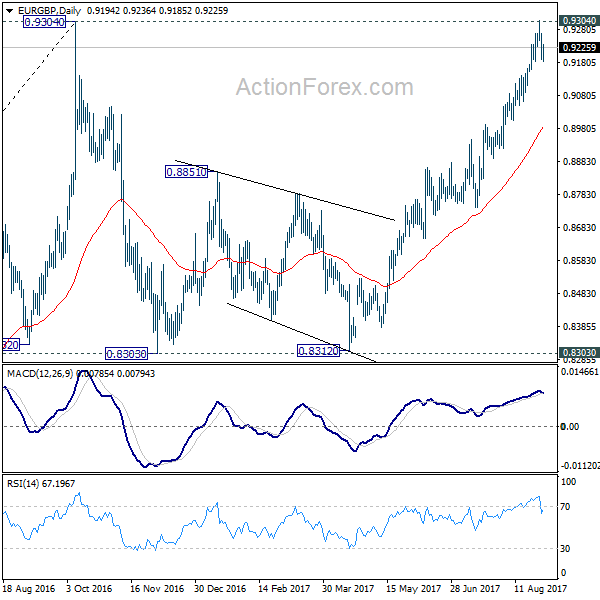
As the single currency has finally retreated after rising to 0.9307 earlier this week, suggesting 1-2 weeks of consolidation below this level would be seen and pullback to 0.9150-60 and possibly 0.9100-10 cannot be ruled out, however, reckon 0.9060-65 support would limit downside and bring another upmove later. We are keeping our view that early retreat from 0.9576 (wave iii top) has ended earlier at 0.8304 and bullishness remains for the rise from there to extend further gain to 0.9350, however, near term overbought condition should prevent sharp move beyond 0.9380-85 (100% projection of 0.8312-0.8950 measuring from 0.8743) and reckon 0.9400-10 would hold from here, risk from there is seen for a retreat.
Our latest preferred count is that the wave V of a 5-wave series from 0.5682 ended at 0.9805 earlier and major from there has possibly ended at 0.8067 as A-B-C-X-A-B-C. We are keeping our view that the entire correction from 0.9805 has possibly ended at 0.7756 and as labeled as the attached daily chart and impulsive move from 0.9084 has ended at 0.6938 as a 5-waver which marked as the (C) wave, recent impulsive rise is labeled as (I) (II), (i) (ii) series, indicated upside target at 0.9084 had been met, the retreat from 0.9576 suggest wave iii ended there and next upside target for wave v of (III) should head towards 0.9700 but price should falter well below parity .
On the downside, whilst initial pullback to 0.9150-60, then 0.9105-10 cannot be rule out, reckon downside would be limited to 0.9060-65 and bring another rise later. A daily close below support at 0.9008 would defer and suggest a temporary top is possibly formed, risk correction to 0.8945-50, then 0.8920-25 but reckon downside would be limited to 0.8890-95 and bring another upmove later.
Recommendation: Buy at 0.9065 for 0.9265 with stop below 0.8965
Euro's long term uptrend started in Feb 1981 at 0.5039 and is unfolding as a (A)-(B)-(C) move with (A): 0.8433 (Feb 1993), (B): 0.5682 (May 2000) and impulsive wave (C) should have ended at 0.9805 with wave III ended at 0.7254 (May 2003), triangle wave IV at 0.6536 (23 Jan 2007) and wave V as well as wave (C) has ended at 0.9805.
We are keeping an alternate count that only wave III ended at 0.9805 and the correction from there is the wave IV and has possibly ended at 0.6936, however, it is necessary to see a daily close above resistance at 0.9576 in order to change this to be the preferred count.
Forex Technical Analysis: EUR/USD, USD/JPY, GBP/USD
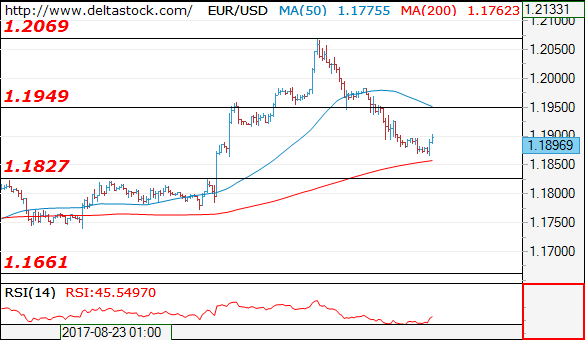
EUR/USD
Current level - 1.1896
The slide form 1.2070 is still intact and next major support lies at 1.1830. Key resistance on the upside is projected at 1.1950 and a violation of the latter will signal a reversal of the negative bias.
| Resistance | Support | ||
| intraday | intraweek | intraday | intraweek |
| 1.1950 | 1.2070 | 1.1830 | 1.1830 |
| 1.2070 | 1.2160 | 1.1750 | 1.1580 |
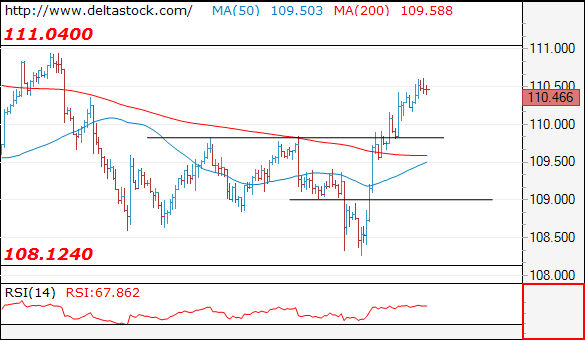
USD/JPY
Current level - 110.46
The uptrend is still intact and next major resistance lies at 111.00 area. Key support lies at 109.80 and a violation of the latter will challenge 109.00 and 108.10 lows again.
| Resistance | Support | ||
| intraday | intraweek | intraday | intraweek |
| 111.00 | 111.00 | 109.80 | 108.10 |
| 112.20 | 112.20 | 109.00 | 107.00 |
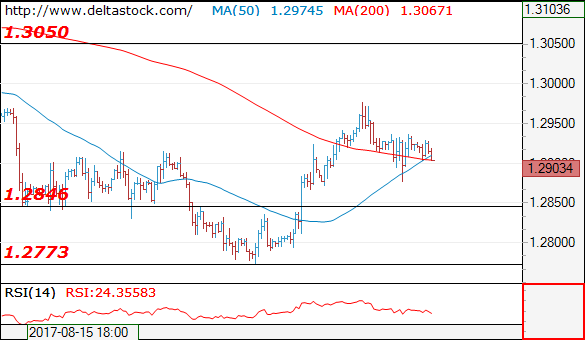
GBP/USD
Current level - 1.2903
Allow another intraday dip to 1.2850 area, before bouncing higher, towards 1.3050 zone.
| Resistance | Support | ||
| intraday | intraweek | intraday | intraweek |
| 1.2980 | 1.3157 | 1.2846 | 1.2773 |
| 1.3050 | 1.3260 | 1.2773 | 1.2606 |
USD/CAD Elliott Wave Analysis
USD/CAD – 1.2640
As the greenback has rebounded after holding above previous support at 1.2414, suggesting recent decline is not ready to resume yet and further consolidation is in store, however, still reckon upside would be limited to 1.2690-00 and bring another decline later, below 1.2500 would bring test of this week’s low 1.2441. Looking ahead, only break of 1.2414 support would confirm recent wave c decline is under way for weakness to 1.2350, then 1.2300 but loss of momentum should prevent sharp fall below 1.2200-10 and price should stay well above 1.2000 level, bring rebound later. We are keeping our bearish count that wave b ended at 1.3794 and wave c has commenced for further fall to aforesaid downside targets.
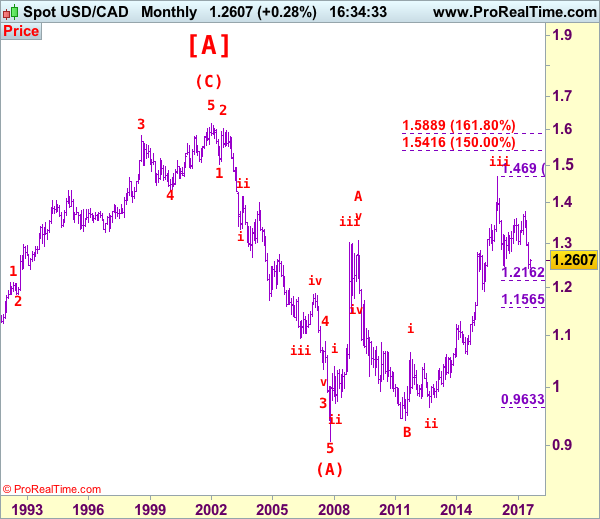
We are keeping our view that the wave b from 1.0657 (a leg top) has possibly ended at 0.9633 with (a): 0.9800, wave (b): 1.0447 and wave c at 0.9633, the subsequent rise from there is now treated as wave c exceeded indicated upside target at 1.3770-80 and 1.4000 and wave (3) has possibly ended at 1.4690 and wave (4) correction has commenced for retracement back to 1.2410-20, then towards 1.2200.
On the daily chart, our latest preferred count remains that the A of (B) rally from 0.9059 low (7 Nov 2007) unfolded into an impulsive wave with i: 0.9059-1.0380, ii ended at 0.9819, iii at 1.3019 followed by triangle wave iv at 1.2026 , then wave v formed a top at 1.3066 and also ended the wave A. The wave B is unfolding as an double three a-b-c-x-a-b-c and is sub-divided as a: 1.2192, b: 1.2716 and wave c at 1.0784, followed by wave x at 1.1725, another set of a-b-c unfolded with 2nd a at 0.9931, 2nd b at 1.0674. the 2nd c has possibly ended at 0.9407, therefore, consolidation with upside bias is seen for major correction, indicated target at 1.3900 had been met and gain to 1.4700 would follow.
On the upside, whilst initial marginal recovery cannot be ruled out, reckon upside would be limited to 1.2691 and bring another decline to aforesaid downside targets. Above resistance at 1.2691 would signal the retreat from 1.2778 has ended instead, bring another corrective bounce to this level and later towards previous support at 1.2859 but upside should be limited to resistance at 1.2944 and upside should falter well below psychological resistance at 1.3000, bring another decline later.
Recommendation: Hold short entered at 1.2650 for 1.2450 with stop above 1.2750.

Longer term - The selloff from 1.6194 (21 Jan 2002) to 0.9059 (07 Nov 2007) is viewed as (A) wave which is a 5-waver as labeled on the monthly chart as below, the subsequently rally is labeled as (B) with impulsive A leg of (B) ended at 1.3066, wave B of (B) is unfolding which has either ended at 0.9407 or would extend one more fall but downside should be limited to 0.9200 and 0.9000 should hold.
GBP/JPY Daily Outlook
Daily Pivots: (S1) 141.71; (P) 142.24; (R1) 142.97; More
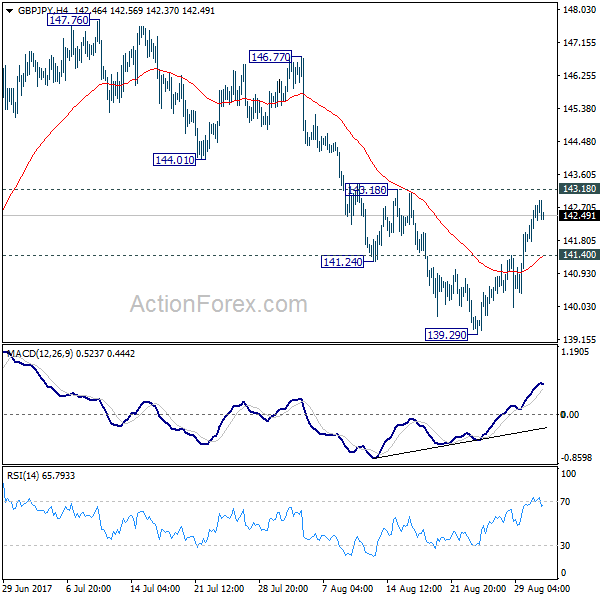
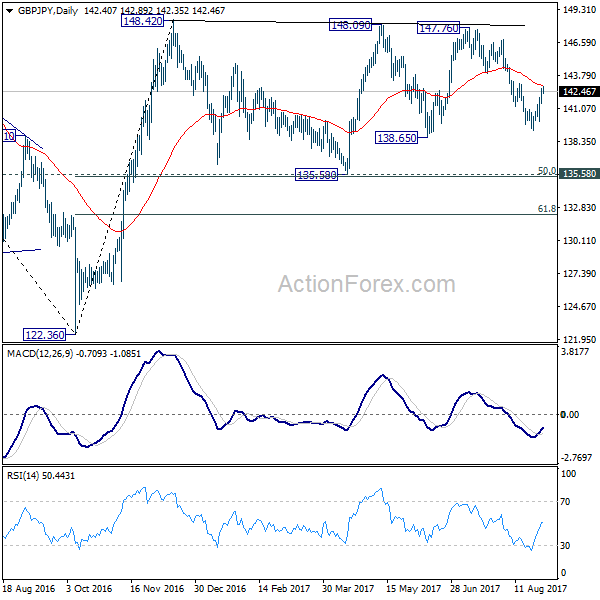
GBP/JPY rebounded further today but stays below 143.18 resistance. With 143.18 intact, near term outlook stays bearish and deeper decline is in favor. Below 141.40 minor support will turn bias back to the downside first. Break of 139.29 will target 135.58 key support level. At this point, price actions from 148.42 are seen as a sideway consolidation pattern. Hence, we'll expect strong support from 135.58 to contain downside and bring rebound. Meanwhile, break of 143.18 will indicate short term reversal and turn bias back to the upside.
In the bigger picture, the sideway pattern from 148.42 is extending with another leg. We'd expect strong support from 135.58 and 50% retracement of 122.36 to 148.42 at 135.39 to contain downside. Medium term rise from 122.36 is still expected to resume later. And break of 38.2% retracement of 196.85 to 122.36 at 150.43 will carry long term bullish implications. However, firm break of 135.58/39 will dampen the bullish view and turn focus back to 122.36 low.
EUR/JPY Daily Outlook
Daily Pivots: (S1) 130.73; (P) 131.22; (R1) 131.47; More...
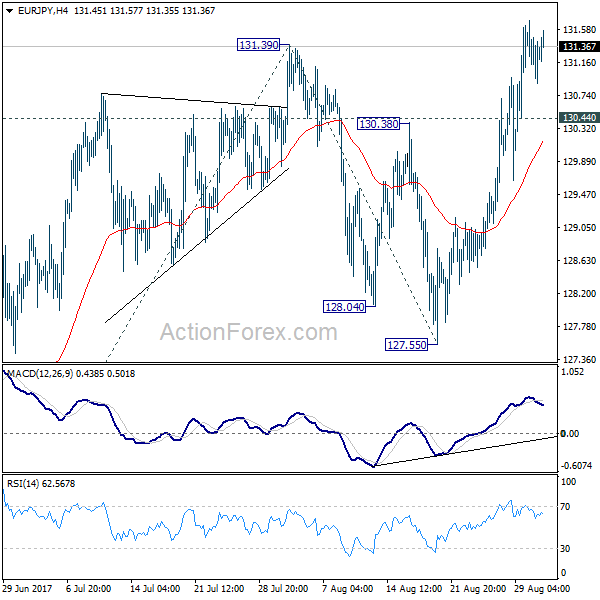
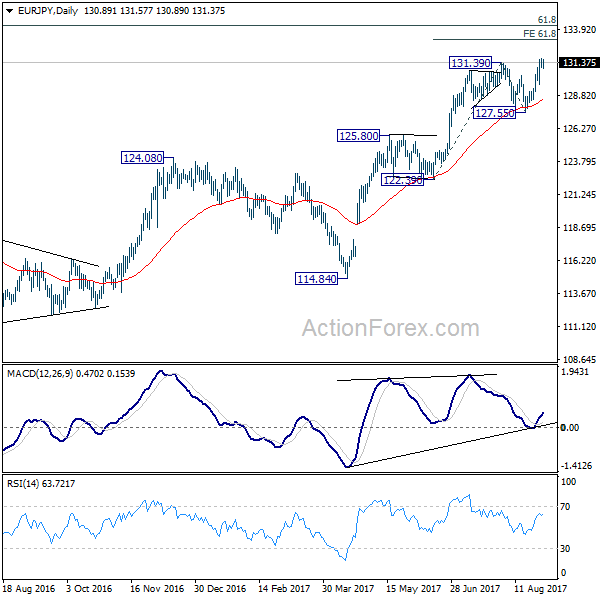
Intraday bias in EUR/JPY remains on the upside and current rally is targeting 61.8% projection of 122.39 to 131.39 from 127.55 at 133.11 next. On the downside, below 130.44 minor support will turn intraday bias neutral and bring consolidations, before staging another rally.
In the bigger picture, the down trend from 149.76 (2014 high) is completed at 109.03 (2016 low). Current rally from 109.03 should be at the same degree as the fall from 149.76 to 109.03. Further rise is expected to 61.8% retracement of 149.76 to 109.03 at 134.20. Sustained break there will pave the way to key long term resistance zone at 141.04/149.76. Medium term outlook will remain bullish as long as 124.08 resistance turned support holds. However, firm break of 124.08 will argue that rise from 109.03 is completed and turn outlook bearish.
EUR/GBP Daily Outlook
Daily Pivots: (S1) 0.9168; (P) 0.9218; (R1) 0.9245; More
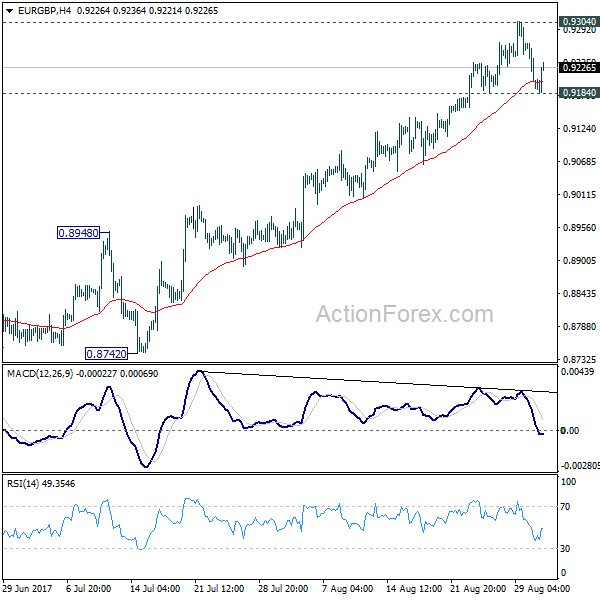
Intraday bias in EUR/GBP is neutral for the moment. We'd stay cautious on rejection from 0.9304 to extend the medium term consolidation pattern. Break of 0.9184 minor support will turn bias back to the downside for pull back to 55 day EMA (now at 0.8986). However, sustained break of 0.9304 will confirm up trend resumption and pave the way to 0.9799.
In the bigger picture, price actions from 0.9304 are viewed as a medium term corrective pattern. It's uncertain whether it is finished yet. But in case of another fall, we'd expect strong support from 0.8116 cluster support (50% retracement of 0.6935 to 0.9304 at 0.8120) to contain downside and bring rebound. Whole up trend from 0.6935 is expected to resume after consolidation from 0.9304 completes. Firm break of 0.9799 high will target 61.8% projection of 0.5680 to 0.9799 from 0.6935 at 1.1054.
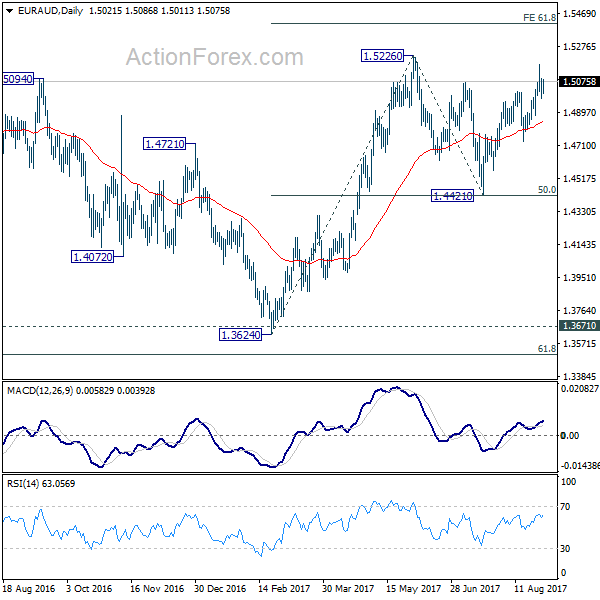
EUR/AUD Daily Outlook
Daily Pivots: (S1) 1.4981; (P) 1.5036; (R1) 1.5095; More....
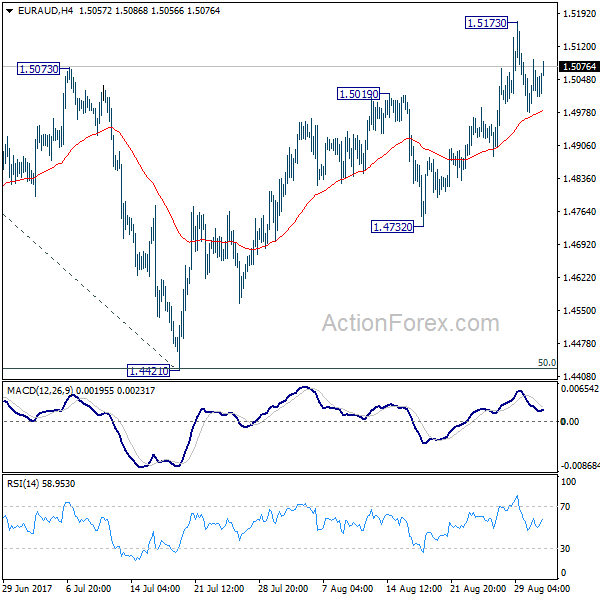
Intraday bias in EUR/AUD remains neutral for the moment. We're holding on to the bullish view that correction from 1.5226 has completed with three waves down to 1.4421. Further rise is expected and above 1.5173 will target retesting 1.5226 first. Break there will resume whole rebound from 1.3624 and target 61.8% projection of 1.3624 to 1.5226 from 1.4421 at 1.5411 next. Outlook will remain unchanged as long as 1.4732 support holds.
In the bigger picture, we're holding on to the view that corrective decline from 1.6587 medium term has completed at 1.3624. Rise from 1.3624 is expected to extend to retest 1.6587. The corrective structure of the fall from 1.5226 is affirming this view. Above 1.5226 will target a test on 1.6587 key resistance. However, break of 1.4421 will dampen our view and would drag EUR/AUD lower to retest key support zone around 1.3624.
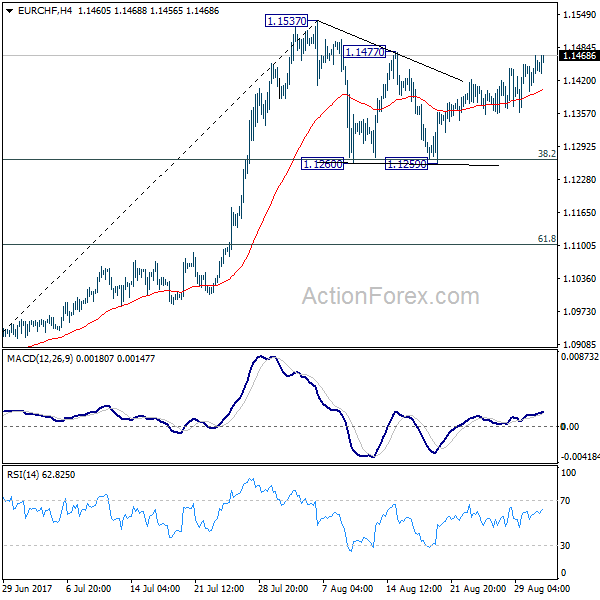
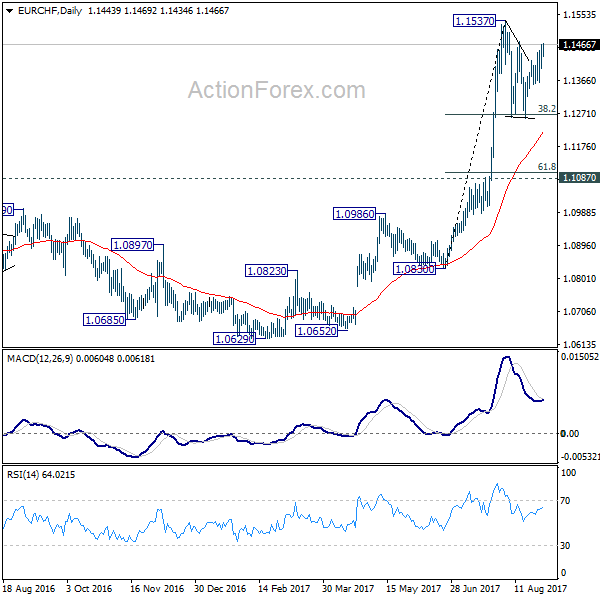
EUR/CHF Daily Outlook
Daily Pivots: (S1) 1.1411; (P) 1.1440; (R1) 1.1478; More...
EUR/CHF is still limited below 1.1477 minor resistance and intraday bias remains neutral first. Consolidation from 1.1537 could extend but downside should be contained by 38.2% retracement of 1.0830 to 1.1537 at 1.1267 to bring rebound. Break of 1.1477 resistance will argue that the consolidation from 1.1537 has completed and larger rise is resuming. Further break of 1.1537 will confirm and target 1.2 key resistance level next.
In the bigger picture, firm break of 1.1198 key resistance confirms resumption of the long term rise from SNB spike low back in 2015. In this case, EUR/CHF would eventually head back to prior SNB imposed floor at 1.2000. For now, this will be the favored case as long as 1.1087 resistance turned support holds.
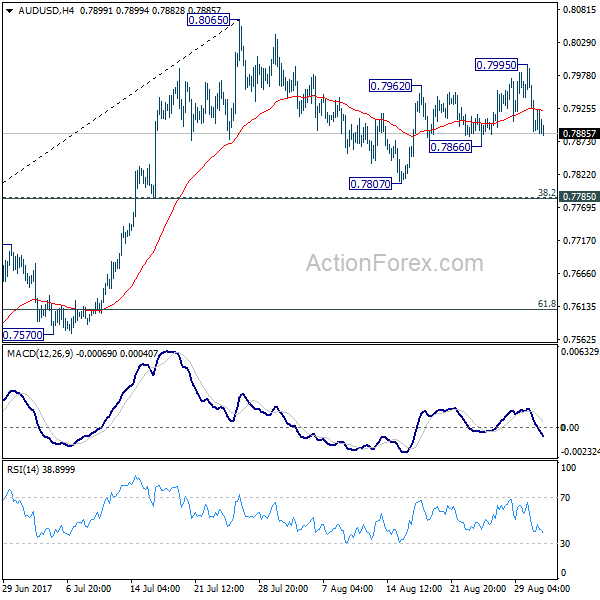
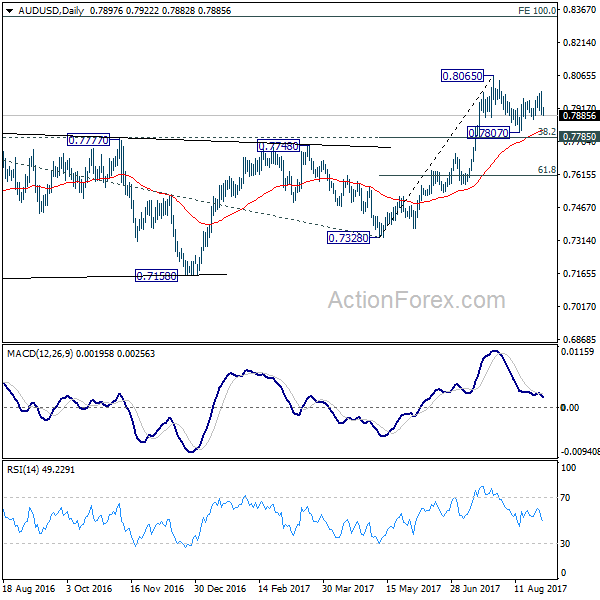
AUD/USD Daily Outlook
Daily Pivots: (S1) 0.7862; (P) 0.7928; (R1) 0.7967; More...
AUD/USD reversed again after hitting 0.7995 and intraday bias is turned neutral. Near term outlook is unchanged. Price actions from 0.8065 are developing into a consolidation pattern. In case of another fall, downside should be contained by 0.7785 cluster support (38.2% retracement of 0.7328 to 0.8065 at 0.7783) to bring rebound. Firm break of 0.8065 will confirm rally resumption for 100% projection of 0.6826 to 0.7833 from 0.7328 at 0.8335.
In the bigger picture, rise from 0.6826 medium term bottom is still in progress. At this point, there is no confirmation of trend reversal yet and we'll continue to treat such rebound as a corrective pattern. But in any case, break of 55 month EMA (now at 0.8097) will target 38.2% retracement of 1.1079 to 0.6826 at 0.8451. Break of 0.7328 support is needed to confirm completion of the rebound. Otherwise, further rise is now in favor.