Sample Category Title
NZD/USD More Drop To Come
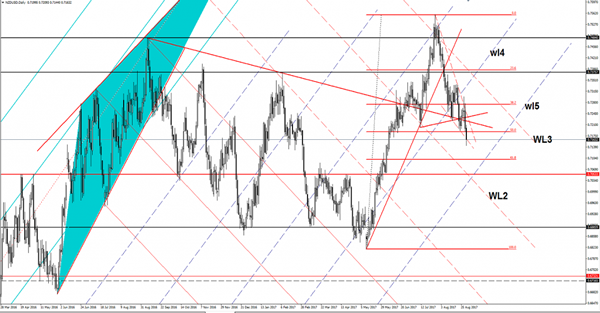
NZD/USD extends the sell-off confirming a further drop in the upcoming period. Is trading in the red and should hit fresh new lows in the upcoming days because is located deep in the seller’s territory. Has plunged much below the 50% retracement level, signaling that will drop towards the 61.8% retracement level. Could also be attracted by the fifth warning line (wl5) of the ascending pitchfork.
EUR/GBP Is This A False Breakout?
Price dropped sharply in the yesterday's trading session and now is located deep in the seller's territory. Has changed little in the morning, but the Euro-zone data should bring some volatility later. The bulls seem tired on the short term, but is premature to talk about another leg lower because is still located above an important dynamic support.
The Euro increased a little after the German Retail Sales were released, even if the report has come in much worse than expected, the indicator dropped by 1.2%, more versus the 0.5% estimate. The Euro-zone CPI Flash Estimate and the Core CPI Flash Estimate will be released later and could shake the price. Moreover, the Unemployment Rate is expected to remain steady at 9.1% for the second month in July.
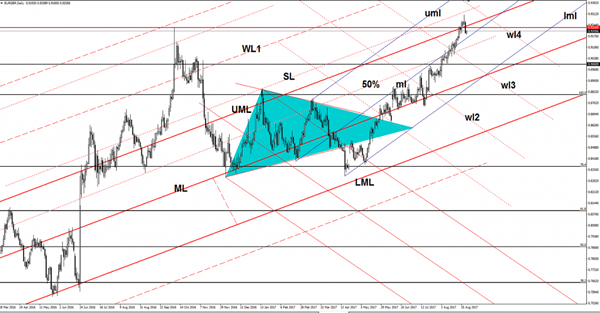
Price dropped much below the upper median line (UML) of the major ascending pitchfork, but failed to retest the median line (ml) of the minor ascending pitchfork. Now is fighting hard to increase and to retest the 0.9226 level and the UML. A retest followed by a minor decrease will confirm a broader drop in the upcoming period.
Looks like we had a false breakout above the UML, the failure to reach the outside sliding line (sl) has signaled an exhaustion.
Price could still increase after a median line (ml) retest, only a breakdown below it will signal a drop at least till the lower median line (lml).
EURO Moves Back To Weekly Pivot
The euro has slipped below the key 1.1900 level, as the U.S dollar index moves higher across the board. So far, the EURUSD has found support from 1.1870 level, just above the pairs weekly pivot point, at 1.1865.
During the European trading session, we see a number of high-impact economic data points, with the release of the German unemployment rate, and August inflation data for the eurozone.
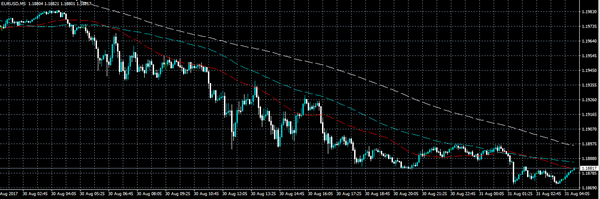
The EURUSD pair has pulled back sharply from the recent high, set at 1.2070, with the euro also failing to close above the psychological 1.2000 on a daily time-frame basis.
Key intraday technical support for is found at the weekly pivot point, at 1.1865, and the H4 time frame 100-period moving average, at 1.1811. The euro's 200-week moving average, adds critical support, at 1.1753.
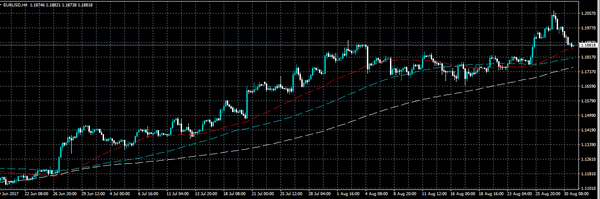
Key intraday technical resistance is found at the monthly time frame, 50-period moving average, at 1.1900. Above the 1.1900 level, the 1.1920 level represents the EURUSD pivot point, with further upside resistance at the 1.1942 level.
USDJPY Moves To 10 Day Trading High
The USDJPY pair has continued to advance higher during the Asian trading session, moving to 110.61, and finding intraday resistance from the 38.2 Fibonacci retracement of the recent 108.26 price low, to the 114.49 swing high.
At present, the USDJPY trades around the 110.50 level, with the pair receiving a major boost from U.S dollar index strength, after a better than expected U.S second quarter GDP report, and solid U.S private sector job increases, on Wednesday.
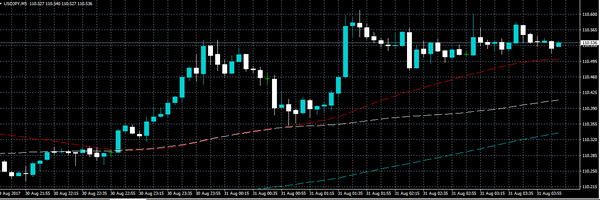
The USDJPY pair is currently bullish in the short and medium-term, with price-action now approaching major long-term technical resistance at the 110.80 level.
Multiple higher-time frame price closes above 110.80, should encourage further USDJPY buying towards the 111.40-50 region, where Fibonacci resistance, the 200-week moving average and the monthly pivot point are all located.
To the downside, key technical support is found at 110.40, and the daily pivot point, at 110.14. Below the 110.14 level, critical weekly USDJPY support is found at 109.80, and 109.42.
Data Deluge Continues Thursday With Eurozone CPI, US Personal Income
After an active Wednesday session, investors can expect another barrage of economic data on Thursday, with reports from the United States and Europe set to draw the most headlines.
The headlines begin at 06:00 GMT with a report on German retail sales. Retail receipts are forecast to decline 0.4% in July, but rise 3.5% annually.
Two hours later, the German government will report unemployment figures for the month of August. The jobless rate is expected to hold steady at 5.7%.
At 09:00 GMT, the European Commission’s statistical agency will release preliminary inflation data for the month of August. The consumer price index (CPI) strengthened to 1.4% in the 12 months through August, according to a median estimate. So-called core inflation is forecast to edge lower to 1.2% from 1.3%.
Eurozone unemployment data will be released at the same time as the CPI report. The region’s jobless rate likely held steady at 9.1% in July.
US data will take over from 12:30 GMT with a government report on personal income and outlays. The monthly report also features the core personal consumption expenditure (PCE) index, which is the Federal Reserve’s preferred measure of inflation. The July core PCE index is forecast to fall to 1.4% from 1.5% in June.
North of the border, Statistics Canada is expected to announce another quarter of robust economic growth. Second-quarter GDP is forecast at 3.7% annually, matching the previous quarter’s gain that made Canada the fastest-growing G7 nation.
Earlier in the day, the Chinese government reported a sharp slowdown in its services sector. The official non-manufacturing PMI slipped to 53.4 in August from 54.5 the previous month. That was the lowest since May 2016.
EUR/USD
The euro was one of the heaviest casualties on Wednesday, with the EUR/USD plunging nearly 200 pips. After hitting a new multiyear high of 1.2064, the pair crashed toward 1.1870. With recent data favouring the US dollar, the EUR/USD is vulnerable to sharper correction, perhaps toward the 21 August high of 1.1830.
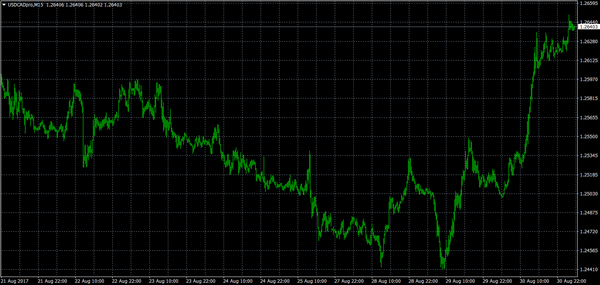
USD/CAD
Like the euro, the Canadian dollar suffered heavy losses in mid-week trade, as the USD/CAD spiked back toward the 1.26 region. That represents a gain of nearly 200 pips from the pair’s lowest point on Tuesday. A solid GDP report on Thursday could help the loonie reverse some of those losses.
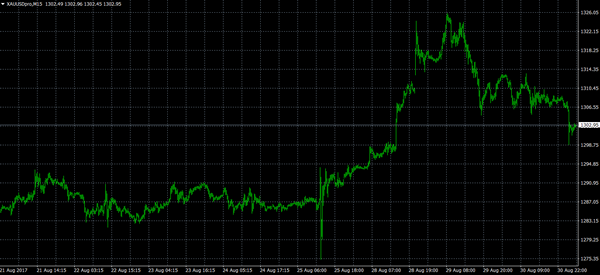
GOLD
Gold prices lost some of their shine on Wednesday after upbeat US data triggered a large rally for the dollar. Bullion continued lower on Thursday, with the spot price briefly crossing below $1,300.00. The outlook on gold largely depends on the interplay between the US economy and the dollar. That means economic data are of utmost importance.
Can New Zealand Dollar Hold 100-Day SMA Vs US Dollar?
Key Highlights
- The New Zealand Dollar started a downtrend from the 0.7550-0.7560 area against the US Dollar.
- There was a break below a crucial bullish trend line with support at 0.7380 on the 4-hours chart of NZD/USD.
- The Preliminary release of the US GDP for Q2 2017 points an annualized increase of 3%, more than the +2.7% forecast.
- ANZ Business Confidence in New Zealand for August 2017 declined from 19.4 to 18.3.
NZD/USD Technical Analysis
The New Zealand Dollar after trading as high as 0.7558 made a major top against the US Dollar. The NZD/USD pair is now in a downtrend and eyeing a close below 0.7150 and the 100-day SMA.
Looking at the daily chart, there is clear major top visible at 0.7558. During the downside move, the pair broke a crucial bullish trend line with support at 0.7380. It even cleared major support levels such as 0.7330 and 0.7240.
Sellers succeeded in breaking the 50% Fib retracement level of the last wave from the 0.6817 low to 0.7558 high. At the moment, the pair is attempting to break and settle below the 0.7150 support and the 100-day SMA.
If it succeeds, it would open the doors for more losses towards 0.7100 and 0.7050. The recent breaks and current sentiment point more losses as long as the pair is below 0.7240. Therefore, there are chances of a break below 100-day SMA for a test of 0.7100.
US GDP and New Zealand Business Confidence
Recently, the US saw the preliminary release of the Gross Domestic Product (Annualized) for Q2 2017 by the US Bureau of Economic Analysis. The forecast was slated for a rise of 2.7% in the GDP compared with the same quarter a year ago.
The actual result was much better, as the GDP increased 3% as per the second estimate, up from the last +2.6%.
The report added that:
Real gross domestic income (GDI) increased 2.9 percent in the second quarter, compared with an increase of 2.7 percent (revised) in the first. The price index for gross domestic purchases increased 0.8 percent in the second quarter, compared with an increase of 2.6 percent in the first quarter.
Overall, the result was positive, and helped the greenback in recovering versus the Euro, GBP, AUD and NZD. NZD/USD is likely to struggle in the near term and it could even test the 0.7100 level.
Economic Releases to Watch Today
US Personal Income for July 2017 (MoM) – Forecast +0.3%, versus 0.0% previous.
US Core Personal Consumption Expenditure for July 2017 (MoM) – Forecast +0.1%, versus +0.1% previous.
US Initial Jobless Claims – Forecast 237K, versus 234K previous.
US Pending Home Sales for July 2017 (MoM) – Forecast +0.5%, versus +1.5% previous.
Positive US Data Helps USD Reverse Recent Losses
Positive US data was released on Wednesday showing that the US economy grew faster than was initially expected in Q2. The US Bureau of Economic Analysis released GDP for Q2 showing a 3% annual rate. The release surpassed market expectations of 2.7% growth as GDP grew at its fastest pace in more than 2 years. Relatively robust consumer spending and improved business sentiment are the likely reasons for the improvement and now puts the US economy on a stronger footing as we enter Q3. In addition, the US ADP Employment Report surprised many with a strong release of 237K, beating the market consensus of 185K. This strong release further underscores a resilient US Labor market which can only help upcoming CPI expectations, as more Americans are working and, more importantly, spending money.
Friday’s NFP will hopefully show more positive news with the markets hoping to see an upward improvement in Average Earnings. Such positive economic data helped USD reverse recent losses, however, the response from President Trump that “all options” were on the table and the fact he dismissed any diplomatic negotiations with North Korea by stating “talking is not the answer” halted further USD advances, as the markets are concerned that tensions could rise further which may result in another round of risk-off sentiment.
EURUSD lost 0.5% on Wednesday to trade as low as 1.18942. EUR weakness continued overnight with EURUSD currently trading around 1.1875.
USDJPY gained over 0.6% on the day, trading as high as 110.435, before giving back some of its gains. In early trading, USDJPY has further strengthened to currently trade around 110.50.
GBPUSD improved slightly on Wednesday, although it remained in a relatively tight trading range. Currently, GBPUSD is trading around 1.2925.
Gold traded within an $8 range on Wednesday, as markets digested risk tolerance following improved US data and President Trump’s response to North Korea. A risk on sentiment overnight has seen Gold trade lower. Currently, Gold is trading around $1,303.
WTI pared back recent losses, gaining 0.7% on the day. Currently, WTI is trading around £46.25pb.
At 09:00 BST, German Unemployment Rate & Unemployment Change for August will be released. With an expected change of -6K which will further underscore an improving German economy.
At 10:00 BST, Eurozone Consumer Price Index & Core year on year for August will be released. Non-core is expected to come in at 1.4%, up from the previous release of 1.3%. Upward inflationary pressure will assist the easing of Eurozone economic policy and, potentially, see interest rates rise in the future.
At 13:30, US Personal Consumption Expenditure Price Index & Core (MoM) & (Y0Y) for July will be released. With no increases expected from both indicators, the lack of inflationary pressure will not help the Fed’s plans to increase interest rates later this year.
Currencies: USD Extends Rebound, But Confirmation Is Still Needed
Sunrise Market Commentary
- Rates: Jury still out on potential trend reversal
We expect EMU eco data to beat consensus (including HICP) while we hold a more neutral stance towards US eco readings. Such scenario should be sufficient to keep core bonds away from key resistance levels or even inflict some additional losses. Tuesday's potential technical trend reversal signal could also still be at play. - Currencies: USD extends rebound, but confirmation is still needed
Yesterday, the dollar extended its rebound against the euro and the yen even as rise in core yields remained modest. The EMU and US price data will take center stage today. Will the euro ignore higher EMU headline inflation? The dollar made a nice technical rebound, but conformation from strong US data is needed, starting with tomorrow's US payrolls.
The Sunrise Headlines
- US equities extended gains yesterday with Nasdaq outperforming (+1%) and Dow Jones underperforming (+0.1%). Overnight risk sentiment on Asian stock markets is more mixed with China notable underperformer.
- Trump has warned that talking to North Korea is “not the answer” as tensions mount. Defence secretary Mattis, a stabilising influence in the administration, softened that stance by saying that “we're never out of diplomatic solutions”.
- Official Chinese August PMI's printed mixed this morning. The manufacturing PMI increased to 51.7 from 51.4 in August (51.3 forecast), but the non-manufacturing PMI dropped from 54.5 to 53.4.
- South Korea's central bank kept its key interest rate unchanged at a record low 1.25%, as expected, as it assesses the effects of government measures to cool the housing market and recently introduced fiscal stimulus.
- British and EU negotiators exchanged recriminations over a lack of progress in the latest round of talks on Britain's withdrawal, with both sides demanding change to meet looming deadlines.
- Mr Trump said he wants to cut the corporate tax rate to 15%, simplify the tax code, reduce the burden on the middle class – including helping parents afford child care — and bring back to the US corporate profits parked offshore.
- Today's eco calendar contains German & EMU unemployment data, EMU inflation numbers, US personal income/spending data, weekly jobless claims, PCE inflation and Chicago PMI.
Currencies: USD Extends Rebound, But Confirmation Is Still Needed
Dollar extends rebounds. Confirmation still needed
Yesterday, dollar extended the rebound that started Tuesday. The move was primarily a technical correction on the recent USD decline, but good US eco data (strong ADP and upward revision of the US GDP) and positive risk sentiment reinforced the rebound. EMU inflation was also higher than expected, but couldn't inspire euro bulls. EUR/USD finished at 1.1884 (from 1.1974). USD/JPY closed at 110.24 from 109.71.
Overnight, Asian equities are trading mixed. Japan and Australia outperform. Japanese exporters profit from weaker yen even as July industrial production disappointed. USD/JPY trades in the mid 110 area. Official Chinese PMI's painted a mixed picture. The manufacturing PMI rebounded to 51.7 from 51.4, but the nonmanufacturing measure eased from 54.5 to 53.4. Chinese equities underperform as bank shares are under pressure. The dollar also extends its comeback against the euro and trades below 1.19.
Today, the EMU August HICP inflation and the July unemployment rate will be released. The risks for the euro area inflation are on the upside of the expected 1.4% Y/Y. The EMU unemployment rate is expected to have stabilized at 9.1% in July. In the US, the calendar is busy with personal income and spending (July) and the PCE deflators, the weekly jobless claims (stable?) and the Chicago PMI (August). We expect personal consumption to have picked up in July supporting the case for strong quarterly consumption growth. The PCE deflators most likely rose only slowly in July, keeping the Y/Y-rise at 1.4% Y/Y, well below Fed's target. The Chicago PMI is expected to have dipped, but risks are on the upside. Yesterday, European yields and the euro didn't rise after higher than expected inflation in EMU members states. The dollar rebound was the main feature. Interesting to see whether the euro also ignores a rise in overall EMU inflation. At the same time, the USD rebound continues this morning, especially EUR/USD declines further. For now, we consider the move as nothing more than a correction on the protracted USD decline of late. Markets will look forward to tomorrow's payrolls (including the wage development). Today, the dollar rebound might shift into a lower gear. Strong data and a higher US yields are needed to give the USD comeback a more solid base.
Broader context and technical picture. Late June, EUR/USD started a new up-leg as investors anticipated a reduction of ECB bond buying. The Fed was expected to normalize policy only in a very gradual way as US inflation remains soft.
Uncertainty on the policy of the Trump administration was a secondary negative for the dollar. EUR/USD set a correction top north of 1.19 before consolidating in a 1.1662/1.1910 range. EUR/USD jumped temporary above 1.20 after Jackson Hole. Sentiment on the dollar remains fragile, but there are signs of a EUR/USD topping out. Strong US data are needed for a further USD comeback. In MT perspective, the EUR/USD rally has gone far. A return of EUR/USD to the 1.15/16 area is possible. Pockets of US political risk are a (negative) wildcard for the dollar. We wait for a technical signal. A break below the 1.18/1.1775 area would be a sign of a loss off upside momentum.
A downward correction in core (US and European) yields supported the yen in August. USD/JPY declined from mid-114 mid-July and came within reach of the key 108.13 range bottom, but the support did its job. We maintain the working hypothesis that this level won't be broken as a lot USD bad news is discounted. A cautious buy-on-dips (with stop-loss protection below 108) may be considered.
EUR/USD extends correction after rejected test above 1.20
EUR/GBP
EUR/GBP extends correction below 0.92
Global positioning also dominated sterling trading yesterday. EUR/GBP declined even as UK specific news was sterling negative and the stalemate in the Brexit negotiations persisted. EUR/GBP joined the correction of EUR/USD. Cable held up relatively well despite the overall USD rebound. This suggests some underlying GBP strength. EUR/GBP closed the session at 0.9194 (from 0.9267). Cable finished the session at 1.2925 (from 1.2918)
Overnight, UK GFK consumer confidence improved from -12 to -10, a decline to - 13 was expected. Sterling remains well bid this morning, but we assume it is a simple continuation of yesterday's move rather than a reaction to the data. The UK calendar contains no other data, but BoE's Saunders speaks in Cardiff. The headlines from the Brexit negations remain negative, but for now there is no additional negative impact anymore. After the recent decline, sterling probably came closer to the point where the BoE might be 'forced' to give more weight to the inflation impact of the decline of sterling. This might have helped to put a floor.
From a technical point of view, EUR/GBP cleared the 0.8854/80 resistance (top end June), opening the way for further gains. The move was the result of euro strength. Simultaneously, UK price data were soft enough to keep the BoE sidelined. MT, we maintain a buy EUR/GBP on dips approach as we expect the combination of relative euro strength and sterling softness to persist. The 0.9415 'flash-crash spike' is the next target on the charts. However, we don't jump on the up-trend anymore after the recent rally and wait for a correction, e.g. to the technical support in the 0.88/89 area
EUR/GBP: correction time, at last
The Dollar Rebound – A Reversal, Or A Dead Cat Bounce?
Greenback weakness has been the primary focus of FX trading this year. On Tuesday, the Dollar Index fell to a 2.5-year low of 91.62, with losses exceeding 10% since the beggining of 2017. This underperformance was a result of many factors, including the collapse of Trump trade, convergence in monetary policies, a flattening U.S. yield curve and better economic prospects throughout the globe.
The dollar found some support on Wednesday, after revised U.S. GDP figures showed that the economy grew 3% in the second quarter, the strongest pace in more than two years. Additional support came after the release of the ADP report that showed the U.S. private sector added 237,000 jobs in August, a much better result than the expected 185,000.
Many traders are questioning whether the dollar has finally found a bottom, or will its weakness continue to persist. In the short term, the answer will be determined by Friday's Nonfarm payrolls report. After the ADP release, there's a high probability that the NFP will surprise to the upside. If we get a similar figure, it will be the third month in a row that the U.S. economy adds more than 200K jobs. However, wage growth has been the key missing ingredient in the employment figures, with very little growth shown over the past two years. Expectations are that we will see a 0.1% uptick for August, after being flat at 2.5% during the previous four months. A surprise in wage growth of 0.2% or above, will likely lead to the steepening of the yield curve and a further recovery in the U.S. currency.
In the longer run, the debt ceiling, tax reforms, and the trajectory of interest rates, will determine the direction of the U.S. dollar. S&P Global warned yesterday that a failure to raise the debt limit would be more catastrophic than the failure of Lehman Brothers, and would push the U.S. economy back into recession. Although this might be little exaggerated given the past experiences, failing to raise the debt ceiling will undoubtedly have a negative impact on the economy. The 2013 government shutdown resulted in an estimated $24 billion in lost economic output according to S&P, so the longer the shutdown, the more severe the impact on the economy. Thus, the dollar will remain under pressure if the Congress didn't come along within the next two weeks.
On Wednesday, President Trump made his much anticipated speech on tax reforms. However, no details were offered beyond his willingness to reduce corporate taxes by 20%. Many economists believe that slashing corporate tax rate from 35% to 15% is an unrealistic plan and won't get through Congress. If the President fails to deliver on tax cuts, his first year in Presidency ends without any significant legislative accomplishments, which is another reason why the dollar will remain under pressure.
Daily Technical Analysis: EUR/USD Drops 200 Pips And Challenges 4th Wave Pattern
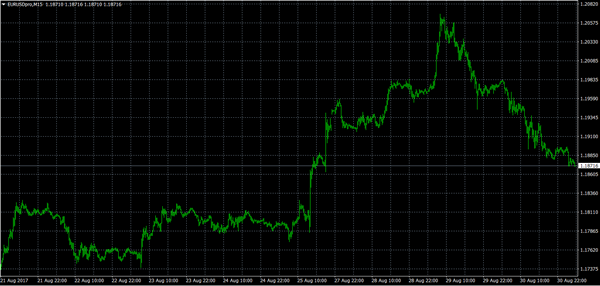
Currency pair EUR/USD
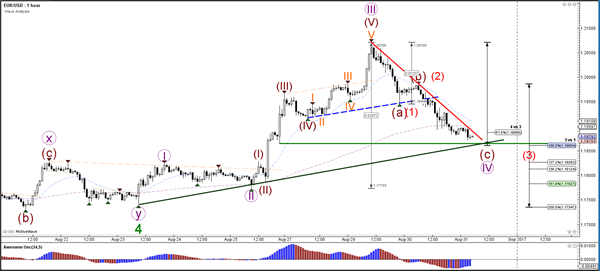
The EUR/USD has made a sharp bearish decline and is now testing the outer limits of a potential wave 4 (purple). A break below the 61.8% makes a wave 4 unlikely and the wave structure would change where wave 5 (purple) of wave 5 (green) of wave 3 (green) would be completed at the most recent high of 1.2070.
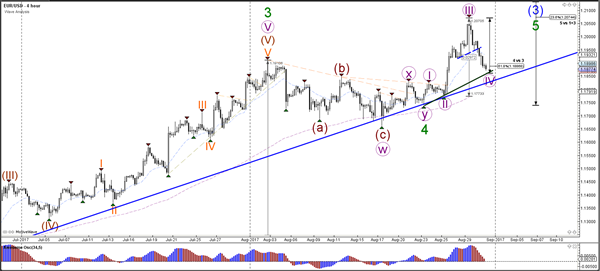
The EUR/USD is either building an unusually sharp ABC zigzag (brown) within wave 4 (purple) or price is building a bearish 123 wave pattern (red). The wave 3 (red) becomes likely if price manages to break below the support levels (green). A bullish break above resistance (red) could make a wave 4 pattern still possible. In that case, either a wave 5 has started or price could build a triangle for a larger wave 4.
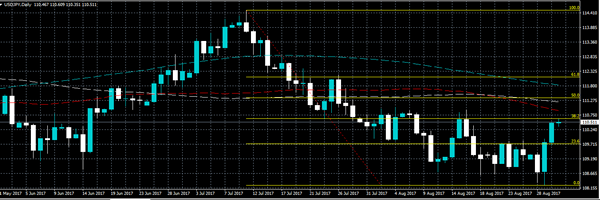
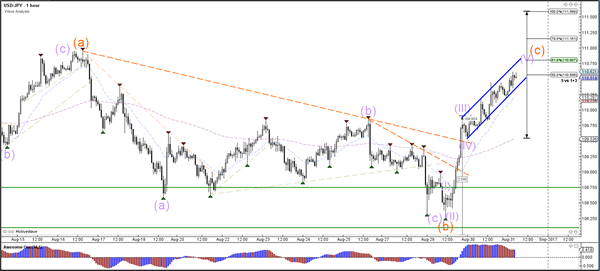
Currency pair USD/JPY
The USD/JPY is building a bullish channel (blue lines) on the lower times. The channel will reach a strong decision spot at 111 because of the strong resistance zone (red box) and 38.2% Fibonacci level.
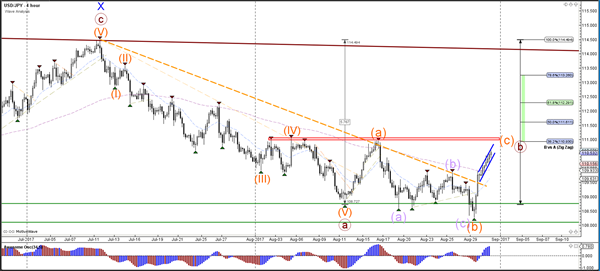
The USD/JPY could potentially extend the bullish momentum in wave 5 (purple) to the resistance at 111.
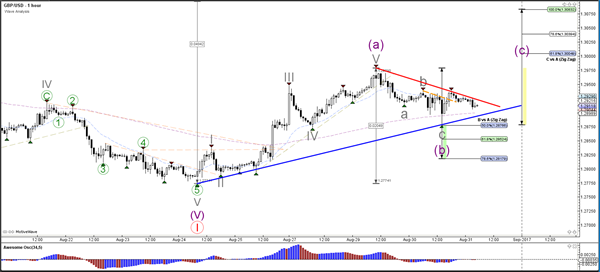
Currency pair GBP/USD
The GBP/USD bullish momentum has completed a wave A (purple) at the 38.2% Fibonacci resistance level and perhaps a wave B (purple) at the 50% Fib.
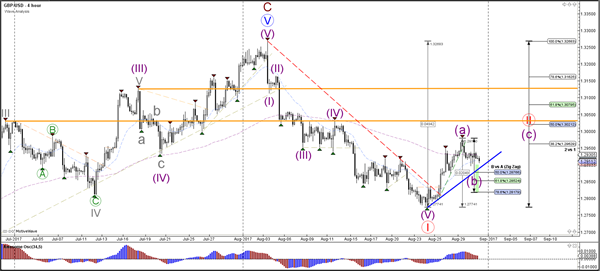
The GBP/USD tried to break above resistance (dotted orange) yesterday but did not manage to continue. This could be a pullback but price will need to break above resistance (red) again to confirm a potential bullish break for wave C (purple).