
Sample Category Title
Daily Technical Outlook And Review: EUR/USD, GBP/USD, AUD/USD, USD/JPY, USD/CAD, USD/CHF, DOW 30, GOLD
A note on lower timeframe confirming price action...
Waiting for lower timeframe confirmation is our main tool to confirm strength within higher timeframe zones, and has really been the key to our trading success. It takes a little time to understand the subtle nuances, however, as each trade is never the same, but once you master the rhythm so to speak, you will be saved from countless unnecessary losing trades. The following is a list of what we look for:
- A break/retest of supply or demand dependent on which way you're trading.
- A trendline break/retest.
- Buying/selling tails ... essentially we look for a cluster of very obvious spikes off of lower timeframe support and resistance levels within the higher timeframe zone.
- Candlestick patterns. We tend to only stick with pin bars and engulfing bars as these have proven to be the most effective.
We typically search for lower-timeframe confirmation between the M15 and H1 timeframes, since most of our higher-timeframe areas begin with the H4. Stops are usually placed 1-3 pips beyond confirming structures.
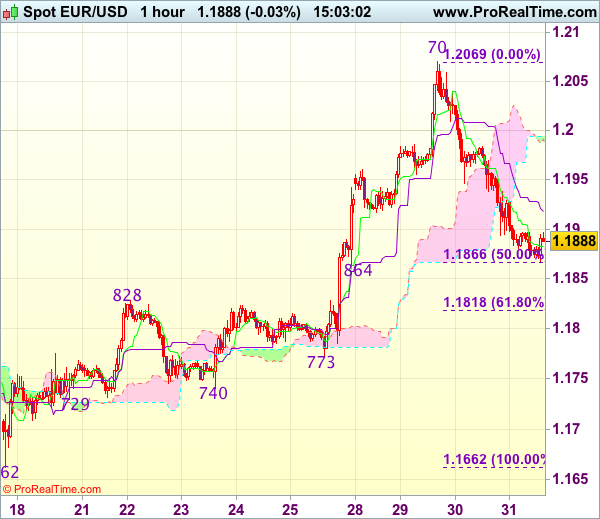
EUR/USD
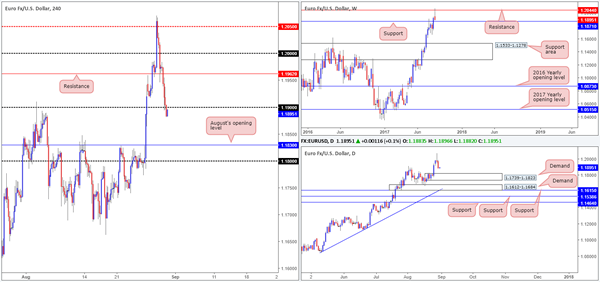
Having seen the USDX extend its bounce from weekly support at 11854 on Wednesday, it was of little surprise to see the single currency trade lower from weekly resistance pegged at 1.2044. As a result of this, price is now seen trading within touching distance of a weekly support at 1.1871.
Over on the H4 candles, price recently crossed below the 1.19 boundary. This, in our book, may have cleared the path south down to August’s opening level at 1.1830. Of concern though is the USDX H4 chart which shows price responding to a trendline resistance etched from the low 11853.
Also of particular interest is daily price. On the EUR chart we can see there’s room to trade as far down as demand marked at 1.1739-1.1823 (positioned a few pips below August’s opening level). Nevertheless, on the USDX price has already touched gloves with a daily supply zone coming in at 11969-11938.
Suggestions: Given the above notes our desk feels that neither a long nor short is viable at this present time.
Data points to consider: German Retail sales m/m at 7am, EUR inflation figures at 10am. US Unemployment claims and Core PCE index m/m at 1.30pm, US Pending home sales at 3pm GMT+1.
Levels to watch/live orders:
- Buys: Flat (stop loss: N/A).
- Sells: Flat (stop loss: N/A).
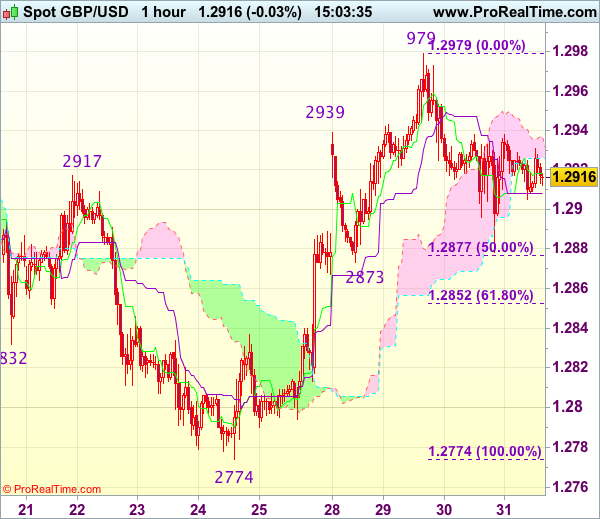
GBP/USD
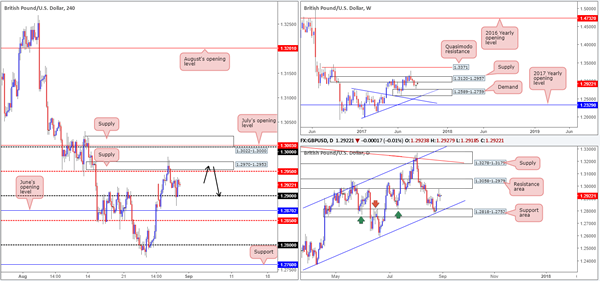
Despite the British pound aggressively puncturing the 1.29 handle during the early hours of US trading, the psychological number managed to remain intact and provide support. The next upside target from here can be seen at the H4 mid-level resistance drawn from 1.2950, followed closely by H4 supply at 1.2970-1.2953. Whether price will achieve this target is difficult to judge given the technical landscape on the bigger picture.
Weekly price is seen trading from supply pegged at 1.3120-1.2957, and daily action recently responded to a resistance area at 1.3058-1.2979. What’s also notable from a technical perspective is that daily price shows room to extend as far down as the support area seen at 1.2818-1.2752, which intersects with a channel support taken from the low 1.2365.
Suggestions: Should H4 price challenge the aforementioned H4 supply today and chalk up a bearish candle (preferably a full, or near-full-bodied candle) as per the black arrows, a sell from this area would be valid, in our opinion.
Data points to consider: MPC member Saunders speaks at 8.25am. US Unemployment claims and Core PCE index m/m at 1.30pm, US Pending home sales at 3pm GMT+1.
Levels to watch/live orders:
- Buys: Flat (stop loss: N/A).
- Sells: 1.2970-1.2953 ([waiting for a reasonably sized H4 bearish candle to form – preferably a full, or near-full-bodied candle – is advised] stop loss: ideally beyond the candle’s wick).
AUD/USD
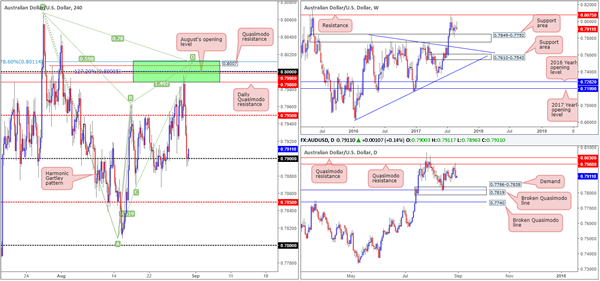
For those who have been following our recent analysis on the AUD/USD, you may recall that we highlighted the 0.8011/0.7988 area seen marked in green on the H4 timeframe as a potential sell zone. Our reasoning behind selecting this zone began with the large psychological number 0.80. Apart from this though, there were several nearby structures that complemented this level:
The daily Quasimodo resistance level at 0.7988.
A H4 Quasimodo resistance level at 0.8007.
A H4 127.2% Fib ext. point at 0.80 taken from the low 0.7807.
August’s opening level at 0.7998.
A H4 Harmonic Gartley reversal point at the 78.6% Fib resistance line drawn from 0.8011.
As can be seen from the H4 chart, price recently crossed swords with 0.8011/0.7988 and fell sharply. Unfortunately, we missed this entry, but well done to any of our readers who managed to jump aboard here!
The recent descent has brought price into contact with the 0.79 handle, which, for now, is seen holding ground. According to both the weekly and daily timeframes, there’s room for price to extend down to at least the H4 mid-level support at 0.7850 (denotes the top edge of the weekly support area at 0.7849-0.7752), thus suggesting 0.79 may not survive.
Suggestions: A H4 close below 0.79, followed up with a retest and a lower-timeframe confirming signal (see the top of this report) would, in our view, be enough to validate an intraday short, targeting the 0.7850 neighborhood.
Data points to consider: Australian Private capital expenditure q/q at 2.30am, Chinese manufacturing PMI at 2am. US Unemployment claims and Core PCE index m/m at 1.30pm, US Pending home sales at 3pm GMT+1.
Levels to watch/live orders:
- Buys: Flat (stop loss: N/A).
- Sells: Watch for H4 price to engulf 0.79 and then look to trade any retest seen thereafter ([waiting for a lower-timeframe confirming signal to form following the retest is advised] stop loss: dependent on where one confirms this level).
USD/JPY
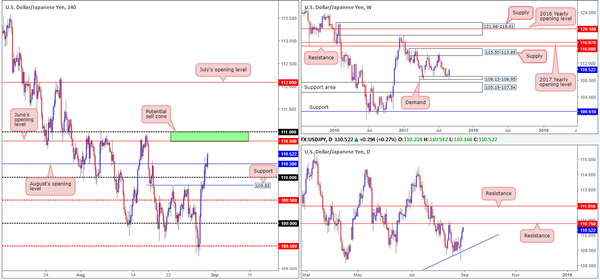
Another strong session for the USD/JPY yesterday lifted H4 price above multiple tech resistances. The latest move, however, has seen the unit cross above August’s opening level at 110.30, which has likely placed June’s opening level at 110.80 in the firing range (converges with a daily resistance level at 110.76). Having seen price connect with a weekly demand base at 108.13-108.95, and a daily trendline support extended from the low 100.08, the recent buying should not really come as much of a surprise.
Suggestions: The 111 handle and June’s opening level at 110.80, coupled with the aforesaid daily resistance line, could hold prices lower today. But is this area enough to convince traders to short, considering that weekly price is trading from demand? Personally, we would not want to be sellers when weekly buyers are showing strength, so we will humbly remain on the sidelines today and reassess structure going into Friday’s segment.
Data points to consider: US Unemployment claims and Core PCE index m/m at 1.30pm, US Pending home sales at 3pm GMT+1.
Levels to watch/live orders:
- Buys: Flat (stop loss: N/A).
- Sells: Flat (stop loss: N/A).
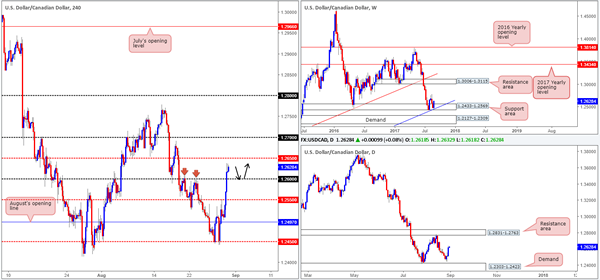
USD/CAD
Leaving August’s opening level at 1.2497 unchallenged the USD/CAD surged higher on Wednesday (helped by crude oil prices dropping sharply), ending the day closing beyond the 1.26 handle. Now, according to the higher timeframes, there is room for further buying in this market. Weekly price recently reconnected with a support area at 1.2433-1.2569, which fuses nicely with a trendline support etched from the low 0.9633. And daily price shows room to extend up as far as the resistance area seen at 1.2831-1.2763.
Suggestions: We believe the pair is likely to find some support around 1.26 should the unit pullback today, with it having been a reasonably strong barrier of resistance in the past (see red arrows). A retest at 1.26, coupled with a lower-timeframe buy signal (see the top of this report), would, in our technical view, be sufficient enough to warrant an intraday buy, targeting the 1.2650 region as an initial take-profit zone.
Data points to consider: US Unemployment claims and Core PCE index m/m at 1.30pm, US Pending home sales at 3pm. Canadian growth data at 1.30pm GMT+1.
Levels to watch/live orders:
- Buys: 1.26 region ([waiting for a lower-timeframe buy signal to form is advised] stop loss: dependent on where one confirms this number).
- Sells: Flat (stop loss: N/A).
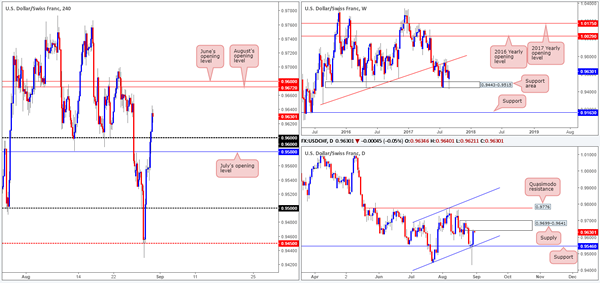
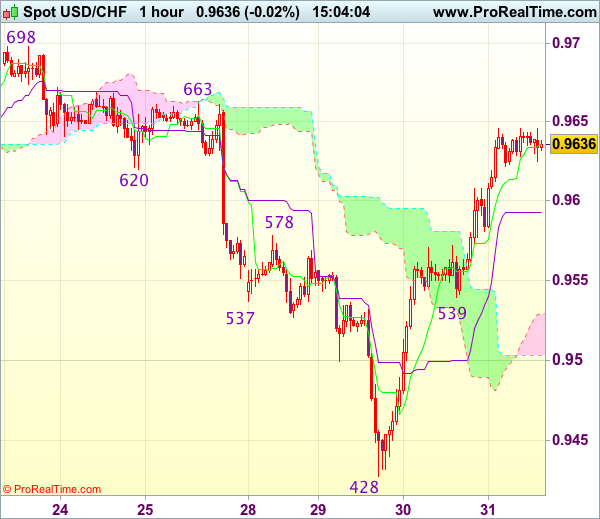
USD/CHF
During the course of yesterday’s sessions, the USD/CHF nudged above both July’s opening level at 0.9580 and the 0.96 handle. While the H4 candles show room to advance further today up to June/August’s opening levels at 0.9680/0.9672, it might be worth noting that daily price recently shook hands with a supply zone penciled in at 0.9699-0.9641 (an area we failed to recognize in Wednesday’s report). The flip side to this, of course, is weekly price shows space to move north until we reconnect with the trendline resistance etched from the low 0.9257.
Suggestions: Initially we were looking to buy on any retest seen at 0.96/0.9580. But this was before becoming aware of the aforementioned daily supply. Therefore, we’re in two minds as to whether this trade is still viable or not. With that being the case, we feel the best course of action may be to remain on the sidelines for now and reassess the market going into the tomorrow’s open.
Data points to consider: US Unemployment claims and Core PCE index m/m at 1.30pm, US Pending home sales at 3pm GMT+1.
Levels to watch/live orders:
- Buys: Flat (stop loss: N/A).
- Sells: Flat (stop loss: N/A).
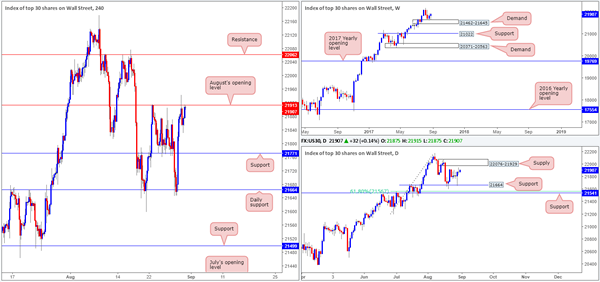
DOW 30:
Kicking this morning’s report off with a look at the weekly timeframe, it’s clear to see the bulls are making a stand from demand at 21462-21645. Providing that the unit remains bid from here, the next port of call will likely be fresh record highs. The story on the daily timeframe, however, shows that after price bounced from support at 21664 this brought the index up to within striking distance of supply coming in at 22076-21929.
Across on the H4 candles, we can see that August’s opening level at 21913 remains defensive, despite an earnest attempt to push higher during the early hours of yesterday’s London morning segment. Our initial thoughts, given the position of price on the weekly chart at the moment, were to look for longs above 21913 and target the H4 resistance at 22062 as an initial take-profit level. However, by doing this we’d effectively be entering long into a daily supply base!
Our suggestions: Considering the strength of the underlying trend in this market and the current weekly demand, the noted daily supply will, we believe, eventually be taken out. Despite this, the risk of buying into a daily supply zone is just too great, and quite simply not worth the risk, in our opinion.
Data points to consider: US Unemployment claims and Core PCE index m/m at 1.30pm, US Pending home sales at 3pm GMT+1.
Levels to watch/live orders:
- Buys: Flat (stop loss: N/A).
- Sells: Flat (stop loss: N/A).
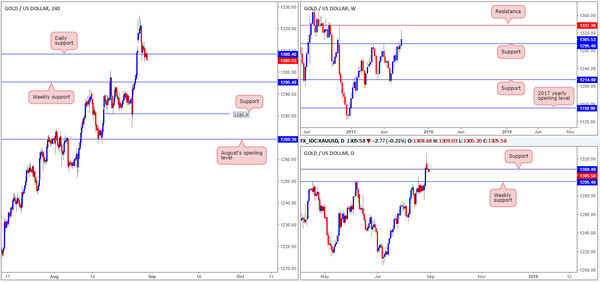
GOLD
Despite price trading around a daily support level at 1308.4, the recent dollar advance has made it difficult for the bulls to stamp in any type of authority here. A decisive H4 close below this daily support could lead to a move being seen down to the weekly support level coming in at 1295.4.
For those of you who read Wednesday’s report you may remember the team taking a long position from 1311.9, and placing a stop below at 1304.4. In light of recent movement, we’re likely going to take a hit on this one.
Our suggestions: Right now, we do not see a whole lot to hang our hat on at the time.
Levels to watch/live orders:
- Buys: Flat (stop loss: N/A).
- Sells: Flat (stop loss: N/A).
Trade Idea : USD/CHF – Buy at 0.9540
USD/CHF - 0.9639
Most recent candlesticks pattern : N/A
Trend : Down
Tenkan-Sen level : 0.9636
Kijun-Sen level : 0.9593
Ichimoku cloud top : 0.9529
Ichimoku cloud bottom : 0.9503
Original strategy :
Buy at 0.9540, Target: 0.9640, Stop: 0.9505
Position : -
Target : -
Stop : -
New strategy :
Buy at 0.9540, Target: 0.9640, Stop: 0.9505
Position : -
Target : -
Stop : -
As the greenback surged again after this week’s rally from 0.9428, adding credence to our view that recent decline has ended there and upside bias remains for the rise from 0.9428 low to extend further gain to previous resistance at 0.9663, however, near term overbought condition should limit upside and reckon another previous resistance at 0.9698-99 would hold from here, risk from there has increased for a retreat to take place later.
In view of this, we are looking to buy dollar on pullback as 0.9539 support should limit downside and bring another rebound later. Below 0.9500-10 would defer and suggest first leg of rise from 0.9428 has ended, risk weakness to 0.9470 but price should stay well above said support at 0.9428, bring another rebound.
Trade Idea : GBP/USD – Buy at 1.2855
GBP/USD - 1.2908
Most recent candlesticks pattern : N/A
Trend : Near term up
Tenkan-Sen level : 1.2918
Kijun-Sen level : 1.2908
Ichimoku cloud top : 1.2937
Ichimoku cloud bottom : 1.2926
Original strategy :
Buy at 1.2855, Target: 1.2955, Stop: 1.2820
Position : -
Target : -
Stop : -
New strategy :
Buy at 1.2855, Target: 1.2955, Stop: 1.2820
Position : -
Target : -
Stop : -
Although cable rebounded after finding support at 1.2878 yesterday, as the retreat from 1.2979 suggests a temporary top has been formed there, reckon upside would be limited to 1.2940 and downside risk remains for another fall to 1.2873 support, however, renewed buying interest should emerge around 1.2852-55 (61.8% Fibonacci retracement of 1.2774-1.2979) and bring rebound later, above 1.2955-60 would signal the retreat from 1.2979 has ended, bring retest of this level, break there would extend recent rise from 1.2774 (last week’s low) to 1.3000, then towards previous resistance at 1.3032 which is likely to hold from here.
In view of this, we are looking to buy sterling on further pullback as 1.2852-55 should limit downside. Below previous resistance at 1.2837 would defer and signal first leg of upmove from 1.2774 has ended, risk weakness to support at 1.2813 but price should stay well above support at 1.2774, bring another rebound later.
Trade Idea : EUR/USD – Sell at 1.1950
EUR/USD - 1.1900
Most recent candlesticks pattern : N/A
Trend : Up
Tenkan-Sen level : 1.1885
Kijun-Sen level : 1.1918
Ichimoku cloud top : 1.1994
Ichimoku cloud bottom : 1.1991
New strategy :
Sell at 1.1950, Target: 1.1850, Stop: 1.1985
Position : -
Target : -
Stop : -
As the single currency has recovered after holding above indicated support at 1.1864, suggesting consolidation above this level would be seen and above the Kijun-Sen (now at 1.1918) would bring recovery to 1.1950, however, as top has been formed at 1.2070 earlier this week, upside would be limited and bring another decline later, below 1.1864-66 (previous support and 50% Fibonacci retracement of 1.1662-1.2070) would extend the fall from 1.2070 to previous resistance at 1.1828 but reckon 1.1815-18 (61.8% Fibonacci retracement) would hold.
In view of this, we are looking to sell euro on recovery as 1.1950-55 should limit upside. Above 1.1980-85 would risk a stronger rebound to 1.2005-10 but still reckon upside would be limited to 1.2035-40 and price should falter below said this week’s high at 1.2070, bring another retreat later.
Trade Idea : USD/JPY – Buy at 109.95
USD/JPY - 110.49
Most recent candlesticks pattern : N/A
Trend : Near term up
Tenkan-Sen level : 110.46
Kijun-Sen level : 110.20
Ichimoku cloud top : 109.41
Ichimoku cloud bottom : 109.10
Original strategy :
Buy at 109.55, Target: 110.55, Stop: 109.20
Position : -
Target : -
Stop : -
New strategy :
Buy at 109.95, Target: 110.95, Stop: 109.60
Position : -
Target : -
Stop : -
As the greenback has continued moving higher after rallying from 108.27 low, suggesting recent decline from 114.50 has ended there and consolidation with upside bias is seen for this move to bring retracement of said entire fall to 110.65 (38.2% Fibonacci retracement of 114.50-108.27), then towards 111.00, however, reckon upside would be limited to 111.15-20 and price should falter below 111.40 (approx. 50% Fibonacci retracement), bring retreat later due to near term overbought condition.
In view of this, would not chase this rise here and we are looking to buy dollar on pullback as previous resistance at 109.85-90 should turn into support and contain dollar’s downside. Only below support at 109.54 would abort and signal top is formed instead, bring weakness to 109.15-20.

European Open Briefing: Asian Equity Markets Opened On A Mixed Note Early On Thursday
Global Markets:
- Asian stock markets: Nikkei up 0.77 %, Shanghai Composite fell 0.43 %, Hang Seng lost 0.60 %, ASX 200 rose 0.71 %
- Commodities: Gold at $1308.52 (-0.41 %), Silver at $17.33 (-0.34 %), WTI Oil at $45.92 (-0.09 %), Brent Oil at $50.72 (-0.02%)
- Rates: US 10-year yield at 2.15, UK 10-year yield at 1.03, German 10-year yield at 0.35
News & Data:
- CNY Manufacturing PMI 51.7 vs 51.3 expected
- CNY Non-Manufacturing PMI 53.4 vs 54.5 previous
- NZD ANZ Business Confidence 18.3 vs 19.4 previous
- AUD Private Capital Expenditure q/q 0.8 % vs 0.2 % expected
- EUR German Prelim CPI m/m 0.1 % vs 0.1 % expected
- CHF KOF Economic Barometer 104.1 vs 107.0 expected
- EUR Spanish Flash CPI y/y 1.6 % vs 1.7 % expected
- GBP Net Lending to Individuals m/m 4.8 B vs 5.3 B previous
- USD ADP Non-Farm Employment Change 237 K vs 185 K previous
- CAD Current Account -16.3 B vs -17.3 B previous
- USD Prelim GDP q/q 3.0 % vs 2.7 % previous
- USD Crude Oil Inventories -5.4 M vs -1.8 M previous
- Gasoline hits $2/gallon as Harvey wreaks havoc on refiners, crude stable- RTRS
- Trump touts tax reform, overlooks White House aide Cohn- RTRS
Markets Update:
Asian Equity markets opened on a mixed note early on Thursday. Global Investors rediscovered a taste for the dollar and Asian shares as robust Chinese and U.S. economic data overnight increased appetite for riskier assets globally, even as tensions over North Korea simmered in the background.
USDJPY is currently seen trading around 110.50 as the yen continued to fall for a third straight day losing 0.2 percent against the USD in the session. The data from Japan today was on the disappointing side too as Factory output for July missing estimates ( -0.8 % vs -0.4 % expected)
AUDUSD was pretty much unchanged on the session, the Australian dollar was down less than 0.1 percent to 79.01 against the US Dollar after declining for two days. In comparison, NZDUSD is seen trading below 0.7170 as the kiwi dropped 40 points or so against the US Dollar, mainly due to getting a kick down from the AUD/NZD buyers.
EURUSD is currently seen trading at around 1.1875 as the Euro lost around 0.7 percent against the US Dollar dropping from its top of 1.2069, weighed in part by speculation the European Central Bank might start to protest at the currency's strength. The dollar index. DXY, which tracks the greenback against a basket of six major peers, edged up 0.1 percent to 93.02
Upcoming Events:
- 06:00 GMT – (EUR) German Retail Sales m/m
- 07:25 GMT – (GBP) MPC Member Saunders Speaks
- 09:00 GMT – (EUR)) CPI Flash Estimate y/y
- 09:00 GMT – (EUR) Core CPI Flash Estimate y/y
- 12:30 GMT – (CAD) GDP m/m
- 12:30 GMT – (USD) Unemployment Claims
- 12:30 GMT – (USD) Personal Spending m/m
- 13:45 GMT – (USD) Chicago PMI
- 14:00 GMT – (USD) Pending Home Sales m/m
Market Update – Asian Session: USD Strength Takes Pressure Of The Yen Sending Japan Equities Higher
Asia Summary
Asian equity markets opened mixed before trading mostly higher on stronger China PMI manufacturing, indicating that the Govt may have more room to continue tightening regulations to curb financial risks. However the services PMI fell putting downward pressure local markets. USD saw moderate strength on positive overnight US data and the resulting weaker yen sent Japan automakers and tech names into the green. ASX was higher with the last of earnings season coming in strong; standouts include Ashley Services and OM Holdings. Australia Q2 CAPEX was also higher, helped by strong commodity prices and upbeat business confidence.
As expected BOK left its rate unchanged at record low, saying it is assessing effects of government measures to cool the housing market and a recently introduced fiscal stimulus. Also said they needed more time and data before adjusting GDP forecast. PBOC skips OMO operations with a net drain of CNY100B v yesterday’s CNY10B. The PBOC set the yuan mid-point rate at the strongest setting since June 2016.
Key economic data
(CN) CHINA AUG OFFICIAL GOVT MANUFACTURING PMI: 51.7 V 51.3E; Non-Manufacturing PMI: 53.4 v 54.5 prior
(KR) BANK OF KOREA (BOK) LEAVES REPO RATE UNCHANGED AT 1.25%; AS EXPECTED
(CN) CHINA JUL SWIFT GLOBAL PAYMENTS (CNY): 2.0% V 1.98% PRIOR
(KR) SOUTH KOREA JUL INDUSTRIAL PRODUCTION M/M: 1.9% V 0.5%E; Y/Y: 0.1% V -0.2%E
(KR) SOUTH KOREA JUL CYCLICAL LEADING INDEX CHANGE: 0.2 V 0.3 PRIOR
(UK) AUG GFK CONSUMER CONFIDENCE: -10 V -13E
(UK) AUG LLOYDS BUSINESS BAROMETER: 17 V 30 PRIOR (1-yr low)
(JP) JAPAN JUL PRELIM INDUSTRIAL PRODUCTION M/M: -0.8% V -0.3%E; Y/Y: 4.7% V 5.2%E
(AU) AUSTRALIA Q2 PRIVATE CAPITAL EXPENDITURE (CAPEX) Q/Q: 0.8% V 0.2%E
Speakers and Press
(CN) China to continue the restructuring of state owned enterprises (SOEs) in the steel sector - Chinese Press
(CN) China MOFCOM Spokesperson Feng: To start campaign to protect foreign companies' intellectual properties
(KR) South Korea Vice Defense Min in Parliament: Confirms in talks with US on remaining THAAD launcher deployment; to seek deployment of US strategic military assets
(JP) BoJ Masai: Reiterates still some distance to achieving 2% inflation target
(US) US Coast Guard said to partially re-open Houston Ship Channel to vessels – US financial press
Asian Equity Indices/Futures (00:00ET)
Nikkei +0.9%, Hang Seng -0.6%; Shanghai Composite -0.7%, ASX200 +0.7%, Kospi -0.4%
Equity Futures: S&P500 +0.1%; Nasdaq100 +0.2%, Dax +0.2%, FTSE100 +0.1%
FX ranges/Commodities/Fixed Income (00:00ET)
EUR 1.1897-1.1872; JPY 110.61-110.23; AUD 0.7923-0.7887; NZD 0.7210-0.7164
Dec Gold -0.4% at $1,308/oz; Oct Crude Oil -0.0% at $45.95/brl; Sept Copper +0.7% at $3.11/lb
(CN) China PBOC skips OMO v injects CNY130B in 7-day and 14-day prior; Drains net CNY40B v drains CNY100B prior
USD/CNY *(CN) PBOC SETS YUAN REFERENCE RATE AT 6.6010 V 6.6102 PRIOR (strongest setting since June 2016)
(CN) China PBOC skips OMO v injects CNY130B in 7-day and 14-day prior; Drains net CNY40B v drains CNY100B prior
(JP) Japan MoF sells ¥1.78T in 2-yr 0.1% bonds; avg yield -0.1490%; bid-to-cover 4.97x
Equities notable movers
Australia/New Zealand
ASH.AU Reports FY17 (A$) Net loss 5.9M v loss 69.6M y/y; underlying EBITDA 5.7M v loss 7.7M y/y; Rev 314.7M v 276.9M y/y; +27.8%
PRO.AU Reports FY17 (A$) Net profit 2.0M v 2.4M y/y; Rev 9.2M v 12.3M y/y; -15%
OMH.AU Reports H1 (A$) Net loss 21.3M v loss 82.2M y/y, Rev 263M v 183M y/y (reported yesterday); +15.5%\
Hong Kong/China
390.HK Reports H1 (CNH) Net 7.71B v 5.1B y/y, Rev 300.0B v 268B y/y; +7.3%
656.HK Reports H1 Net CNY5.86B v CNY4.39B y/y; Rev CNY36.3B v CNY32.5B y/y; Existing shareholder, Sisram Medical, offer 110M shares at HK$8.88-12.35/shr in Hong Kong IPO; +9.2%
Other
COST Reports Aug Total SSS (ex gas) 5.9%; US SSS (ex gas) +6.1% v +3.9%e
Focus Remains On Euro Area Inflation In August
Market movers today
Focus remains on euro area inflation in August . Yesterday's German and Spanish figures were both higher than expected but the upside surprise was driven mainly by energy price inflation and the higher inflation should not alter the ECB's current view on its monetary policy strategy. We have revised our euro area headline inflation forecast slightly higher to 1.5% y/y in August but still believe core inflation will move in the opposite direct ion and decline to 1.1% y/y in August . As we have argued previously, the stronger euro will become a headwind to inflation in 2018 and 2019,
Euro area and German unemployment rate figures are also due for release today. Both figures have declined over the past years and the German unemployment rate is very low in a historical perspective. This has been one factor supporting consumer sentiment , which is at the highest level in more than 15 years. The ongoing strong economic situation in Germany bodes well for Angela Merkel in the upcoming election. See more about the possible outcome at the election in German Election Monitor No. 1: Next euro area election unlikely to rock the boat, 29 August 2017.
US inflation figures will at tract attention in the afternoon with the release of the PCE figure. The decline in PCE core inflation in the first half of this year has sparked some concern about lack of inflation pressure within the Fed. Nevertheless, the Fed has said quantitative tightening will begin ‘relatively soon' and we expect it to be announced in September. The Fed getting ready to pull the trigger on quantitative tightening means USD liquidity could start to become scarce from Q4.
Selected market news
Overnight , Chinese PMI manufacturing rose to 51.7 in August from 51.4 in July against the expectations of a drop. This adds to the perception that the world economy is in good shape, as euro area growth is strong at the moment and US Q2 GDP growth was revised up to 3.0% from 2.6% yesterday.
The Trump administration seems divided on the North Korea situation. While President Trump tweeted yesterday that ‘talking is not the answer', Defense Secretary James Matt is said that the US is still trying to find a diplomatic solution. The administration is expected to brief the Senate on the situation next week. For more on the North Korea crisis see Flash Comment: Another wave of escalation in North Korean crisis, 29 August 2017.
Bloomberg has an excellent overview of why the Brexit negotiations are progressing slowly (the third round is taking place this week). While the EU says the UK needs to clarify its positions, the UK accuses the EU for not being flexible enough. While it seems unlikely that the first phase of the negotiations can be concluded before the EU summit in October, one has to take into account that it is normal for political negotiations to progress slowly until close to midnight
Australia’s HIA New Home Sales Dropped In July
For the 24 hours to 23:00 GMT, the AUD declined 0.63% against the USD and closed at 0.7905.
LME Copper prices declined 0.6% or $42.0/MT to $6755.0/MT. Aluminium prices declined 1.2% or $25.5/MT to $2066.5/MT.
In the Asian session, at GMT0300, the pair is trading at 0.7907, with the AUD trading a tad higher against the USD from yesterday's close.
Earlier today, data indicated that Australia's HIA new home sales eased 3.7% on a monthly basis in July. New home sales had registered a drop of 6.9% in the previous month. On the contrary, the nation's private sector credit registered a rise of 0.5% on a monthly basis in July, meeting market expectations. The private sector credit had climbed 0.6% in the prior month.
Elsewhere in China, Australia's largest trading partner, the NBS manufacturing PMI unexpectedly advanced to a level of 51.7 in August, defying market consensus for a fall to a level of 51.3. The PMI had registered a reading of 51.4 in the prior month. On the other hand, the nation's non-manufacturing PMI recorded a drop to a level of 53.4 in August, following a reading of 54.5 in the previous month.
The pair is expected to find support at 0.7864, and a fall through could take it to the next support level of 0.7821. The pair is expected to find its first resistance at 0.7973, and a rise through could take it to the next resistance level of 0.8039.
Going ahead, traders will focus on Australia's AiG performance of manufacturing index for August, slated to release overnight.
The currency pair is trading below its 20 Hr and 50 Hr moving averages.

German Inflation Advanced As Expected In August
For the 24 hours to 23:00 GMT, the EUR declined 0.66% against the USD and closed at 1.1896.
Macroeconomic data indicated that the Euro-zone's economic confidence index unexpectedly advanced to a level of 111.9 in August, hitting its highest level since July 2007, propelled by higher optimism among industrial and the services sector. Market participants had expected the index to remain unchanged at a revised level of 111.3. Further, the region's final consumer confidence index improved to a level of -1.5 in August, in line with the flash estimate. The index had recorded a level of -1.7 in the prior month.
Separately, Germany's flash consumer price index (CPI) climbed 1.8% on an annual basis in August, meeting market expectations and compared to a rise of 1.7% in the prior month.
Meanwhile, rating agency, Moody's upgraded Euro-zone's growth forecast for 2017, citing robust momentum across the Euro-bloc. The agency now expects economic growth across the common currency region to hit 2.1% this year, revised up from its earlier forecast of 1.7%.
The greenback gained ground against its key counterparts, following the release of a pair of upbeat economic data.
The second estimate of annualised gross domestic product (GDP) in the US was revised sharply higher to 3.0% in the second quarter of 2017, expanding at its fastest pace in more than two years. The preliminary figures had indicated an advance of 2.6%, while market participants had envisaged for an expansion of 2.7%. In the previous quarter, GDP had posted a revised rise of 1.2%.
Other data showed that ADP's private sector employment in the US increased more-than-expected by 237.0K in August, rising at its fastest pace in five months and boosting optimism over the state of the nation's labour market. ADP's private sector employment rose by a revised 201.0K in the prior month, while markets had anticipated for a rise of 185.0K. On the contrary, the nation's MBA mortgage applications fell 2.3% in the week ended 25 August 2017, after recording a drop of 0.5% in the prior week.
Meanwhile, Moody's slashed US growth forecasts for this year and next, stating that the economy disappointed with a weaker performance in the first half of this year. The agency trimmed 2017 growth forecast from 2.4% to 2.2% and cut forecast for 2018 to 2.3% from 2.5% predicted earlier.
In the Asian session, at GMT0300, the pair is trading at 1.1878, with the EUR trading 0.15% lower against the USD from yesterday's close.
The pair is expected to find support at 1.1839, and a fall through could take it to the next support level of 1.1799. The pair is expected to find its first resistance at 1.1951, and a rise through could take it to the next resistance level of 1.2023.
Trading trend in the Euro today is expected to be determined by the release of the Euro-zone's flash consumer price inflation for August as well as Germany's retail sales for July and unemployment rate for August, all scheduled to release in a few hours. Additionally, the US pending home sales, personal income as well as spending data, all for July coupled with the nation's initial jobless claims data, all set to release later in the day, will pique significant amount of investor attention.
The currency pair is trading below its 20 Hr and 50 Hr moving averages.
