Sample Category Title
EURUSD Intraday Analysis
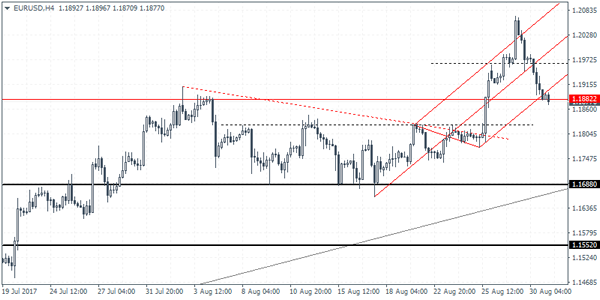
EURUSD (1.1877): The EURUSD extended the declines yesterday with price action falling to test the first support level at 1.1882. Further declines could see the common currency falling to the next main resistance level at 1.1825. A rebound off either of these two levels is quite possible which could see some near-term upside in prices. However, watch for a lower high being formed as a result of this bounce which could signal the start of the correction towards 1.1688. Resistance can be seen forming around 1.1963 which could see a near term reversal. EURUSD could potentially stay range bound within these levels following which a breakout trade might occur. To the upside, above 1.1963, further gains could push EURUSD past the 1.20 handle, while to the downside we expect a test of 1.1688.
US Dollar Gains On ADP Report And GDP Revisions
The greenback posted strong gains, rising on the back of a better than expected private payrolls report and a revised second quarter GDP. Official data showed yesterday that private sector hiring in the US added 237k jobs. This was higher than the forecasts of 185k while July's private payrolls were revised up to 201k. The second quarter GDP report showed that the US economy expanded at a pace of 3%, beating estimates of 2.7% and better than the initial reading of 2.6%.
Looking ahead, the economic calendar today covers the preliminary CPI from France, followed by the Eurozone's CPI data. Headline inflation is expected to accelerate 1.4%, after rising 1.3% in July. Core CPI is however forecast to remain steady at 1.2%. In the US the core PCE data will be coming out later. Forecasts point to a 0.1% increase on a month over month basis.
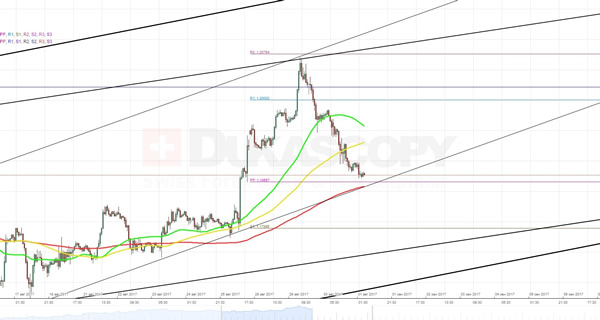
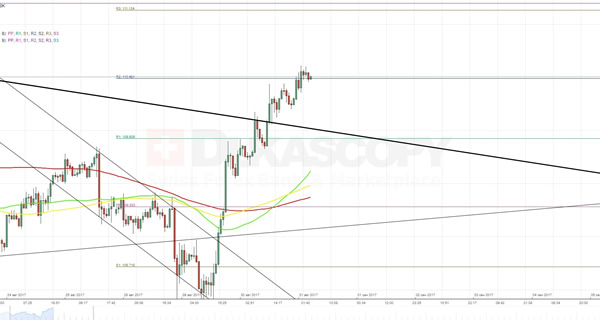
EURUSD Analysis: Plunges To 1.18
As it was expected, during the whole previous trading day the currency exchange rate was moving in ascending channel. At the moment, it is approaching a combined support level formed by the weekly PP at 1.1865 and the 200-hour SMA.
A rebound is expected to happen even if the rate will manage to slightly overstep beyond that barrier. One of the reasons is that a little bit lower there is located a bottom boundary of a large ascending channel that guides movement of the pair. The second reason is that there will be no notable data releases today. This means that the buck will not get any additional impulse from traders, anticipating these events (as it happened during the last couple of days).
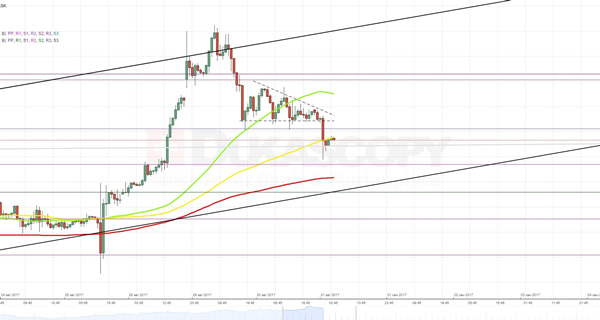
GBPUSD Analysis: Trades In A Limbo
In line with expectations, yesterday the exchange rate continued to move towards the 100-hour SMA amid a pressure from a combination of the weekly R1 and the monthly S1 as well as from release of the US macroeconomic data. At the moment, the pair is remaining in a limbo between these support and resistance levels.
Most probably, the Pound will continue to try to sneak to the top, using a silent day for its counterpart. On the other hand, the further fall towards the 1.28 mark seems a more reasonable path, as it contains a lot of free space until the 200-hour SMA near 1.2872. Nevertheless, a summary of technical indicators vote in favour of the surge, sending a strong buy signal.
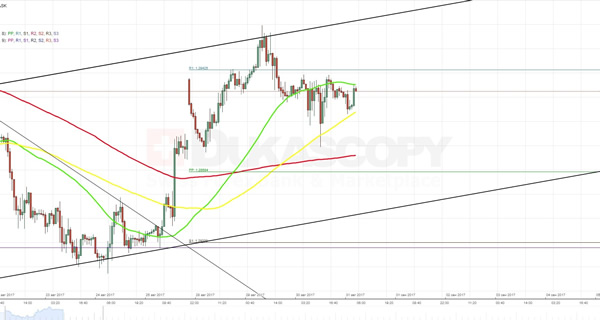
USDJPY Analysis: Breaks From Ascending Channel
Fortunately for the buck, both data releases were even better that analysts anticipated. Even though they did not arouse especially high interest, but it was still enough to push the currency pair out of the channel. The surge gradually continued until the pair faced the first resistance level set up by the weekly R2 at 110.49. Contrary to the previous three days, today the Dollar will not have any additional stimulus from the fundamental side. Accordingly, the pair is likely to retreat back to the weekly R1 at 109.92. Yet, the sharp fall is not expected, as the southern side is reliably secured by the 55-, 100- and 200-hour SMAs. However an opposite scenario is likely to happen as well, an aggregate of technical indicators sends a strong buy signal for the 5H and 1D timeframes.
XAUUSD Analysis: Slips To 1,303.75
Yesterday the American Dollar continued to strengthen against the yellow metal and even managed to form a little descending triangle, whose lower support line matched with the upper boundary of a former long-term ascending channel.
In the early Thursday morning the bullion lost another 0.33% and slipped below the 100-hour SMA. On the one hand, a forming downtrend suggests that the plunge can continue at least until the 200-hour SMA near 1,295.80. On the other hand, over the last three days appreciation of the buck was mainly driven by various fundamental events. In contrast, today there will be no significant data releases that could give the Dollar a necessary impulse for the further surge.
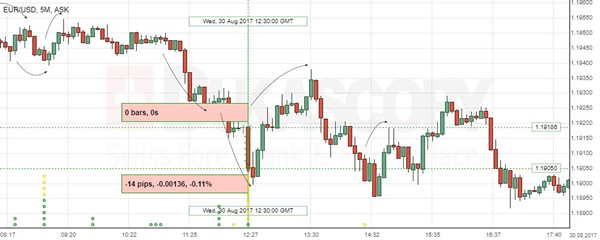
EUR/USD: Prelim GDP
The Euro lost against the US Dollar 14 base points, following Wednesday's report showing the second estimate for the US economic growth. The EUR/USD dropped to the 1.1950 mark and retreated back initially, though the downward trend was sustained to see the pair returning to the last Friday levels by the morning session on Thursday.
The Commerce Department reported that the US economy expanded at a faster-than-expected yearly pace of 3.0% in the Q2. The country's GDP growth marked the strongest reading in more than two years, nearing Donald Trump's target. A rise was led by higher consumer spending and business investment, which could be further translated into a stronger path in the Q3 to dampen possible effects of Hurricane Harvey.
EUR/GBP Candlesticks and Ichimoku Analysis
Weekly
• Last Candlesticks pattern: N/A
• ime of formation: N/A
• Trend bias: Near term up
Daily
• Last Candlesticks pattern: Doji
• Time of formation: 21 Jul 2017
• Trend bias: Up
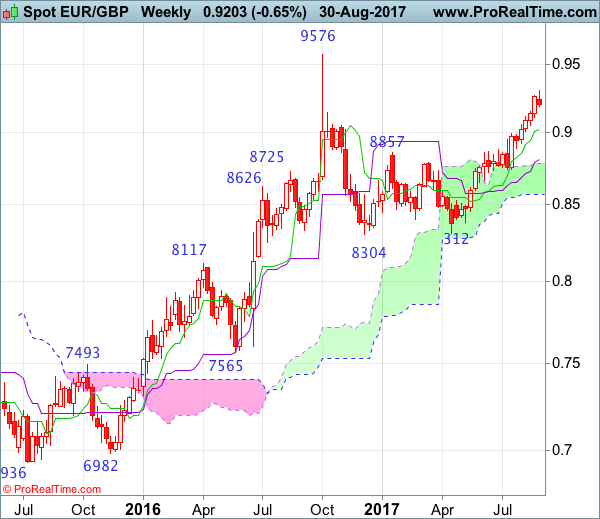
EURGBP – 0.9218
As the single currency has finally retreated after rising to 0.9307 earlier this week, suggesting a week of consolidation below this level would be seen and below the Tenkan-Sen (now at 0.9165) would add credence to this view, bring retracement to the Kijun-Sen (now at 0.9099), however, still reckon downside would be limited to 0.9050-55 and support at 0.9008 should remain intact, bring another upmove later. Above said resistance at 0.9307 would signal medium term upmove is still in progress and extend headway to 0.9350-55 but near term overbought condition should prevent sharp move beyond 0.9380-85 (100% projection of 0.8312-0.8950 measuring from 0.8743) and reckon 0.9400-10 would hold from here, risk from there is seen for a strong retreat to take place later.
On the downside, whilst initial pullback to the Tenkan-Sen (now at 0.9165) and then the Kijun-Sen (now at 0.9099) cannot be ruled out, reckon 0.9050-55 would limit downside and brig another rise later. A daily close below support at 0.9008 would defer and suggest a temporary top has been formed, bring retracement of recent upmove to previous resistance at 0.8950 and later towards 0.8895-00, having said that, reckon the upper Kumo (now at 0.8868) would contain downside, bring another rise later.
Recommendation: Buy again at 0.9050 for 0.9250 with stop below 0.8980.
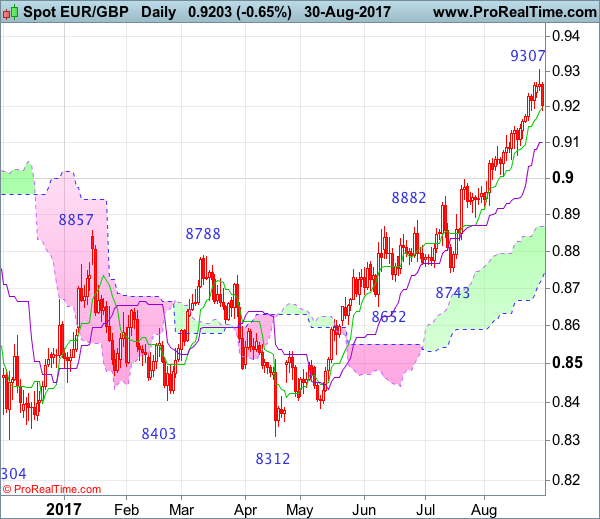
On the weekly chart, although the single currency extended recent rise to 0.9307 earlier this week, the subsequent retreat looks set to form a black candlestick with a long upper shadow (shooting star alike), hence consolidation below this level would be seen and pullback to 0.9130-35 and then 0.9095-00 is likely, however, reckon the Tenkan-Sen (now at 0.9025) would limit downside and bring another rise later. Above said resistance at 0.9307 would signal recent erratic rise from 0.8304 is still in progress and may extend gain to 0.9350-60, then 0.9380-85 (100% projection of 0.8312-0.8950 measuring from 0.8743). Looking ahead, break there is needed to retain bullishness and signal the entire correction from 0.9576 top has ended at 0.8304 and encourage for further subsequent gain to 0.9450.
On the downside, although pullback to 0.9130-35 cannot be ruled out, reckon 0.9050-55 would limit downside and the Tenkan-Sen (now at 0.9025) should hold, bring another rise. A drop below support at 0.8891 would defer and suggest top is possibly formed, bring retracement of recent upmove to 0.885-60, then test of the Kijun-Sen (now at 0.8810) but reckon support at 0.8743 would hold. Only a weekly close below this support would retain bearishness for subsequent decline to 0.8650-55 but the lower Kumo (now at 0.8571) should remain intact, bring another rally later.
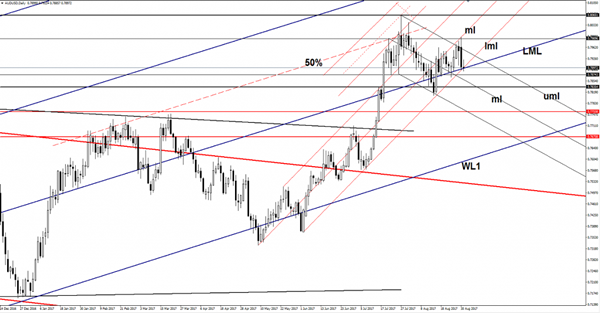
AUD/USD Imminent Breakdown
Price dropped sharply on Wednesday and seems motivated the take out the major support from the lower median line (LML). Is challenging the confluence area formed between the LML with the lower median line (lml) of the ascending pitchfork, a valid breakdown will accelerate the sell-off.
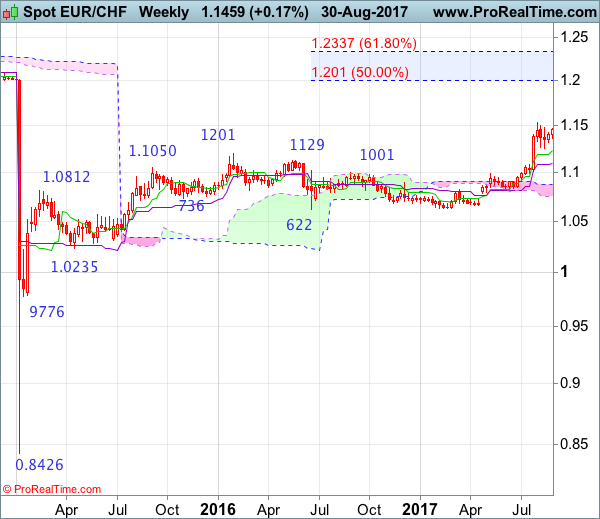
EUR/CHF Candlesticks and Ichimoku Analysis
Weekly
• Last Candlesticks pattern: Long white candlestick
• Time of formation: 24 Jul 2017
• Trend bias: Up
Daily
• Last Candlesticks pattern: Morning doji
• Time of formation: 25 Jul 2017
• Trend bias: Up
EUR/CHF – 1.1425
As the single currency has risen again after finding support around 1.1355, adding credence to our view that the pullback from 1.1538 has possibly ended at 1.1259 and consolidation with mild upside bias remains for gain towards resistance at 1.1479, however, a daily close above there is needed to add credence to this view, bring retest of this level later. Only a break of said recent high at 1.1538 would confirm recent upmove has resumed and extend headway to 1.1600-10, having said that, further sharp move beyond 1.1700 should not be repeated and price should falter below 1.1770-80, bring retreat later.
On the downside, whilst pullback to 1.1395-00 cannot be ruled out, reckon the Tenkan-Sen (now at 1.1357) would contain downside and bring another rise later. Below support at 1.1343 would bring test of 1.1320-25, break there would suggest the rebound from 1.1259 has ended, bring retest of this level, below there would extend the corrective fall from 1.1538 top for retracement of recent upmove to 1.1185 (50% Fibonacci retracement of 1.0833-1.1538), however, sharp fall below 1.1100-05 (61.8% Fibonacci retracement) should not be repeated and 1.1050 would hold, bring rebound later.
Recommendation: Hold long entered at 1.1355 for 1.1555 with stop below 1.1350.
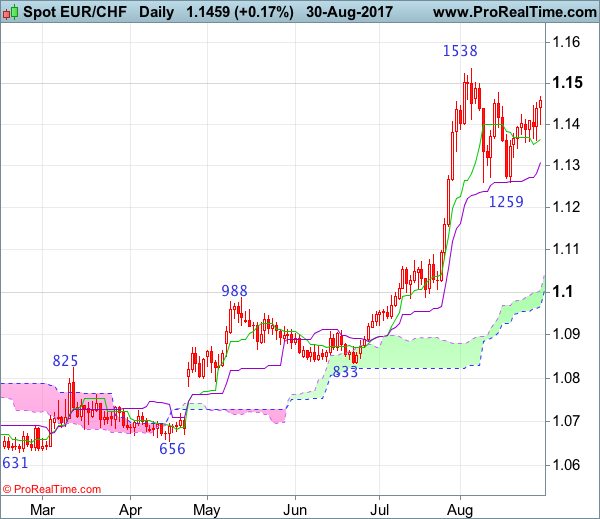
On the weekly chart, as the single currency found support at 1.1259 and has rebounded, suggesting consolidation with upside bias would be seen but break of 1.1479 resistance is needed to signal the pullback from 1.1538 has ended there and bring retest of this level. Only a break of this recent high would revive bullishness and extend the major rise from 0.8426 low for headway to 1.1590-00, then towards 1.1700-10, however, overbought condition should prevent sharp move beyond 1.1800 and reckon 1.1900-10 would hold from here, risk from there has increased for a retreat to take place later.
On the downside, expect pullback to be limited to 1.1355-60 and bring another rise later. Below 1.1320-25 would risk test of said support at 1.1259, break there would shift near term risk to the downside, a weekly close below the Tenkan-Sen (now at 1.1231) would suggest a temporary top is formed instead, bring retracement of recent rise to 1.1100-05 (61.8% Fibonacci retracement of 1.0833-1.1538), then test of the Kijun-Sen (now at 1.1097) but reckon support at 1.0987 would remain intact.