Sample Category Title
Daily Technical Outlook And Review: EUR/USD, GBP/USD, AUD/USD, USD/JPY, USD/CAD, USD/CHF, DOW 30, GOLD
A note on lower timeframe confirming price action...
Waiting for lower timeframe confirmation is our main tool to confirm strength within higher timeframe zones, and has really been the key to our trading success. It takes a little time to understand the subtle nuances, however, as each trade is never the same, but once you master the rhythm so to speak, you will be saved from countless unnecessary losing trades. The following is a list of what we look for:
- A break/retest of supply or demand dependent on which way you're trading.
- A trendline break/retest.
- Buying/selling tails ... essentially we look for a cluster of very obvious spikes off of lower timeframe support and resistance levels within the higher timeframe zone.
- Candlestick patterns. We tend to only stick with pin bars and engulfing bars as these have proven to be the most effective.
We typically search for lower-timeframe confirmation between the M15 and H1 timeframes, since most of our higher-timeframe areas begin with the H4. Stops are usually placed 1-3 pips beyond confirming structures.
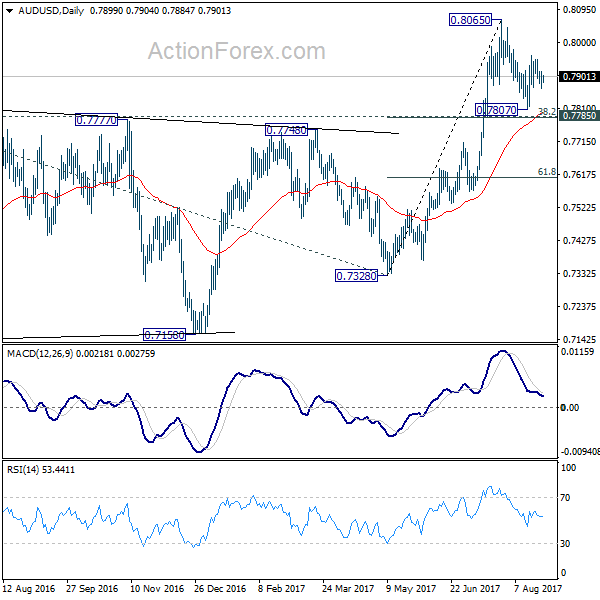
EUR/USD
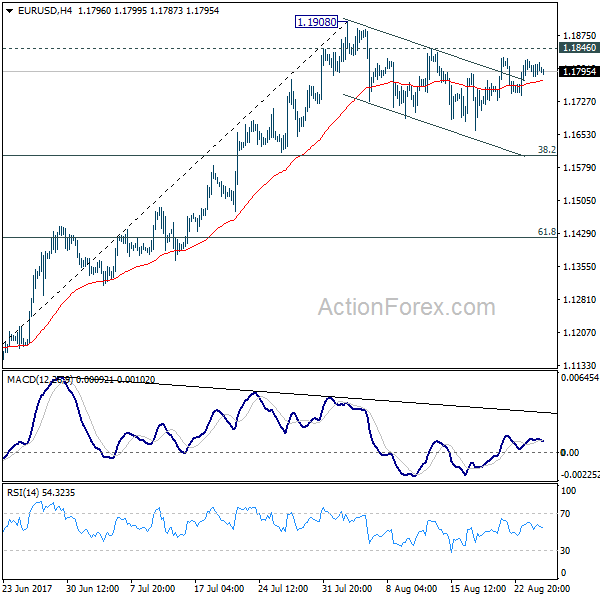
In recent trading we can see that price took on more of a sober approach on Thursday. Clinging to the 1.18 handle, the pair only managed to range a mere 33 pips on the day. In light of the somewhat lackluster approach, we continue to follow a neutral bias in this market. Here’s why.
Directly above current price there’s a nearby H4 Quasimodo resistance level at 1.1823 (shadowed closely by August’s opening level at 1.1830). However, considering that the USDX shows room for the H4 candles to push down as far as the trendline support extended from the low 11853, we may see the two noted H4 resistances give way sometime today.
The story over on the weekly chart shows that the buyers and sellers remain battling for position below a major resistance at 1.1871. A similar picture can be seen on the US dollar index (USDX), only inverse from a weekly support drawn in at 11854. Looking down to the daily timeframe, price is currently seen sandwiched between a supply zone coming in at 1.1968-1.1862 and a demand base lodged at 1.1650-1.1733.
Suggestions: A decisive close above 1.1830 on the H4 chart likely clears the footpath north up to the 1.19 band. While this may be true on the H4 timeframe, the bigger picture shows we have both the underside of the current daily supply at 1.1862 and the weekly resistance at 1.1871 to contend with before 1.19 can be achieved. This, for us, makes buying beyond 1.1830 just too much of a risk, and therefore a market best left on the back burner for the time being.
Data points to consider: German IFO business climate survey at 9am, ECB President Draghi speaks at 8pm. US Core durable goods orders at 1.30pm, Fed Chair Yellen speaks at 5pm GMT+1. US Jackson Hole symposium (all day).
Levels to watch/live orders:
- Buys: Flat (stop loss: N/A).
- Sells: Flat (stop loss: N/A).
GBP/USD:
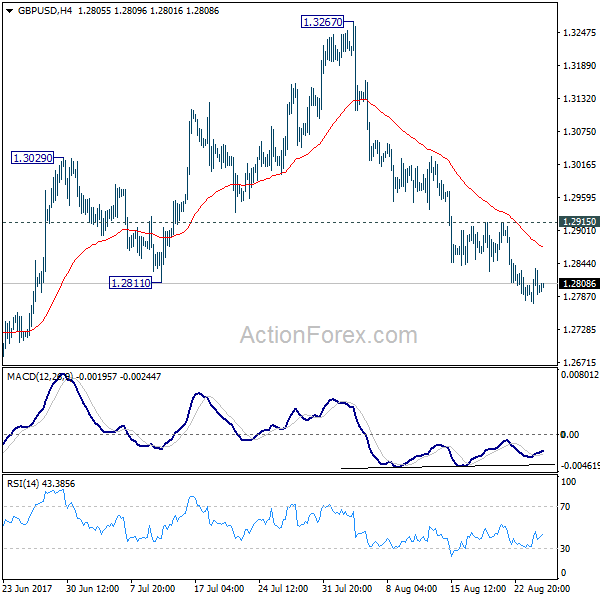
Kicking this morning’s report off with a look at the weekly timeframe, we can see that price is loitering just ahead of a demand base pegged at 1.2589-1.2759. Looking down to the daily timeframe, however, the unit is seen shaking hands with a support area at 1.2818-1.2752, which happens to intersect closely with a channel support line etched from the low 1.2365. Also of particular interest here is this area is seen glued to the top edge of the aforementioned weekly demand.
A closer look at price action on the H4 timeframe shows price briefly rose above the 1.28 handle yesterday, and managed to clock a high of 1.2836 on the day. Still, like the EUR/USD, the GBP ended the day pretty much unchanged with price closing a few pipettes back below 1.28.
Suggestions: In view of the unit’s close proximity to the weekly demand, as well as price currently interacting with a daily support area, we’re STILL reluctant to take on any medium/long-term shorts at this time. However, we are still interested in buying from the 1.28 neighborhood. But for this trade to come to fruition, we still require a decisive H4 close back above 1.28. This, alongside a retest and a reasonably sized H4 bullish candle (preferably printed in the shape of a full, or near-full-bodied candle) would, in our opinion, be enough to validate a long trade. The first area of concern would be the H4 mid-level resistance at 1.2850, followed closely by June’s opening level at 1.2870.
Data points to consider: US Core durable goods orders at 1.30pm, Fed Chair Yellen speaks at 5pm GMT+1. US Jackson Hole symposium (all day).
Levels to watch/live orders:
- Buys: Watch for H4 price to close back above 1.28 and then look to trade any retest seen thereafter ([waiting for a reasonably sized H4 bullish candle to form following the retest is advised] stop loss: ideally beyond the candle’s tail).
- Sells: Flat (stop loss: N/A).
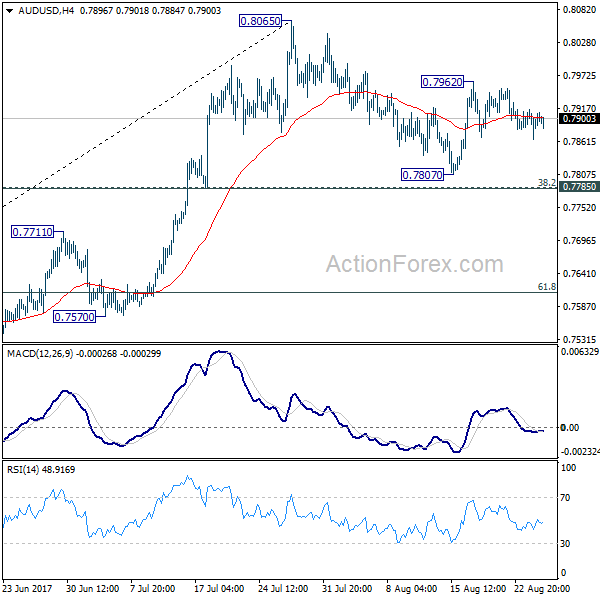
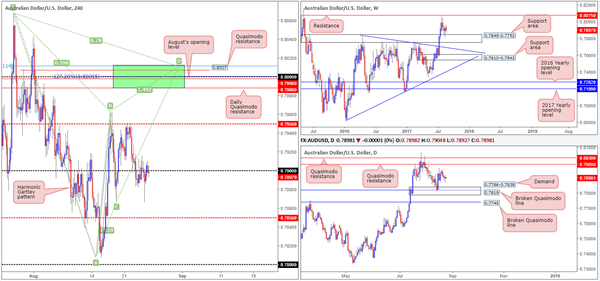
AUD/USD
AUD/USD prices are effectively unchanged this morning, despite the pair ranging almost 50 pips on the day. As you can see from the H4 timeframe, the candles spent the day seesawing around the 0.79 handle. As of current price though, the sellers are seen pressing south, which could lead to the unit challenging the mid-level support at 0.7850 today.
At this time, there is very little to hang our hat on as far as trading opportunities go! This is largely due to the higher- timeframe direction. On the weekly timeframe, the bulls continue to defend the support area at 0.7849-0.7752 which could eventually see price advancing higher. Down on the daily timeframe, nonetheless, the candles appear confined between a demand area at 0.7786-0.7838 and a Quasimodo resistance at 0.7988, meaning the unit could effectively trade either way!
Suggestions: With the above notes in mind, our team has decided to remain flat for the time being.
Data points to consider: US Core durable goods orders at 1.30pm, Fed Chair Yellen speaks at 5pm GMT+1. US Jackson Hole symposium (all day).
Levels to watch/live orders:
- Buys: Flat (stop loss: N/A).
- Sells: Flat (stop loss: N/A).
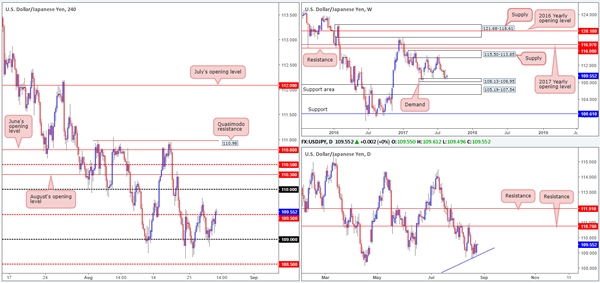
USD/JPY
USD/JPY bulls seem to have a slight edge this morning. On the weekly timeframe, price is currently showing promise from demand pegged at 108.13-108.95. Uniting nicely with this weekly demand is a daily trendline support etched from the low 100.08. Should the bulls continue to climb from this trendline, the next upside target in view is a resistance level marked at 110.76.
Bouncing over to the H4 candles, we can see that price was recently bid above the mid-level resistance at 109.50. This, given the current landscape on the higher timeframes, could attract fresh buyers into the market place and pull price up to at least the 110 handle.
Suggestions: Drill down to the lower timeframes and look to enter long from the 109.50. To do this, you may want to consider using the techniques displayed at the top of this report.
Data points to consider: US Core durable goods orders at 1.30pm, Fed Chair Yellen speaks at 5pm GMT+1. US Jackson Hole symposium (all day).
Levels to watch/live orders:
- Buys: 109.50 region ([waiting for a lower-timeframe confirming buy signal to form before pulling the trigger is advised] stop loss: dependent on where one confirms this area).
- Sells: Flat (stop loss: N/A).
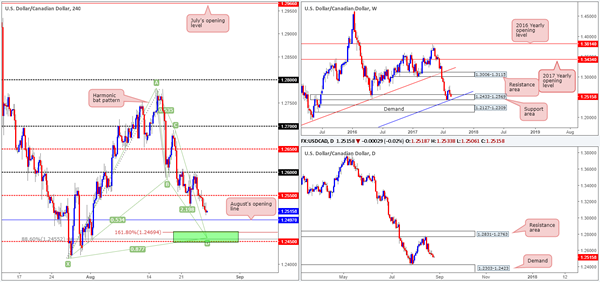
USD/CAD
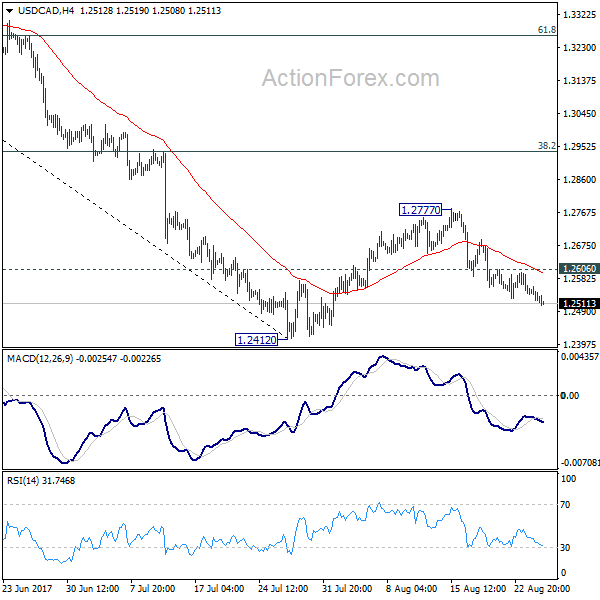
After touching gloves with the 1.26 handle early on in Wednesday’s session, the pair has since been on the decline. With the H4 mid-level support at 1.2550 now out of the picture, August’s opening level at 1.2497 is the next support on the hit list. Beyond this monthly level, however, is a H4 Harmonic bat completion point at 1.2455.
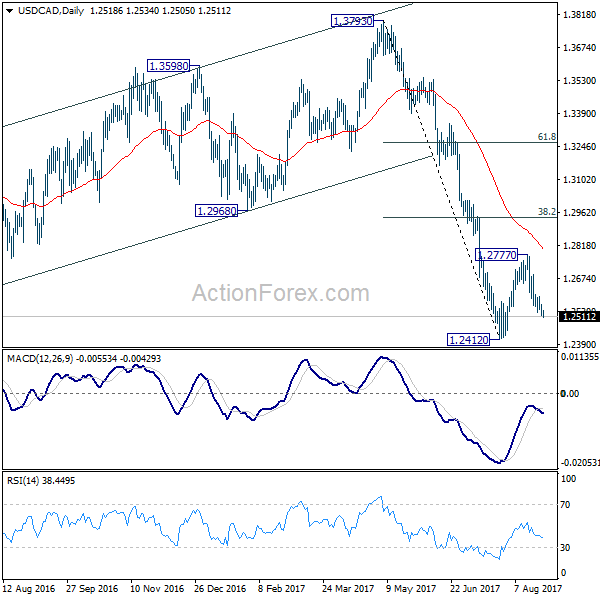
Despite the stronger-than-expected rebound seen from the weekly support area given at 1.2433-1.2569 three weeks ago, weekly action recently pulled back and is now seen trading back within the walls of this zone. Technically speaking, the selloff is likely due to the daily resistance area coming in at 1.2831-1.2763. Should the bears continue to dominate from this zone, the next area on the hit list is the demand penciled in at 1.2303-1.2423 (positioned just below the aforementioned weekly support area).
The H4 Harmonic bat pattern mentioned above boasts a powerful XA retracement (88.6% Fib retracement at 1.2455) and is located just ahead of the H4 mid-level support 1.2450. It is also positioned within the noted weekly support area and its converging weekly trendline support taken from the low 0.9633.
Suggestions: In the event that the Harmonic pattern completes, we will be interested buyers here. Additional confirmation, in our opinion, is not required since we can comfortably place stops beyond the X point (1.2413) and still achieve adequate risk/reward.
Data points to consider: US Core durable goods orders at 1.30pm, Fed Chair Yellen speaks at 5pm GMT+1. US Jackson Hole symposium (all day).
Levels to watch/live orders:
- Buys: 1.2450 (stop loss: 1.2411).
- Sells: Flat (stop loss: N/A).
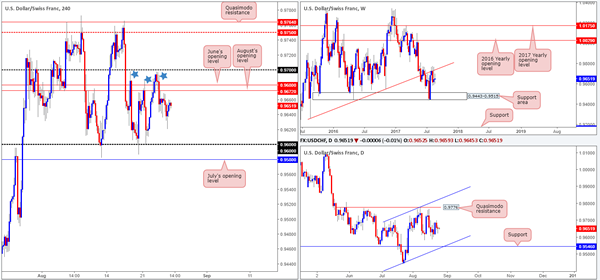
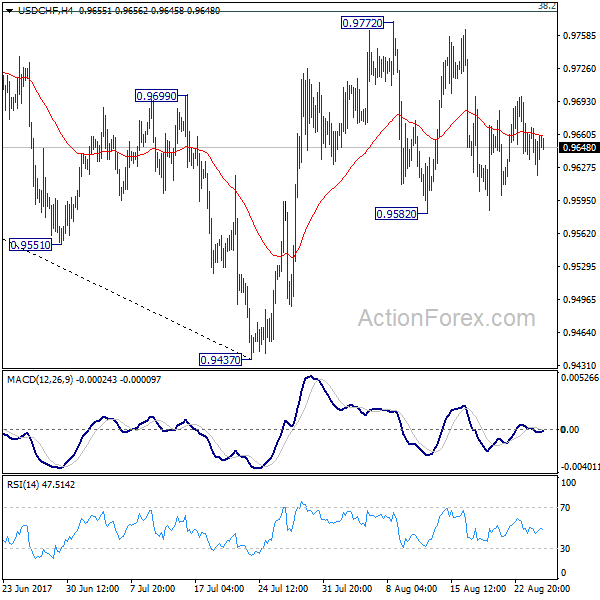
USD/CHF
Using a top-down approach this morning, the weekly timeframe shows that the trendline resistance extended from the low 0.9257 remains in play. This has, in our opinion, firmly placed the weekly support area at 0.9443-0.9515 back on the hit list. Also noteworthy is the daily timeframe. The chart shows room for the pair to trade as far down as support coming in at 0.9546, which happens to unite with a channel support etched from the low 0.9438. A closer look at price action on the H4 timeframe shows the unit is currently trading within striking distance of June and August’s opening levels at 0.9680/0.9672.
Suggestions: Despite the higher-timeframe picture suggesting further downside, we’re wary about selling from 0.9680/0.9672, as price has whipsawed through these levels on three occasions over the past two weeks (see blue stars).
Considering this, our desk has decided to remain on the sidelines for the time being.
Data points to consider: US Core durable goods orders at 1.30pm, Fed Chair Yellen speaks at 5pm GMT+1. US Jackson Hole symposium (all day).
Levels to watch/live orders:
- Buys: Flat (stop loss: N/A).
- Sells: Flat (stop loss: N/A).
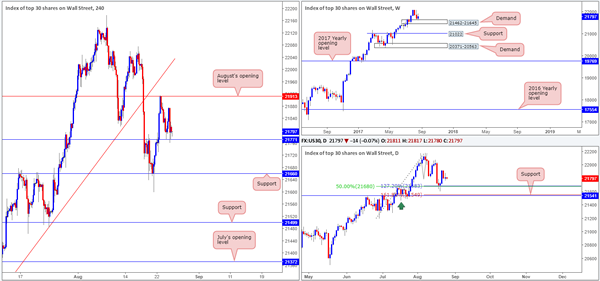
DOW 30
Recent action on the H4 timeframe shows how powerful monthly open levels can be! August’s opening level at 21913 has held price lower since Wednesday. In spite of this, 21771 has also provided the market with adequate support.
Up on the weekly timeframe, demand at 21462-21645 has, as you can see, managed to bolster price action this week. This should not really come as too much of a surprise as it is a WEEKLY demand, and it is positioned within an incredibly strong uptrend. Daily price on the other hand is seen lurking just ahead of an interesting support comprised of a 127.2% Fib ext. point at 21683, and a daily 50% support line at 21680 drawn from the low 21192.
Our suggestions: Buying from the current H4 support could be an option today. However, despite weekly price trading from demand, we still believe a buy from here may be too risky. The reason being is simply due to daily price showing room to trade lower, which could end up sending price back down to the H4 support lodged at 21660.
Data points to consider: US Core durable goods orders at 1.30pm, Fed Chair Yellen speaks at 5pm GMT+1. US Jackson Hole symposium (all day).
Levels to watch/live orders:
- Buys: Flat (stop loss: N/A).
- Sells: Flat (stop loss: N/A).
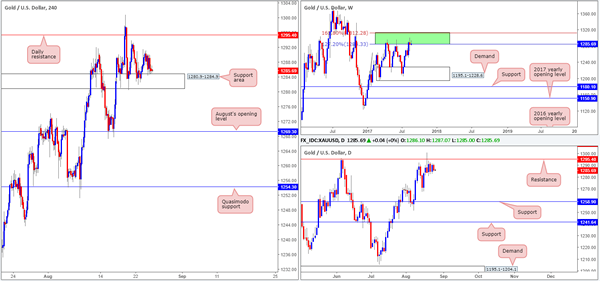
GOLD:
Beginning with the weekly timeframe this morning, it is clear to see that the bears are making an effort to bring price action lower. As you can see, weekly price is currently located within a green weekly resistance area comprised of two weekly Fibonacci extensions 161.8/127.2% at 1312.2/1284.3 taken from the low 1188.1.
The story on the daily chart, nevertheless, shows price trading from a resistance level at 1295.4. Ever since price struck this line back on the 18th August, the daily candles have been trading within a tight consolidation.
Bouncing across to the H4 chart, the support area at 1280.9-1284.9 continues to bolster price. Therefore, for those who are looking to short based on the weekly and daily structures in play right now, we would advise waiting for the current support area to be engulfed. This would not only confirm seller strength from the higher-timeframe structures, but also open the path south down to August’s opening level at 1269.3.
Our suggestions: Watch for the current H4 support area to be engulfed before considering selling this market. A H4 close beyond this area, followed up with a retest and a H4 bearish rotation candle (preferably a full, or near-full-bodied candle) would, in our view, be enough to justify a short, targeting August’s opening level at 1269.3.
Levels to watch/live orders:
- Buys: Flat (stop loss: N/A).
- Sells: Watch for H4 price to engulf 1280.9-1284.9 and then look to trade any retest seen thereafter ([waiting for a H4 bearish rotation candle to form following the retest is advised] stop loss: dependent on where one confirms this area).
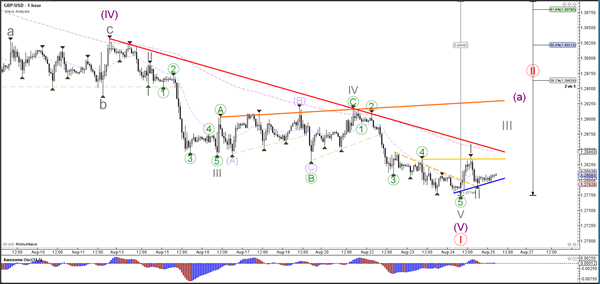
Daily Technical Analysis: GBP/USD Challenges Resistance Of Downtrend Channel After 1.2775 Bounce
Currency pair GBP/USD
The GBP/USD is testing the resistance line of the downtrend channel (red) after indeed bouncing near the round quarter support level of 1.2750. A bullish breakout could start wave A (purple) of a larger wave 2 (red) correction. A bearish break below support (blue) and the 1.2750 support could restart the downtrend within the channel.
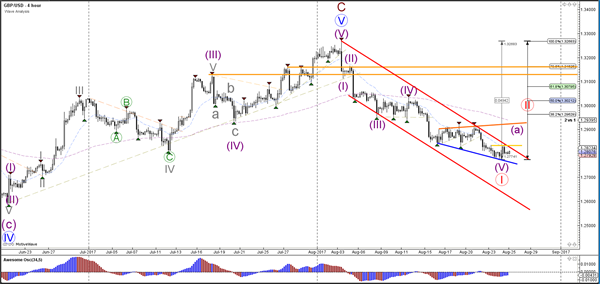
The GBP/USD broke above the resistance trend line (dotted orange) and could be starting a wave A (purple) correction if price manages to break above the next resistance trend lines and stay above support (blue).
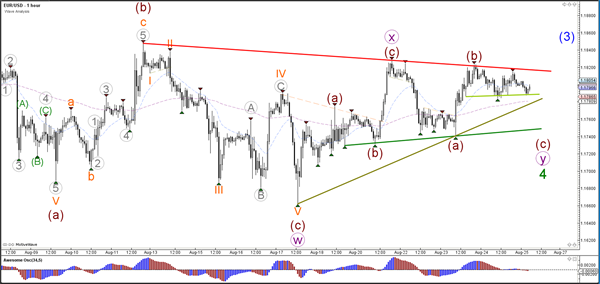
Currency pair EUR/USD
The EUR/USD is building an extended and complex correction within wave 4 (green). Price is still challenging the resistance trend line (red) of the triangle chart pattern and the next breakout above resistance (red) should see the continuation of wave 3 (blue). Price could also retest the support trend lines (green/blue) within wave Y (purple).

The EUR/USD is building a sideways correction and has both support (green) and resistance (red) nearby. There is the possibility of an ABC (brown) correction before wave 4 (green) is ready but a break above the major resistance (red) would indicate a potential bullish breakout.
Currency pair USD/JPY
The USD/JPY is again bouncing at the support zone (green lines). A bounce could see price move higher towards the Fib levels of wave B vs A whereas a bearish break could indicate a downtrend continuation.
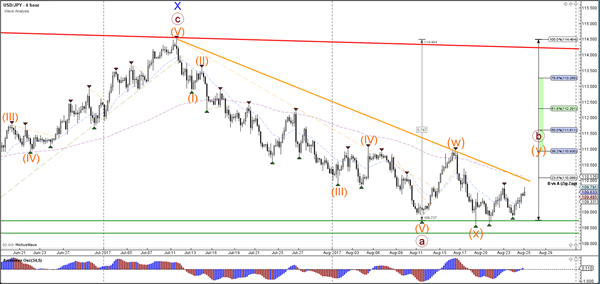
The USD/JPY is building a channel (red/blue lines) at the support zone (green).
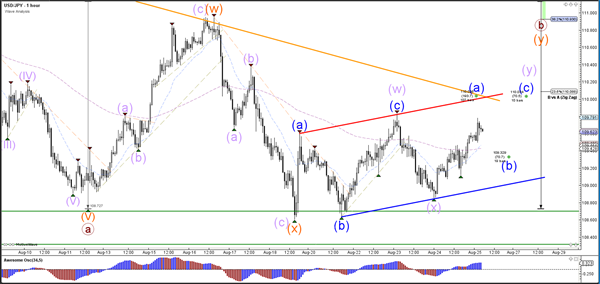
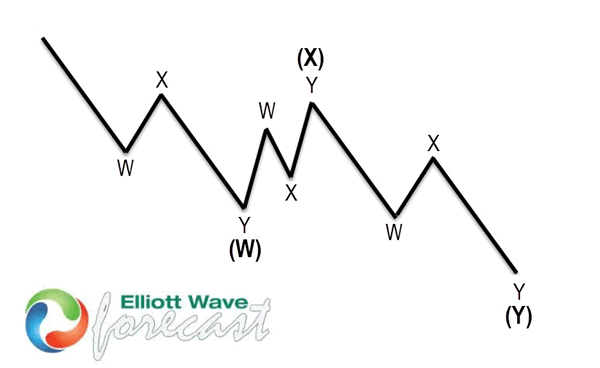
Elliott Wave View: USDJPY Double Correction
Short term USDJPY Elliott wave view suggests the decline from 7/11 peak is unfolding as a double three Elliott wave structure. Decline to 108.71 low ended Minor wave W and Minor wave X bounce ended at 110.95 peak. Subdivision of Minor wave Y is unfolding as another double three structure of a lesser degree. Minute wave ((w)) of ((Y) ended at 108.59 low and revised view suggests Minute wave ((x)) of (Y) bounce remains in progress to correct cycle from 8/16 peak towards 110.05 – 110.35 before pair turns lower. We don’t like buying the proposed bounce, and as far as pivot at 110.95 remains intact, expect sellers to appear at 110.05 – 110.35 for a new low or at least pullback in 3 waves.
USDJPY 1 Hour Elliott Wave Chart
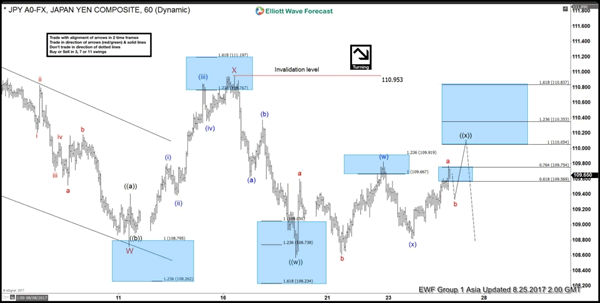
Double three ( 7 swings) is the most important pattern in Elliott wave’s new theory. It is also probably the most common pattern in the market these days. Double three is also known as a 7-swing structure. It is a very reliable pattern that gives traders a good opportunity to trade with a well-defined level of risk and target areas. The image below shows what Elliott Wave Double Three looks like. It has labels (W), (X), (Y) and an internal structure of 3-3-3. This means that all 3 legs has corrective sequences. Each (W) and (Y) is formed by 3 wave oscillations and has a structure of A, B, C or W, X, Y of smaller degrees.
Markets Sit Tight Awaiting Jackson Hole Speeches
Jackson Hole Symposium kicks off. The highly anticipated Jackson Hole Symposium is off to a good start, but traders appear to be holding off any huge positions until ECB head Mario Draghi and Fed Chairperson Janet Yellen deliver their key speeches later in the day. Investors are waiting for any clues on further U.S. rates rises, the timing of its balance sheet tapering and if Europe is still looking to rein in stimulus.
More Infighting In Washington. U.S. President Donald Trump threw shade on his fellow Republicans for putting the government on the brink of a shutdown due to the looming debt ceiling deadline. He said on Twitter on Thursday that Republican congressional leaders could avoid a legislative “mess” if followed his advice to tie debt ceiling legislation a few weeks back.
Downbeat Medium-Tier U.S. Data. Stronger-than-expected data on U.S. initial jobless claims on Thursday helped the dollar stay positive on the day. The dollar edged higher against the other major currencies, but gains were capped by the release of disappointing U.S. housing sector data and as investors shifted focus to an upcoming global central bankers’ meeting.
Yen Awaiting Jackson Hole Key Speeches. The yen slipped further against the dollar on Friday with consumer prices data in Japan meeting expectations and a pair of speeches by the Fed chair and ECB president highly awaited.
Mixed Day For Commodities. Gold was trading mostly sideways for the day as investors seemed to be saving their moves until after Mario Draghi and Janet Yellen have delivered their testimonies.
Crude Oil Is Down. Crude oil took a hit on speculations that Hurricane Harvey could lead refineries to shore up stockpiles before shutting down when the storm hits. The U.S. National Hurricane Center predicted that Harvey will turn into a major hurricane by Friday as it approaches Texas, likely leading to outages along the U.S. Gulf Coast. Nearly half of the country’s petroleum refining capacity is located along the Gulf Coast, along with roughly 51% of U.S. natural gas processing plants.
Watch Out Today For:
- 12:30 pm GMT: USD Durable Goods Orders
- 14:00 pm GMT: USD Federal Reserve Chairperson Janet Yellen Speaks
- 19:00 pm GMT: EUR ECB President Mario Draghi Speaks
EUR/USD Daily Outlook
Daily Pivots: (S1) 1.1782; (P) 1.1800 (R1) 1.1816; More...
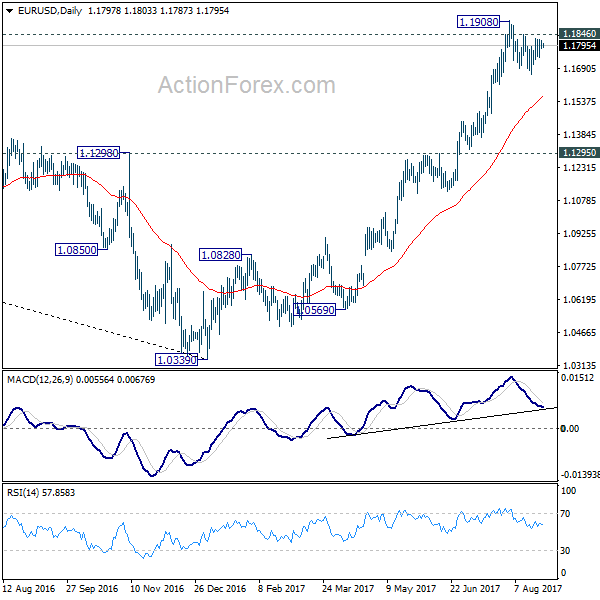
Intraday bias in EUR/USD remains neutral as consolidation from 1.1908 is still in progress. In case of another fall, downside should be contained by 38.2% retracement of 1.1119 to 1.1908 at 1.1606 to bring up trend resumption. Break of 1.1846 minor resistance will argue that larger rise from 1.0339 is resuming for 1.2042 long term support turned resistance next.
In the bigger picture, an important bottom was formed at 1.0339 on bullish convergence condition in weekly MACD. Sustained trading above 55 month EMA (now at 1.1768) will pave the way to key fibonacci level at 38.2% retracement of 1.6039 (2008 high) to 1.0339 (2017 low) at 1.2516. While rise from 1.0339 is strong, there is no confirmation that it's developing into a long term up trend yet. Hence, we'll be cautious on strong resistance from 1.2516 to limit upside. But for now, medium term outlook will remain bullish as long as 1.1295 support holds, in case of pull back.
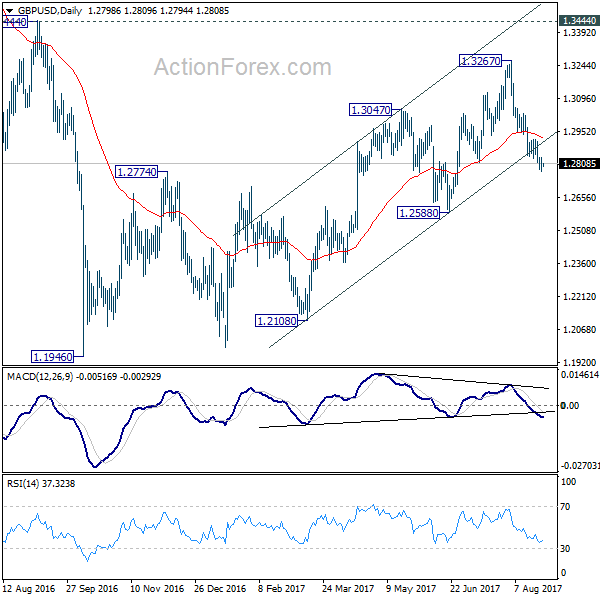
GBP/USD Daily Outlook
Daily Pivots: (S1) 1.2769; (P) 1.2803; (R1) 1.2832; More...
With 1.2915 minor resistance intact, deeper fall is expected in GBP/USD. Current fall from 1.3267 should be targeting to 1.2588 key near term support. As noted before, we're favoring the case that correction from 1.1946 is completed at 1.3267. Decisive break of 1.2588 will confirm our view and target a test on 1.1946 low. Though, break of 1.2915 will indicate short term bottoming and bring stronger rebound.
In the bigger picture, overall, price actions from 1.1946 medium term low are seen as a corrective pattern. While further rise cannot be ruled out, larger outlook remains bearish as long as 1.3444 key resistance holds. Down trend from 1.7190 (2014 high) is expected to resume later after the correction completes. And break of 1.2588 will indicate that such down trend is resuming.
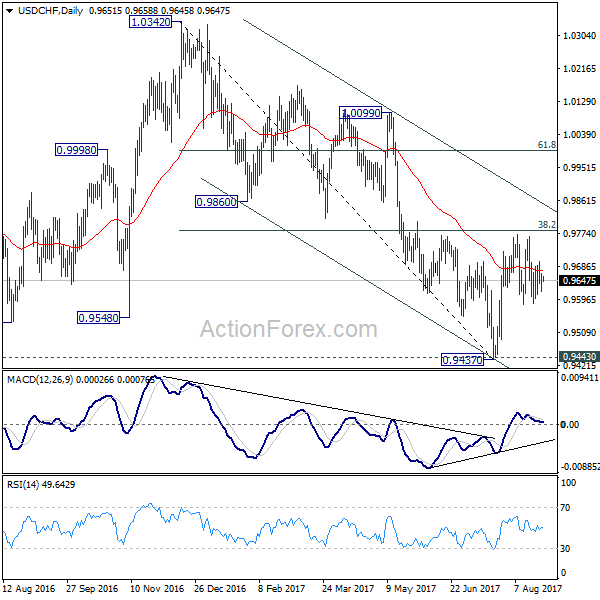
USD/CHF Daily Outlook
Daily Pivots: (S1) 0.9626; (P) 0.9647; (R1) 0.9674; More....
No change in USD/CHF's outlook as it's bounded in range of 0.9582/9772. Intraday bias remains neutral at this moment. On the upside, decisive break of 0.9772 resistance will revive the bullish case of reversal. That is, whole decline from 1.0342 has completed at 0.9437 after defending 0.9443 support. USD/CHF should then target channel resistance (now at 0.9849) next. Meanwhile, the pair is bounded inside medium term falling channel and limited below 38.2% retracement of 1.0342 to 0.9437 at 0.9783 for the moment. Break of 0.9582 will turn bias back to the downside for 0.9437. This could also extend the fall from 1.0342 through 0.9437/43 key support level.
In the bigger picture, we're slightly favoring the case that USD/CHF has successfully defended 0.9443 key support level. And long term range trading in 0.9443/1.0342 is extending with another rise. At this point, there is no sign of an up trend yet. Hence, while further rise is expected in USD/CHF, we'll start to be cautious on loss of momentum above 61.8% retracement of 1.0342 to 0.9437 at 0.9996. However, firm break of 0.9443 will carry larger bearish implication and would target next key support at 0.9072.
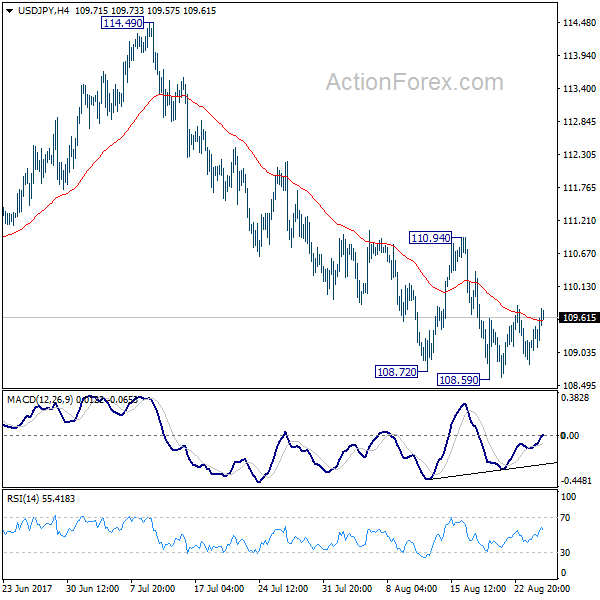
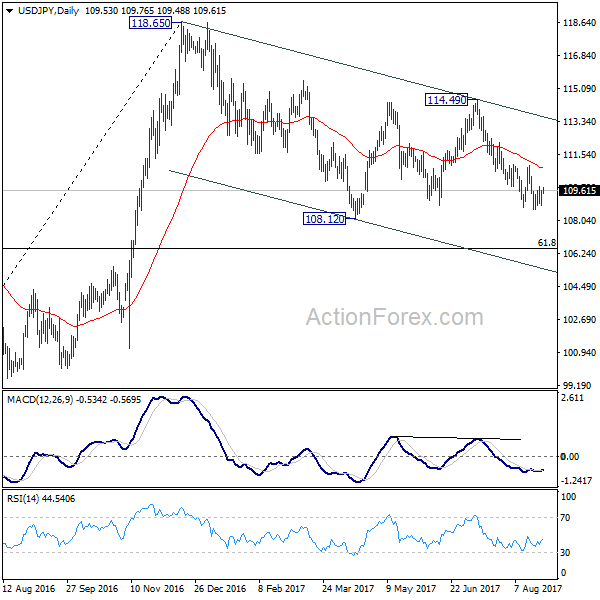
USD/JPY Daily Outlook
Daily Pivots: (S1) 109.05; (P) 109.33; (R1) 109.81; More...
Intraday bias in USD/JPY remains neutral for consolidation above 108.59 temporary low. Near term outlook stays bearish with 110.94 resistance intact and deeper decline is expected. Break of 108.59 will target a test on 108.12 low. Whole corrective decline from 118.65 is possibly resuming and break of 108.12 will target 61.8% retracement of 98.97 to 118.65 at 106.48. Nonetheless, firm break of 110.94 will indicate short term bottoming and turn bias back to the upside.
In the bigger picture, the corrective structure of the fall from 118.65 suggests that rise from 98.97 is not completed yet. Break of 118.65 will target a test on 125.85 high. At this point, it's uncertain whether rise from 98.97 is resuming the long term up trend from 75.56, or it's a leg in the consolidation from 125.85. Hence, we'll be cautious on topping as it approaches 125.85. If fall from 118.65 extends lower, downside should be contained by 61.8% retracement of 98.97 to 118.65 at 106.48 and bring rebound.
USD/CAD Daily Outlook
Daily Pivots: (S1) 1.2501; (P) 1.2531; (R1) 1.2549; More....
Intraday bias in USD/CAD remains mildly on the downside for retesting 1.2412 low first. Break there will resume the larger decline and target next long term fibonacci level at 1.2048. On the upside, above 1.2606 minor resistance will extend the correction from 1.2412 with another rise. But we'd expect upside to be limited by 38.2% retracement of 1.3793 to 1.2412 at 1.2940 to bring fall resumption eventually.
In the bigger picture, price actions from 1.4689 medium term top are seen as a correction pattern. Such corrective fall is still expected to extend to 50% retracement of 0.9406 to 1.4869 at 1.2048. At this point, we'd look for strong support from there to contain downside and bring rebound. Nonetheless, on the upside, sustained break of 1.2968, 38.2% retracement of 1.3793 to 1.2412 at 1.2940 will be the first sign of completion of the correction and will turn focus back to 1.3793 key resistance.
AUD/USD Daily Outlook
Daily Pivots: (S1) 0.7872; (P) 0.7894; (R1) 0.7922; More...
AUD/USD is staying in consolidation and intraday bias remains neutral for the moment. Correction from 0.8065 might extend and another fall cannot be ruled out. But downside should be contained by 0.7785 cluster support (38.2% retracement of 0.7328 to 0.8065 at 0.7783) to bring rebound. Above 0.7962 will target a test on 0.8065 resistance first. Firm break of 0.8065 will resume the medium term rise and target 100% projection of 0.6826 to 0.7833 from 0.7328 at 0.8335.
In the bigger picture, rise from 0.6826 medium term bottom is still in progress. At this point, there is no confirmation of trend reversal yet and we'll continue to treat such rebound as a corrective pattern. But in any case, break of 55 month EMA (now at 0.8097) will target 38.2% retracement of 1.1079 to 0.6826 at 0.8451. Break of 0.7328 support is needed to confirm completion of the rebound. Otherwise, further rise is now in favor.