Sample Category Title
US: Small Signs of Progress in Core Inflation in December
As markets expected, the Consumer Price Index (CPI) rose 0.4% month-on-month (m/m) in December, after rising 0.3% m/m in November. On a twelve-month basis, CPI ticked up to 2.9% (from 2.7% in November).
Over 40% of the headline inflation increase was due to a 2.6% m/m increase in energy prices. Even with that big increase in December, energy prices remain 0.5% below their year ago levels.
Core CPI was slightly softer than expected in December. Excluding food and energy, CPI rose 0.2% m/m after four consecutive 0.3% m/m gains. The twelve-month change edged down a tick to 3.2%.
Core goods prices rose a more modest 0.1% m/m, after a 0.3% gain in November. Prices for new and used vehicles are still exerting upward pressure, but to a lesser extent than in November.
Core services were up 0.3% m/m, matching November's pace. On a year-ago basis, services prices were up 4.4%, down two tenths from the prior month. Shelter prices rose 0.3% m/m in December, with matching 0.3% increases for both rent and owners' equivalent rent. Shelter inflation is 4.6% on a year-on-year basis, continuing to make steady downward progress from its 2023 highs.
Key Implications
December's CPI report contained a little bit of good news on core inflation. After a few months of hotter readings, core prices posted a softer-than-expected gain. Fed members have indicated a desire for a more gradual pace of interest rate cuts this year, and we still think they will take a pause in January. Last Friday's healthy payrolls report provided little reason for the Fed to cut rates quickly. But we expect that a March cut remains on the table, with today's CPI providing reassurance that inflation data surprises are not all in one direction.
One challenge for inflation watchers is that the CPI is not the Fed's preferred inflation measure. That is the core PCE deflator, which did not follow the CPI's lead in November. The 3-month annualized change remained more benign at 2.5%, and still points to downward momentum on the year-on-year measure. The Fed will not get this number before their Jan. 29th decision date. Next week will also bring a deluge of policy shifts from the incoming Trump administration, giving the Fed plenty to think about as it heads into its deliberations.
Sunset Market Commentary
Markets
A minor downward surprise in the December US inflation report triggered an outsized market rally. It’s testament to current stretched market positioning rather than to really softening price pressure. US money markets arrived at the point where adding to the recent calibration would mean betting on a rate hike as a next Fed move rather than a rate cut. Even though we side with the view that there’s limited room left to lower policy rates further, we agree that it’s way too early to already turn that ship the Brazilian way. Turning to the inflation numbers, headline CPI accelerated to 0.4% M/M and 2.9% Y/Y (from 2.7%) as expected. The pace of underlying core CPI unexpectedly slowed down from 0.3% M/M to 0.2% M/M with the annual figure slowing from 3.3% to 3.2% instead of the expected stabilization. US Treasuries rallied with daily yield changes falling by 10 bps to 14 bps with the belly of the curve outperforming the wings. A next 25 bps rate cut by the Fed is now discounted by June rather than by end 2025. The dollar faced a setback but damage was contained as European bonds followed US Treasuries higher. EU swap rates cede 8 to 10 bps with the belly also outperforming. On top, from the euro side of the equation there’s still little to cheer on. Especially in anticipation of president-elect Trump’s inauguration this weekend which could result in an avalanche of immediate executive orders. EUR/USD went from 1.03 to 1.0350. EUR/GBP 0.8448 resistance survived even as UK Gilts received a double boost today. Apart from the US-CPI, we’ve also had lower December UK inflation numbers this morning. Headline, core and services inflation respectively slowed from 2.6% Y/Y to 2.5% Y/Y, from 3.5% Y/Y to 3.2% Y/Y and from 5% Y/Y to 4.4% Y/Y. UK Gilt yields crash 15 bps across the curve with a February BoE rate cut being all of sudden back into play. Vibrant risk sentiment is the dominant force here though. European stock markets currently gain 1%-1.5% with key US equity indices opening 1.5% higher as well. Apart from the goldilocks combination of stronger US payrolls and avoiding more price pressure, it’s worth mentioning the strong start to Q4 earnings season by US financials (Goldman Sachs, JP Morgan, Citigroup).
News & Views
First calculations by the German Federal Statistical Office (Destatis) learnt that the price adjusted gross domestic product (GDP) was 0.2% lower in 2024 than in the previous year. Ruth Rand of the Statistical office commented that "Cyclical and structural pressures stood in the way of better economic development in 2024." From the gross value added point of view, activity in the economy contracted by 0.4%, with significant differences in the performance of individual economic sectors. Gross value added in manufacturing dropped significantly (-3%) The decline in valued added in the construction industry was even more pronounced at -3.8% due to higher prices for building products and interest rates remaining high. The service sector still registered positive growth overall in 2024 (+0.8%). However, here were also significant differences between subsectors (stagnation in the likes of trade, transport, accommodation and food services, but a better performance in gross value added in the information and communication sector, +2.5%). There was a steady rise in the sectors of the economy that are closely linked to general government (1.6%). In a demand approach, gross fixed capital formation declined 2.8%. Despite higher income, household consumption only rose 0.3%. Government consumption growth was much more pronounced at 2.6%. The difficult economic climate in 2024 was also reflected in foreign trade. Exports of goods and services were down 0.8% while imports were up slightly by 0.2% on the previous year, primarily due to increased imports of services. Despite the unfavorable context, the labour market hit a new record high in 2024 with on average 46.1 million persons being employed in 2024 (+0.2% compared to 2023). The general government deficit ratio (2.6%) in a first estimate is assessed to have remained unchanged at previous year's level.
UK Inflation Lower Than Expected, Sterling Shrugs
The British pound is showing limited movement on Wednesday. In the European session, GBP/USD is currently trading at 1.2224, up 0.11%.
UK inflation softer than expected
The UK’s annual inflation rate eased slightly in December 2024, dropping to 2.5% from 2.6% in November. This was also lower than the market estimate of 2.6%, although it matched the BoE inflation forecast from November. Monthly, CPI rose 0.3% in December from 0.1% a month earlier. Core CPI fell to 3.2% y/y from 3.5% in November but the monthly rate climbed to 0.3%, up from 0% in November.
The key drivers in the drop in headline CPI were lower prices for hotels and restaurants. As well, services inflation, which is monitored carefully by the Bank of England, dropped to 4.4% in December from 5% in November. This was the lowest level since March 2022.
The inflation report was warmly received by the money markets, which increased their expectations of a BoE rate cut next in February. Currently, the money markets have priced in an 82% probability of a quarter-point hike next month and two cuts have been almost fully priced for 2025. It is also good news for the government, as borrowing costs, which have been on the rise, eased slightly following the inflation release. The increase in borrowing costs have raised the possibility that the government would fall short of its budget rules and would have to make further spending cuts.
US inflation expected to rise to 2.9%
All eyes on are on the December US CPI report, which will be released later today. Headline CPI is expected to rise 2.9% y/y, up from 2.7% in November. Monthly, headline CPI is projected to remain unchanged at 0.3%. Core CPI, which is a better gauge of inflation trends, is expected to remain unchanged at 3.3% y/y and dip to 0.2% m/m from 0.3% in November. An unexpected inflation reading could have a significant impact on the direction of the US dollar.
GBP/USD Technical
- GBP/USD is putting pressure on support at 1.2202. Below, there is support at 1.2154
- 1.2264 and 1.2312 are the next resistance lines
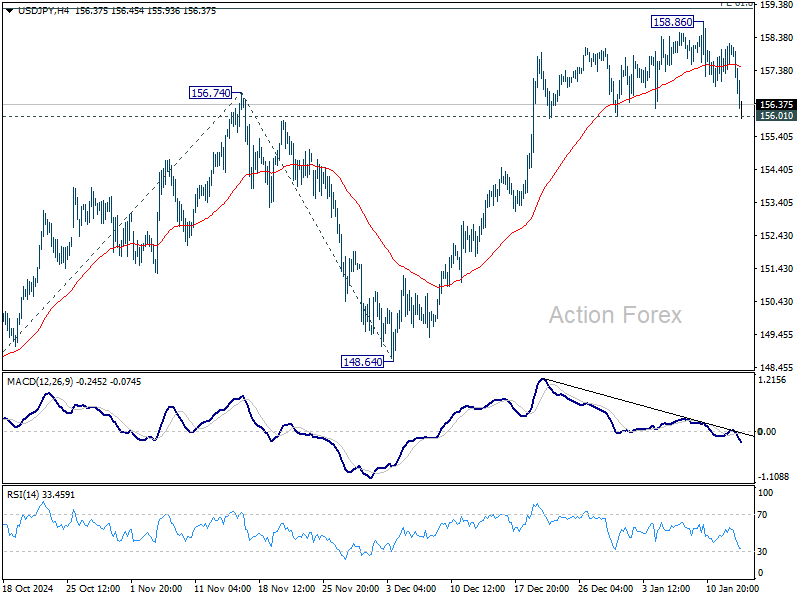
USD/JPY Mid-Day Outlook
Daily Pivots: (S1) 157.33; (P) 157.76; (R1) 158.41; More...
USD/JPY's fall from 158.86 extends lower in early US session but fails to break through 156.01 support. Intraday bias stays neutral for the moment. On the upside, decisive break of 61.8% projection of 139.57 to 156.74 from 148.64 at 159.25 will extend the rally from 139.57 to retest 161.94 high. However, considering bearish divergence condition in 4H MACD, firm break of 156.01 support will confirm short term topping. Intraday bias will then be back on the downside for 55 D EMA (now at 154.46) instead.
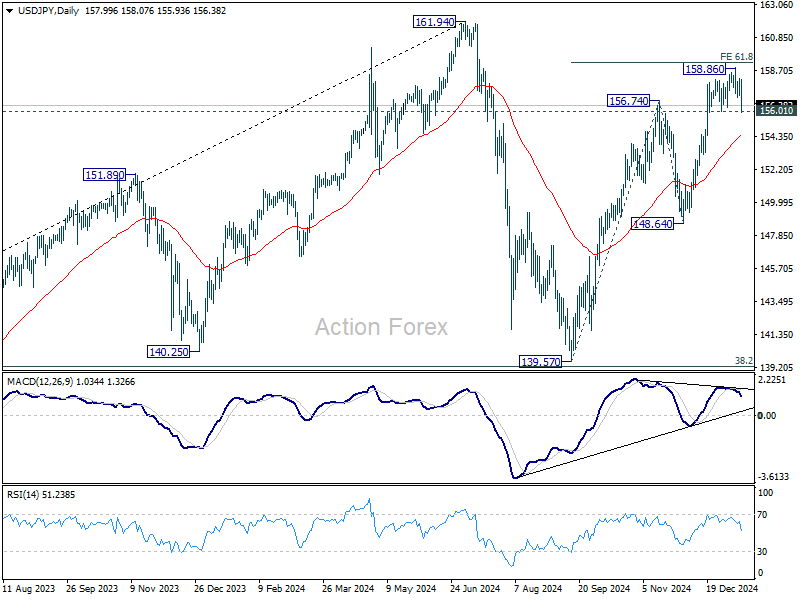
In the bigger picture, price actions from 161.94 are seen as a corrective pattern to rise from 102.58 (2021 low). The range of medium term consolidation should be set between 38.2% retracement of 102.58 to 161.94 at 139.26 and 161.94. Nevertheless, sustained break of 139.26 would open up deeper medium term decline to 61.8% retracement at 125.25.
USD/CHF Mid-Day Outlook
Daily Pivots: (S1) 0.9105; (P) 0.9141; (R1) 0.9159; More…
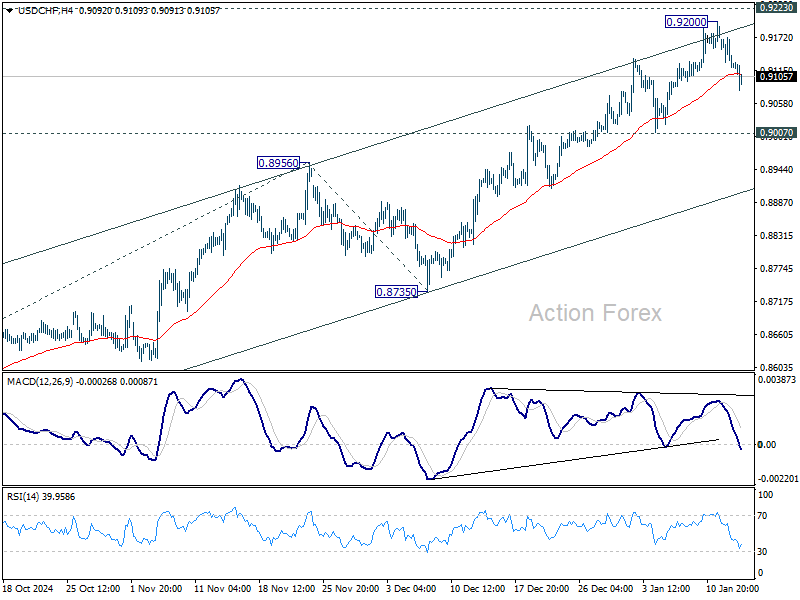
USD/CHF's retreat from 0.9200 extends lower today, but stays above 0.9007 support. Intraday bias remains neutral for the moment. Near term outlook will stay bullish. On the upside, decisive break of 0.9223 will carry larger bullish implications.
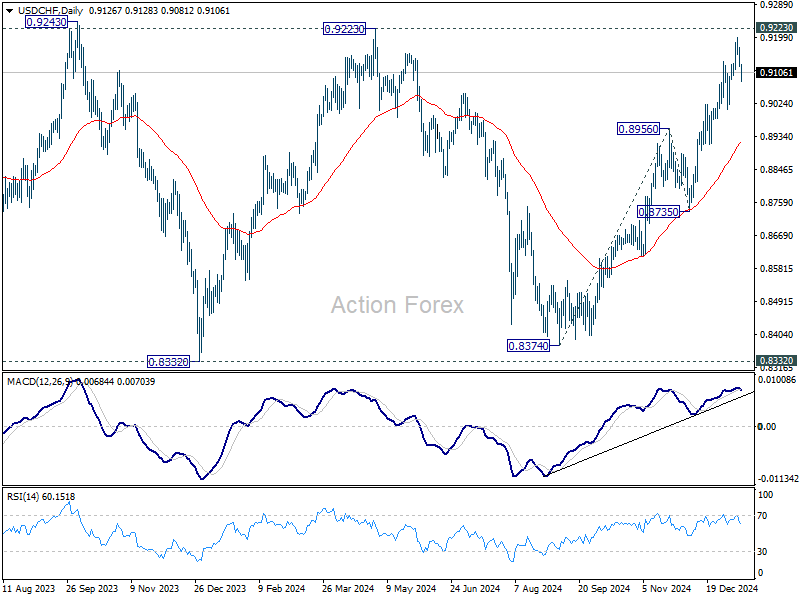
In the bigger picture, price actions from 0.8332 (2023 low) are currently seen as a medium term corrective pattern, with rise from 0.8374 as the third leg. Overall outlook will continue to stay bearish as long as 0.9223 resistance holds. Break of 0.8332 low is in favor at a later stage when the consolidation completes. However, decisive break of 0.9223 will be an important sign of bullish trend reversal.
GBP/USD Mid-Day Outlook
Daily Pivots: (S1) 1.2154; (P) 1.2202; (R1) 1.2264; More...
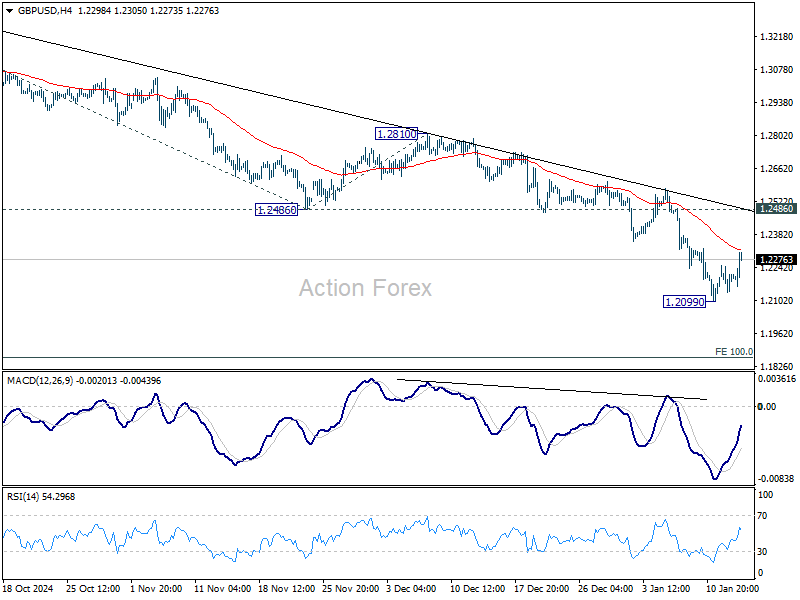
GBP/USD's recovery from 1.2099 extends higher today, but stays well below 1.2486 support turned resistance. Intraday bias remains neutral at this point. Larger fall from 1.3433 is still expected to continue. On the downside, break of 1.2099 will resume the decline to 100% projection of 1.3433 to 1.2486 from 1.2810 at 1.1863.
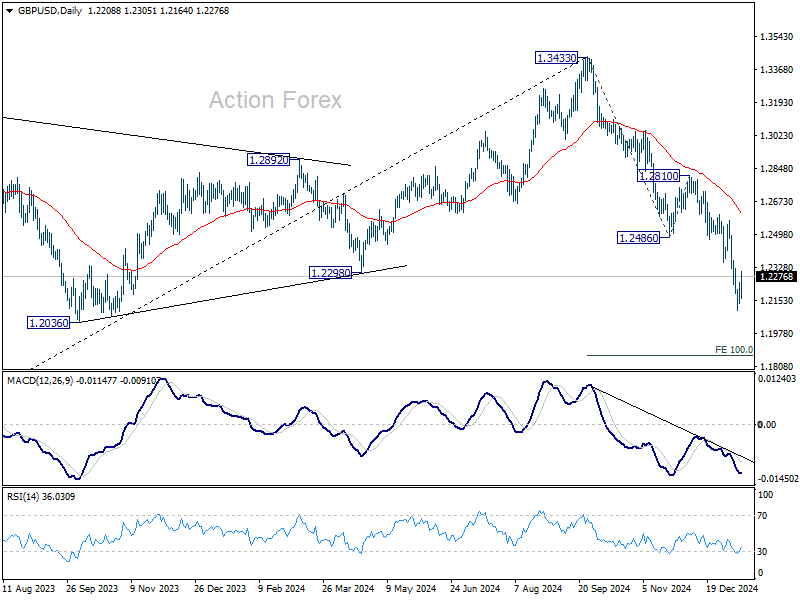
In the bigger picture, rise from 1.0351 (2022 low) should have already completed at 1.3433, and the trend has reversed. Further fall is now expected as long as 1.2810 resistance holds. Deeper decline should be seen to 61.8% retracement of 1.0351 to 1.3433 at 1.1528, even as a corrective move.
EUR/USD Mid-Day Outlook
Daily Pivots: (S1) 1.0261; (P) 1.0286; (R1) 1.0333; More...
EUR/USD's recovery from 1.0176 extends higher today but stays below 1.0435 resistance. Intraday bias remains neutral while further decline is still expected. On the downside, break of 1.0176 will resume the fall from 1.1213 and target 61.8% projection of 1.1213 to 1.0330 from 1.0629 at 1.0083. However, considering bullish convergence condition in 4H MACD, firm break of 1.0435 will confirm short term bottoming, and turn bias back to the upside for stronger rebound.
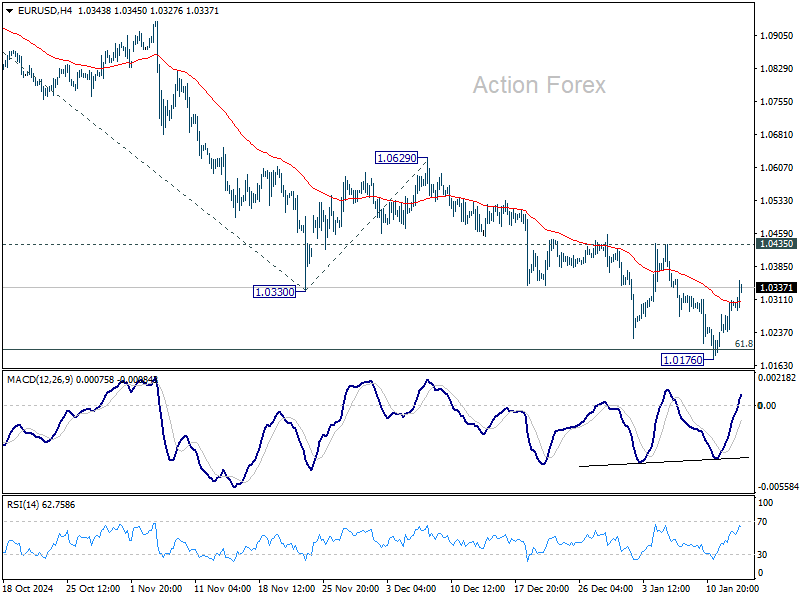
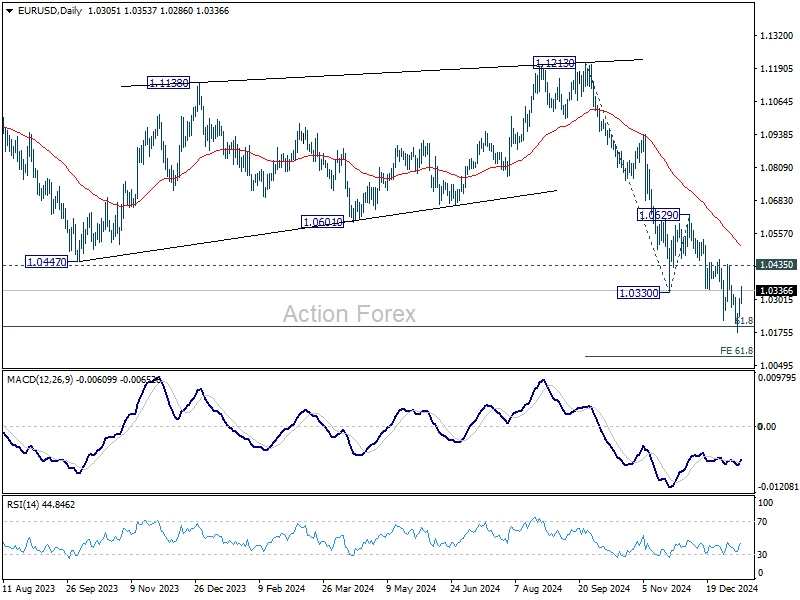
In the bigger picture, fall from 1.1274 (2023 high) should either be the second leg of the corrective pattern from 0.9534 (2022 low), or another down leg of the long term down trend. In both cases, sustained break of 61.8 retracement of 0.9534 to 1.1274 at 1.0199 will pave the way back to 0.9534. For now, outlook will stay bearish as long as 1.0629 resistance holds, even in case of strong rebound.
Dollar Weakens on Core Inflation Relief, But Bullish Bias Holds
Dollar extended its near-term pullback in early trading after core inflation data for December came in slightly below expectations, offering a degree of relief to traders and investors. Treasury yields also retreated, with the 10-year yield falling back below the 4.7% mark.
Core CPI rose by 3.2% yoy, down from 3.3%, a result that eased fears of renewed inflationary pressures forcing Fed's hand back into tightening. While core inflation remains clearly elevated, the data at least suggests that pressures are not intensifying enough to alter Fed’s loosening bias, with pauses in between moves.
Fed fund futures now show 97.3% chance of a hold at the January FOMC meeting, a decision that appears still firmly priced in. Meanwhile, the odds of a rate cut in May have rebounded to 49%, up from 36% the previous day. June remains the most likely timing for a rate cut, with markets assigning nearly 70% probability. This aligns with expectations that Fed might deliver only one rate reduction in 2025.
In forex markets, Dollar is the worst performer of the day so far. Canadian Dollar and Swiss Franc also rank among the weaker currencies. On the other hand, Japanese Yen is leading gains, bolstered by comments from BoJ officials that have reintroduced the possibility of a rate hike at the January meeting. Australian Dollar and New Zealand Dollar also posted solid gains, supported by improved risk sentiment. Euro and Sterling are trading with mixed momentum in middle positions.
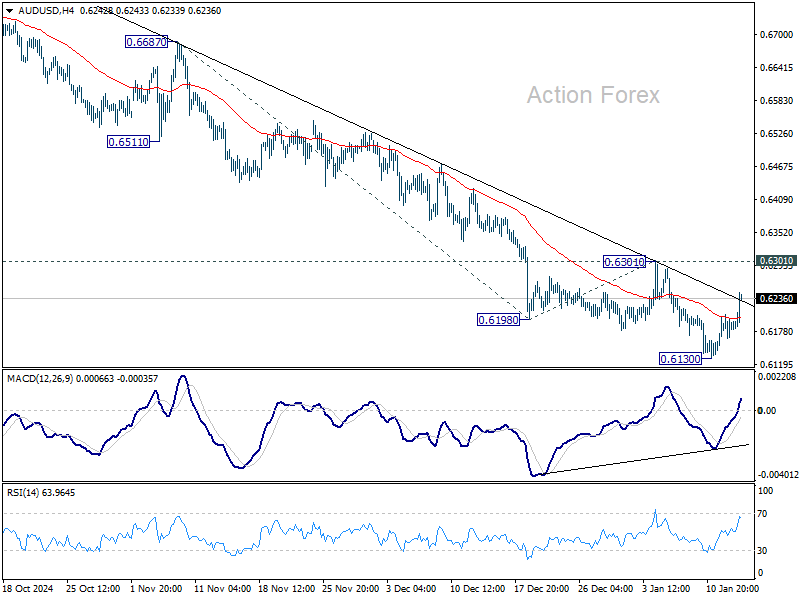
From a technical perspective, while the Dollar’s pullback has extended, it remains above key support levels against major counterparts. EUR/USD is capped below 1.0435 resistance, GBP/USD below 1.2486, AUD/USD below 0.6301, and USD/CHF above 0.9007 support. As long as these levels hold, the Dollar’s broader bullish trend remains intact, and the current movement is viewed as a consolidation phase rather than a reversal.
US CPI jumps to 2.9% in Dec, core ticks down to 3.2%
US CPI rose by 0.4% mom in December, surpassing expectations of 0.3% mom and marking an acceleration from the prior month’s 0.3% mom increase. Meanwhile, core CPI, which excludes the more volatile food and energy components, rose by a more subdued 0.2% mom, in line with market expectations but down from the 0.3% mom recorded in November.
Energy prices were the primary driver, rising 2.6% mom on the month and accounting for over 40% of the headline increase. Food prices also contributed to inflationary pressure, advancing by 0.3% mom.
On an annual basis, headline inflation climbed to 2.9% yoy, meeting consensus forecasts and up from November’s 2.7% yoy. Core inflation, however, slowed to 3.2% yoy, slightly below expectations of 3.3% yoy, indicating some easing in underlying price pressures. Notably, energy prices declined by -0.5% yoy, while food prices remained elevated at 2.5% yoy.
Eurozone industrial production rises 0.2% mom in Nov, EU up 0.1% mom
Eurozone industrial production edged up by 0.2% mom in November, falling short of 0.3% mom consensus forecast. While the overall increase suggests resilience in the industrial sector, the performance was uneven across categories. Production rose by 1.5% for durable consumer goods and 1.1% for energy, highlighting strong demand in these areas. Intermediate and capital goods also posted gains of 0.5% each, while non-durable consumer goods saw a marginal uptick of 0.1%.
Across the broader EU, industrial production grew by just 0.1% on the month. The highest monthly increases were recorded in Belgium (+8.7%), Malta (+7.1%) and Lithuania (+4.3%). The largest decreases were observed in Ireland (-5.8%), Luxembourg (-3.9%) and Portugal (-3.4%).
ECB’s Guindos and Villeroy affirm progress on disinflation
ECB Vice President Luis de Guindos highlighted today that disinflation in the Eurozone is “well on track,” reinforcing optimism about the region's progress toward price stability. While December’s inflation rose to 2.4%, Guindos noted that this increase was anticipated and aligned with ECB’s projections. Domestic inflation remains elevated, but recent easing signals have provided some relief.
Guindos cautioned, however, that risks remain high. “The high level of uncertainty calls for prudence,” he said, referencing global trade frictions that could fragment the global economy further. He also warned about the fiscal policy challenges to weigh on borrowing costs and renewed geopolitical tensions to destabilize energy markets.
Despite weak near-term economic outlook, Guindos expressed cautious optimism, stating, “The conditions are in place for growth to strengthen over the projection horizon, although less than was forecast in previous rounds.”
Meanwhile, French ECB Governing Council member François Villeroy de Galhau echoed a positive sentiment, emphasizing progress against inflation.
“We have practically won the battle against inflation,” he said, projecting that it “makes sense for interest rates to reach 2% by the summer.” However, Villeroy also highlighted risks to France’s 2025 growth forecast of 0.9%, acknowledging that while downside risks persist, a recession remains unlikely.
ECB’s Lane expects service inflation to ease
ECB Chief Economist Philip Lane noted during an event today that services inflation will "come down quite a bit" in the coming months. He attributed much of the anticipated moderation to a slowdown in wage growth. Additionally, firms are reportedly experiencing reduced cost pressures, which should also contribute to easing price increases.
Lane highlighted the challenges of providing a definitive future path for interest rates, citing significant uncertainties in the global economic environment, including escalating trade tensions.
"From our point of view, saying here's where we think the future rate path is going to be conveys a sense of certainty that we don't feel," Lane said, reinforcing the ECB's cautious stance.
On the topic of exchange rates and their influence on prices, Lane pointed out that while movements in the euro-dollar exchange rate can impact European prices over time, the short-term relationship is less predictable. He noted that in the early stages of a significant currency shift, much of the impact is "absorbed by firms.
“The exchange rate, I think, over time plays a role,” Lane said. “But in terms of the month-by-month, quarter-by-quarter correlation between the exchange rate and import prices is not that stable.”
UK CPI slows to 2.5% in Dec, services inflation down to 4.4%
UK CPI slowed from 2.6% yoy to 2.5% yoy in December, below expectation of 2.7% yoy. Core CPI slowed from 3.5% yoy to 3.2% yoy, below expectation of 3.4% yoy.
CPI goods annual rate rose from 0.4% yoy to 0.7% yoy, while CPI services annual rate fell from 5.0% yoy to 4.4% yoy.
On a monthly basis, CPI rose by 0.3% mom, below expectation of 0.4% mom.
BoJ’s Ueda signals rate hike on the table next week
BoJ Governor Kazuo Ueda today provided further hints that the central bank may be considering a rate hike at its upcoming policy meeting.
Ueda noted, “We are currently analyzing data thoroughly and will compile the findings in our quarterly outlook report. Based on that, we will discuss whether to raise interest rates at next week's policy meeting and would like to reach a decision.”
Ueda emphasized the significance of Japan's wage outlook, which has recently been a key focus for policymakers. He pointed to encouraging signals from wage negotiations, which could bolster consumer spending and support BoJ's inflation target.
Additionally, Ueda remarked that the economic policies of the incoming US administration, coupled with domestic wage trends, would play a pivotal role in determining the timing of any rate adjustment.
The governor's remarks align closely with those of BoJ Deputy Governor Ryozo Himino, who earlier this week suggested that a rate hike was on the table.
EUR/USD Mid-Day Outlook
Daily Pivots: (S1) 1.0261; (P) 1.0286; (R1) 1.0333; More...
EUR/USD's recovery from 1.0176 extends higher today but stays below 1.0435 resistance. Intraday bias remains neutral while further decline is still expected. On the downside, break of 1.0176 will resume the fall from 1.1213 and target 61.8% projection of 1.1213 to 1.0330 from 1.0629 at 1.0083. However, considering bullish convergence condition in 4H MACD, firm break of 1.0435 will confirm short term bottoming, and turn bias back to the upside for stronger rebound.
In the bigger picture, fall from 1.1274 (2023 high) should either be the second leg of the corrective pattern from 0.9534 (2022 low), or another down leg of the long term down trend. In both cases, sustained break of 61.8 retracement of 0.9534 to 1.1274 at 1.0199 will pave the way back to 0.9534. For now, outlook will stay bearish as long as 1.0629 resistance holds, even in case of strong rebound.
US CPI jumps to 2.9% in Dec, core ticks down to 3.2%
US CPI rose by 0.4% mom in December, surpassing expectations of 0.3% mom and marking an acceleration from the prior month’s 0.3% mom increase. Meanwhile, core CPI, which excludes the more volatile food and energy components, rose by a more subdued 0.2% mom, in line with market expectations but down from the 0.3% mom recorded in November.
Energy prices were the primary driver, rising 2.6% mom on the month and accounting for over 40% of the headline increase. Food prices also contributed to inflationary pressure, advancing by 0.3% mom.
On an annual basis, headline inflation climbed to 2.9% yoy, meeting consensus forecasts and up from November’s 2.7% yoy. Core inflation, however, slowed to 3.2% yoy, slightly below expectations of 3.3% yoy, indicating some easing in underlying price pressures. Notably, energy prices declined by -0.5% yoy, while food prices remained elevated at 2.5% yoy.
USD/JPY at a Crossroads Ahead of US CPI Inflation
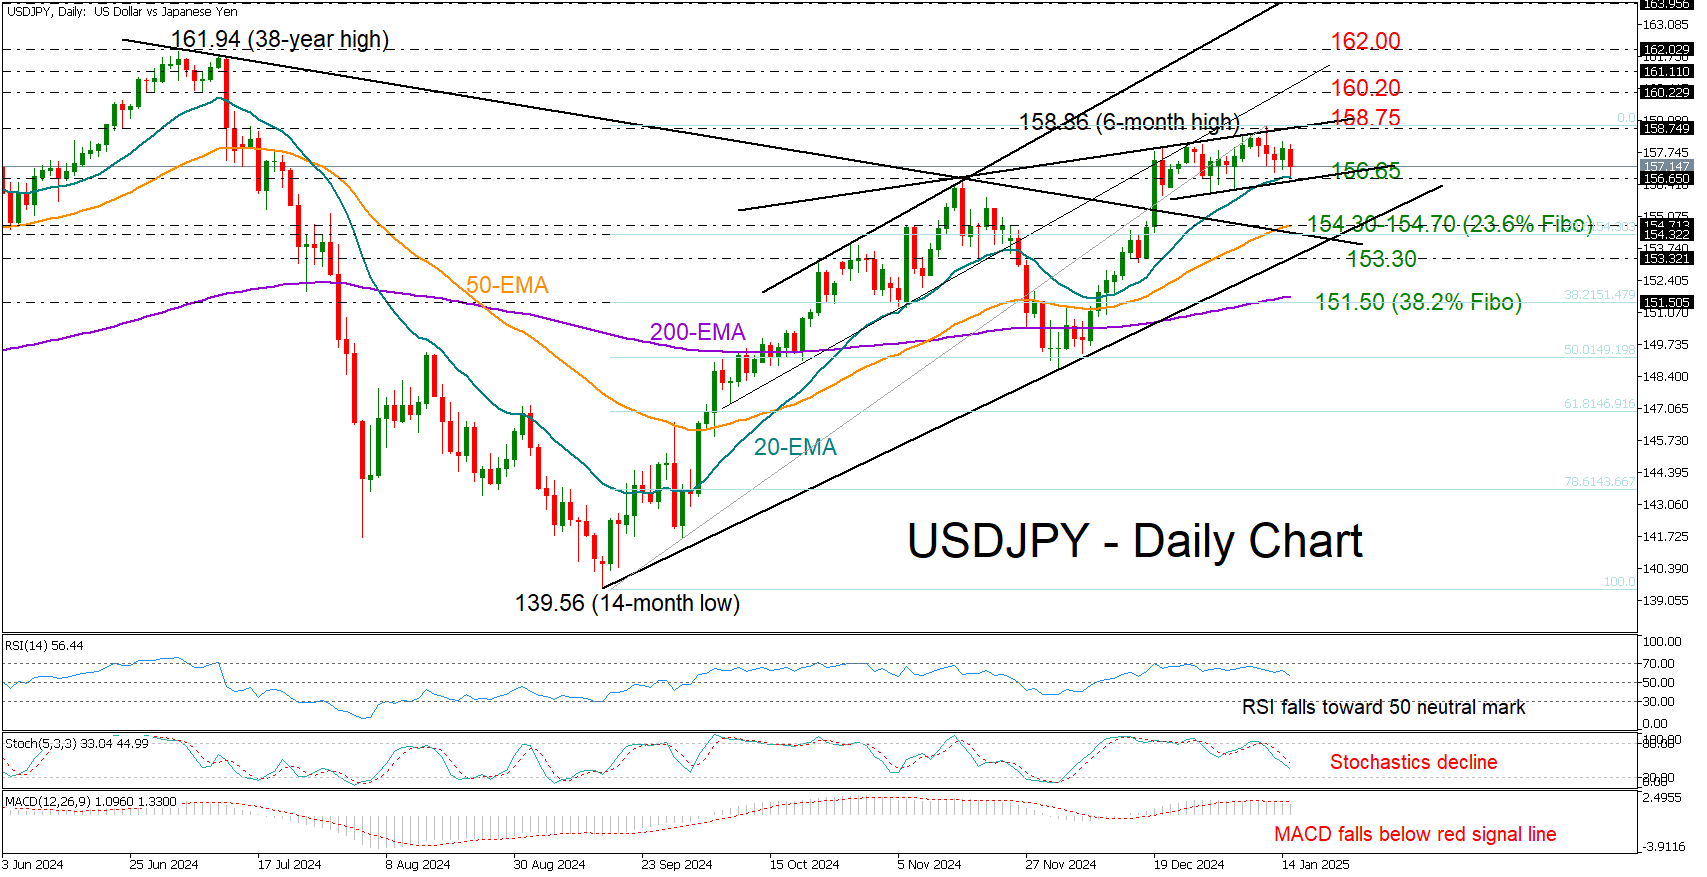
- USDJPY slips toward key support region of 156.65.
- Technical signs reflect falling buying appetite.
- US CPI inflation figures due for release at 13:30 GMT.
USDJPY is feeling the heat again after its soft upturn on Tuesday couldn’t surpass the 158.00 level, and with the US CPI inflation figures coming up later in the day, things could get interesting.
The pair pulled lower and is currently trading slightly above its 20-day exponential moving average (EMA) and the lower boundary of a short-term bullish channel, both seen around 156.65. If that base cracks, the bears could forcefully squeeze the price toward the 154.30-154.70 zone formed by the 50-day EMA and the broken resistance trendline drawn from July’s top. The 23.6% Fibonacci retracement of the latest uptrend is adding extra credence to this region, though a break below the tentative support trendline at 153.30 could be a bigger concern for the bulls. In fact, it could cause another steep downfall toward the 200-day EMA and the 38.2% Fibonacci mark of 151.50.
According to the falling technical indicators, the risk is skewed to the downside, though if the 156.65 floor stands firm, the bulls may stage another battle within the 158.00-158.75 zone. A victory there would brighten the outlook, likely fueling more buying toward the 160.20 number, and then if the 161.00 mark proves easy to pierce, the focus could turn to the 162.00 area.
In brief, the upward trend in USDJPY seems to be losing power, with sellers eyeing the 156.65 region for more downside. Yet, a real bearish signal could come once below 153.30.