
Sample Category Title
Optimism Returns on Supportive Data
Yesterday offered an almost ideal news flow for global investors. First, the British inflation came in softer than expected. The most-watched services inflation eased from 5% to 4.4% last month, to the lowest since March 2022, and led to a much-needed relief in the UK gilt markets. The 10-year gilt yield gapped lower at the start of the session and eased about 20bp compared to the day before, Cable rebounded on the bond relief and FTSE 100 rallied more than 1% on expectation that the Bank of England (BoE) could cut rates twice this year.
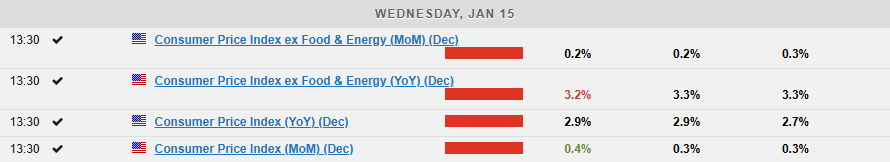
Then, the US took over and announced a set of softer-than-expected inflation figures, as well Headline inflation in the US rebounded from 2.7% to 2.9% as expected in December, but core inflation eased unexpectedly from 3.3% to 3.2%. The cherry on top: the Empire State Manufacturing Index unexpectedly plunged in January, offering some relief to the Federal Reserve (Fed) doves which spent the first weeks of the new year watching the dream of rate cuts sailing away. Yesterday’s data brought rate cut expectations back on the table. The US 2-year yield plunged more than 10bp to below 4.30% and the US 10-year yield dived up to 15bp to 4.65%. Activity on Fed funds futures now hints that the Fed’s next rate cut could arrive in May -and not June - and that’s a blast for the equity markets which also benefited from a set of strong earnings from the big US banks. Together, the four big banks that released earnings yesterday – JP Morgan, Wells Fargo, GS, and Citigroup – printed more than $100bn profit last year, the second highest yearly profit ever. JP Morgan alone topped a $50bn annual profit mark thanks to exceptional jump in profits boosted by election volatility in Q4, Wells Fargo announced a 12% cut in expenses, Goldman’s Q4 profit doubled compared to a year ago, while Citigroup gained investors’ heart yesterday with the announcement of a $20bn stock buyback. All in all, Invesco’s bank ETF jumped more than 4% yesterday. More big banks will be releasing earnings today.
Zooming out, the S&P500 gained more than 1.80% on the back of softer-than-expected inflation data and better-than-expected bank earnings. The Magnificent 7 rallied more than 3.50% despite discouraging news of more export curbs for chip companies, the Stoxx 600 index traded past its 200-DMA, crude oil rallied above the $80pb despite the ceasefire agreement in Gaza and the US dollar gave back gains.
But the USD is stronger before the December retail sales data – which could confirm the strength of US consumer spending and counter a part of yesterday’s inflation optimism. Don’t forget that the core inflation in the US is still above the 3% mark - well above the Fed’s 2% target and hardly coming lower - and the trade war between the US and China is about to spread to the rest of the world. Even though Trump’s new team is aiming to raise tariffs gradually, a 10% universal tariff and a 60% tariff for China would amount in an average tariff of 17% according to Barclays and could only raise pressure on consumer prices in the US.
Some bad news
German economy shrank for the second consecutive year for the first time since the beginning of 2000s and given the actual state of things, Germany is not expected to do much better this year. The latter weakness is maintaining the hope that the European Central Bank (ECB) will give an ample support to the weakening European economies this year and helps explaining why the DAX index hit a fresh record high yesterday despite the bad news, but the EURUSD is having hard time maintaining its advance above the 1.03 mark. The fact that a broadly softer US dollar on soft inflation couldn’t help to reverse losses confirms that the bearish tide is relatively strong. The EURGBP hit the high mark of the downtrending channel at 0.8463 yesterday, however, as sterling remains under a stronger downside pressure due to British debt headaches.
Sterling bulls and bears are still struggling to take the lead around the 1.22 against the US dollar. The expectations that the BoE could cut its rates twice this year gives relief to the gilt market, hence decreases the need for more concessions on spending plans and improves UK’s growth outlook. But that’s a meagre improvement, mind you: this morning's GDP update came in lower than expected for November, keeping the outlook for sterling firmly in the bearish camp.
Elsewhere, the USDJPY took a decent dive yesterday and tipped a toe below the 156 level on the back of a broadly softer US dollar and a strong rebound in the Japanese yen on raising expectation that the Bank of Japan (BoJ) could announce a rate hike as early as next week. If the BoJ hikes next week, the USDJPY could return below its 200-DMA sustainably and test the major 38.2% Fibonacci support on the September to January rebound, near 151.15 level. A slide below that level would indicate a medium-term bearish reversal for the pair.
In energy, the fact that crude oil is now trading near the $80pb raises a few questions. The latest rally was led by geopolitical factors and brought the IEA to revise its surplus forecast lower this year. The prospects of rate cuts are also supportive of demand outlook, but for now, the gains are supported by the supply-side news, hence remain vulnerable. I expect to see increased incentive to sell the top near the $80pb level and expect support near the $75/77pb range.
Israel-Gaza Ceasefire After 15-Months
In focus today
From the US, initial jobless claims and retail sales will provide markets with evidence of the health of US consumers and unemployment. For initial jobless claims consensus expects an increase of 210k (prior: 201k) and for December retail sales consensus expects 0.6% m/m (prior: 0.7%).
The ECB will release the records of its latest meeting from 11-12 December at 13.30 CET.
Economic and market news
What happened overnight
Israel-Gaza ceasefire: Gaza ceasefire has been announced after 15 months of conflict. Negotiations have led to a structured agreement to bring an end to the war in Gaza. The ceasefire is set to commence on 19 January. The agreement outlines an initial six-week ceasefire period, including the withdrawal of Israeli forces from the Gaza strip, the release of hostages, and the return of displaced Palestinians.
Trump's promises of ceasefire in Ukraine on his first day in office is under pressure. Trump's advisors now acknowledge that resolving the Ukraine conflict will take months or even longer, providing a sharp reality check on Trump's major foreign policy promise. The promise of facilitating a deal within 24 hours was always unrealistic, and it appears that the complexity of the conflict is now being recognized.
What happened yesterday
In the US, December CPI were close to expectations, with details continuing to show easing underlying inflation. Headline inflation was +0.39% m/m s.a. (cons: +0.3%), while core inflation slowed to +0.23% m/m s.a. (cons: +0.2%), both close to consensus. The rise in headline inflation was driven by energy prices, while core inflation details were encouraging. Shelter inflation slowed after November's hotel price surge, and both rental and owner-occupied housing inflation are cooling. Non-housing services inflation slightly increased. Core goods and health care prices also eased core inflation. Despite market concerns about rising inflation, the data shows nothing to support these fears. Consequently, bond yields dropped, and EUR/USD rose after the release.
In the UK, inflation for December surprised significantly to the downside with headline at 2.5% y/y (cons: 2.6%, prior: 2.6%), core at 3.2% y/y (cons: 3.4%, prior: 3.5%) and services at 4.4% y/y (cons: 4.8%, prior: 5.0%). While the downside surprise was broad-based, air fares drove a large part of the downside surprise. Services, which is by far the most important component for the Bank of England, came in lower than the BoE's expectation of 4.7%. Likewise, our measure of core services, which excludes volatile components such as air fares, continues to decline and shows easing momentum, which is good news for the BoE. With the lower-than-expected US inflation data out later in the afternoon this offered some much-needed relief to UK markets after the recent sell-off.
In Germany, GDP for 2024 contracted by 0.2% y/y (prior: -0.3%), highlighting one of the country's most prolonged economic crises in decades, just six weeks ahead of a crucial snap election. The very early estimate of GDP growth in Q4 2024 was -0.1% q/q, though this estimate carries higher uncertainty due to incomplete data. Nonetheless, the decline aligns with our growth expectations and is not as severe as feared, given the negative economic sentiment.
In Sweden, final December core inflation, CPIF excl. energy, was 0.1 p.p below the preliminary number, at +0.3% m/m and 2.0% y/y, a slight downside surprise. This may widen the spreads to Riksbank's forecast going into January. Also, Origo Group is the new vendor managing the collection of inflation expectations from January 2025 and onwards, previously this was done by Prospera (Kantar). The shift might cause disruptions but there are no strong reasons to assume so. Hence, we expect only marginal adjustments relative to the December survey which showed expectations close to or below the inflation target.
Equities: Global equities rose yesterday, with optimism boosted by a lower-than-expected core CPI number from the US. Consequently, we observed indices closing at or around daily highs, and for several indices, it was the best day since the post-US election surge. Not surprisingly, cyclicals, especially US cyclicals, led the advances. However, the magnitude of the outperformance of cyclicals was somewhat surprising even to us. This, if anything, underscores our view that cyclicals will continue to outperform as long as the macroeconomic environment remains positive, despite trading at the highest premium to defensives in over 15 years. In the US yesterday, the Dow increased by 1.7%, the S&P 500 by 1.8%, the Nasdaq by 2.5%, and the Russell 2000 by 2.0%. Asian markets are catching up this morning, reflecting the strong performance in the Western world yesterday. Meanwhile, US and European futures are more mixed this morning.
FI: US rates rallied on the back of the US CPI release yesterday coming in less hot than expected by consensus. The 5-10y area led the way with a 15bp rally, with the wings down "only" by 10bp. 10y German Bunds ended 6bp lower, with ECB pricing now at -96bp. Also, Gilts rallied following the UK CPI release in the morning.
FX: Yesterday's session was dominated by first the relief in UK markets and later the US CPI induced rally in risk appetite which aided risk-sensitive currencies such as AUD and NOK while the drop in global yields sent the JPY soaring. While the USD initially weakened, we have since seen a slight comeback which has also contributed to a rebound in USD/JPY from below 155.50 to now 160.00. While EUR/GBP dropped in yesterday's session the cross is still trading north of 0.84.
Bitcoin Bulls Face Obstacles: Can They Reclaim $100K?
Key Highlights
- Bitcoin price found support at $90,000 and started a recovery wave.
- BTC cleared a declining channel with resistance at $94,800 on the 4-hour chart.
- Ethereum price is struggling to stay above the $3,000 support zone.
- Gold might continue to rise toward the $2,720 zone.
Bitcoin Price Technical Analysis
Bitcoin price found support and started a fresh recovery above $92,000. BTC/USD climbed above the $92,500 and $93,500 levels to move into a short-term bullish zone.
Looking at the 4-hour chart, the price cleared a declining channel with resistance at $94,800. There was a move above the 50% Fib retracement level of the downward move from the $102,718 swing high to the $89,108 low.
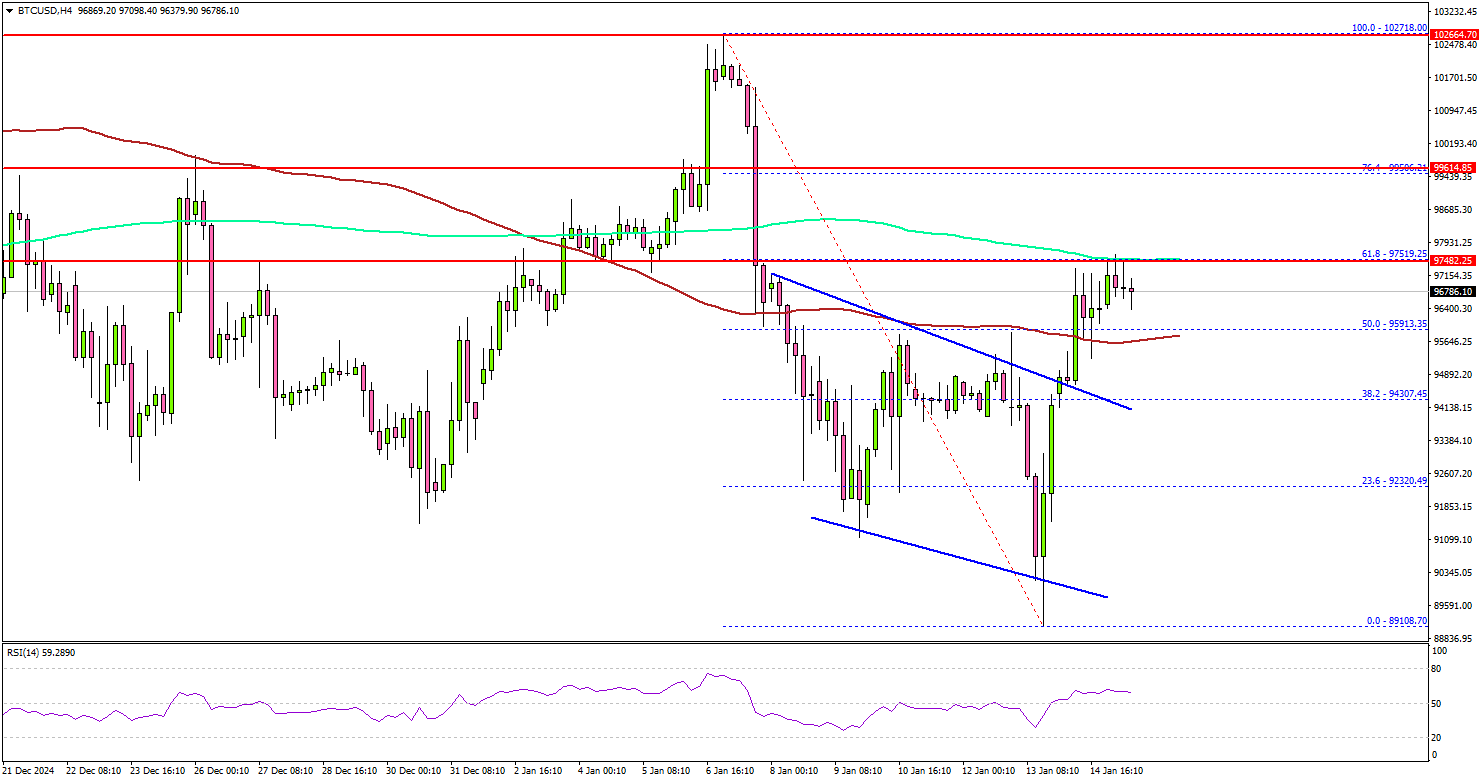
BTC even cleared the 100 simple moving average (red, 4-hour) and tested the 200 simple moving average (green, 4-hour). It faced hurdles near the $97,500 level.
The 61.8% Fib retracement level of the downward move from the $102,718 swing high to the $89,108 low acted as a resistance. On the upside, the price could face resistance near the $97,500 level. The next key resistance is $100,000.
A successful close above $100,000 might start another steady increase. In the stated case, the price may perhaps rise toward the $102,500 level.
Immediate support is near the $95,850 level. The next key support sits at $94,300. A downside break below $94,300 might send Bitcoin toward the $92,500 support. Any more losses might send the price toward the $90,000 support zone.
Looking at Ethereum, the bulls protected the $3,000 support zone and the price is now attempting a recovery wave above $3,120.
Today’s Economic Releases
- US Initial Jobless Claims - Forecast 210K, versus 201K previous.
- US Retail Sales for Dec 2024 (MoM) – Forecast +0.6%, versus +0.7% previous.
Elliott Wave View: Oil (CL_F) Impulsive Rally in Progress
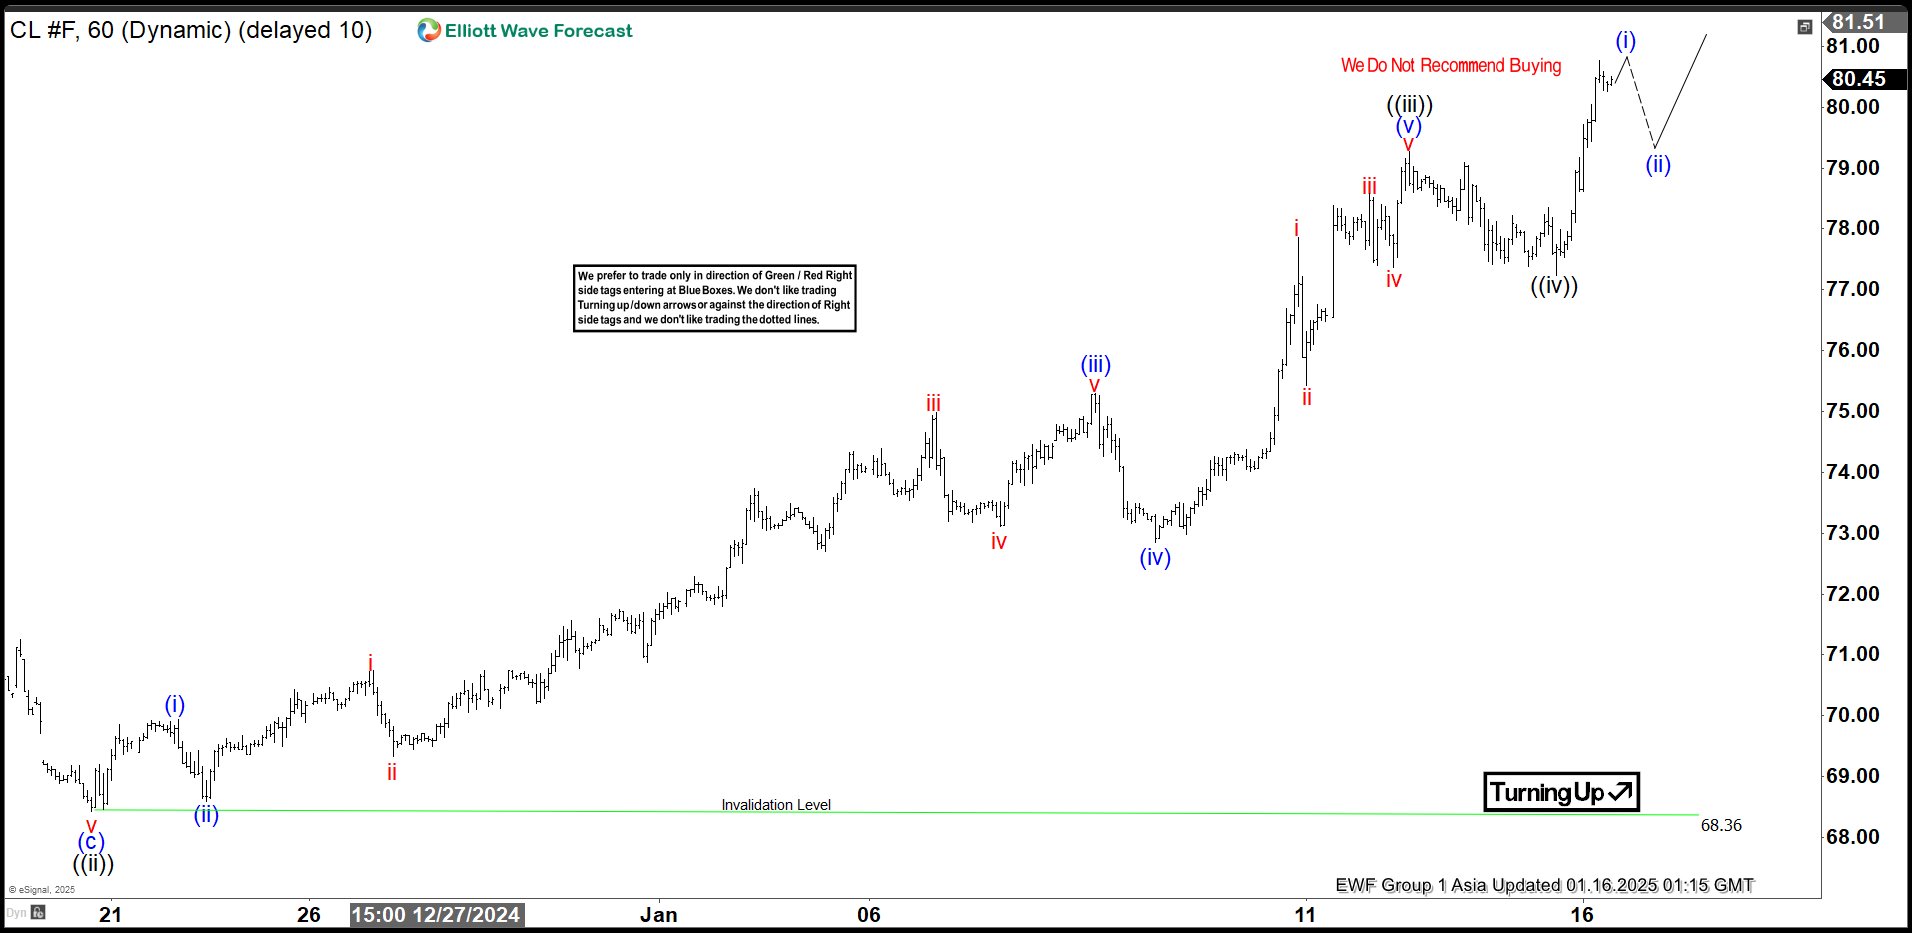
Short Term Elliott Wave view in Light Crude Oil (CL_F) suggests cycle from 12.6.2024 low is in progress as an impulse. Up from 12.6.2024 low, wave ((i)) ended at 71.44. Pullback in wave ((ii)) ended at 68.42 as the 1 hour chart below shows. The instrument extends higher in wave ((iii)) with subdivision of an impulse in lesser degree. Up from wave ((ii)), wave (i) ended at 69.94 and wave (ii) ended at 68.59.
Wave (iii) higher ended at 75.29 and pullback in wave (iv) ended at 72.84. Final leg wave (v) ended at 79.27 and this completed wave ((iii)) in higher degree. From there, the instrument pullback in wave ((iv)) which ended at 77.24. Wave ((v)) higher is in progress and wave (i) of ((v)) should end soon. It should then pullback in wave (ii) to correct the rally from 77.24 low before extending higher again. Near term, as far as pivot at 68.36 low stays intact, expect pullback to find support in 3, 7, 11 swing for further upside. Once wave ((v)) is complete, the instrument should correct cycle from 12.6.2024 low in 3, 7, or 11 swing before it turns higher again.
Oil (CL_F) 60 Minutes Elliott Wave Chart
CL_F Elliott Wave Video
https://www.youtube.com/watch?v=wKGzJoQRng8
Fed’s Williams highlights uncertainty tied to fiscal, trade, and regulatory Policies
New York Fed President John Williams said today that monetary policy remains "well-positioned" to balance Fed’s dual mandate of stable prices and maximum employment. He noted that the process of disinflation is expected to persist, though achieving the 2% target may take time, with a return to the goal likely “in the coming years.” The pace and direction of monetary policy, however, remain highly data-dependent
Williams highlighted significant uncertainties clouding the economic outlook, including risks related to fiscal policies, trade dynamics, immigration changes, and regulatory shifts.
Therefore, "our decisions on future monetary policy actions will continue to be based on the totality of the data, the evolution of the economic outlook, and the risks to achieving our dual mandate goals," he added.
Separately, Richmond Fed President Thomas Barkin commented on the December CPI report released today, acknowledging that it reinforces the narrative of inflation gradually declining toward Fed’s target. Barkin also downplayed the potential impact of rising 10-year Treasury yields on the Fed’s monetary policy stance.
EURUSD Wave Analysis
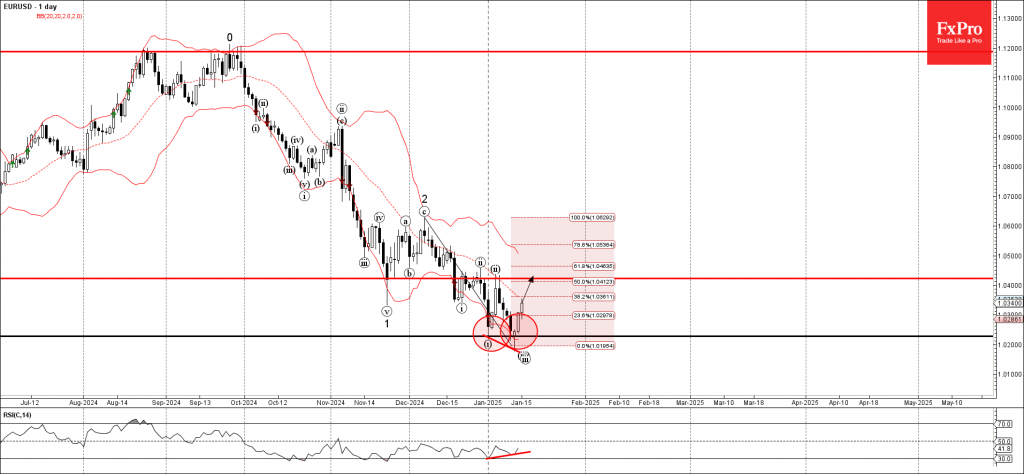
- EURUSD reversed from key support level 1.0225
- Likely to rise to resistance level 1.0425
EURUSD currency pair recently reversed up with the daily Japanese candlesticks reversal pattern Morning Star (with the daily Hammer in its middle) from the key support level 1.0225, which stopped the previous impulse wave i at the end of December.
The upward reversal from the support level 1.0225 started the active short-term correction iv, which belongs to the downward impulse wave 3 from last month.
Given the bullish divergence on the daily RSI indicator, EURUSD currency pair can be expected to rise to the next resistance level 1.0425, which stopped the previous waves ii and (ii).
EURGBP Wave Analysis
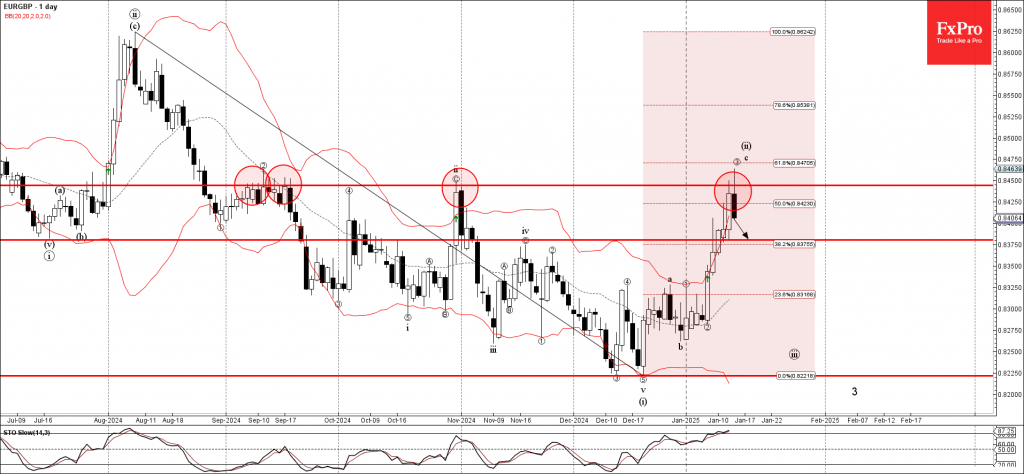
- EURGBP reversed from multi-month resistance level 0.8445
- Likely to fall to support level 0.8380
EURGBP currency pair recently reversed down from the strong multi-month resistance level 0.8445, which has been steadily reversing the price from the start of September, as can be seen below.
The resistance level 0.8445 was further strengthened by the upper daily Bollinger Band and by the nearby 61.8% Fibonacci correction of the downtrend from the start of August.
Given the overbought daily Stochastic, EURGBP currency pair can be expected to fall to the next support level 0.8380.
Gold Cycle Since September 2022 Low Calling For More Upside
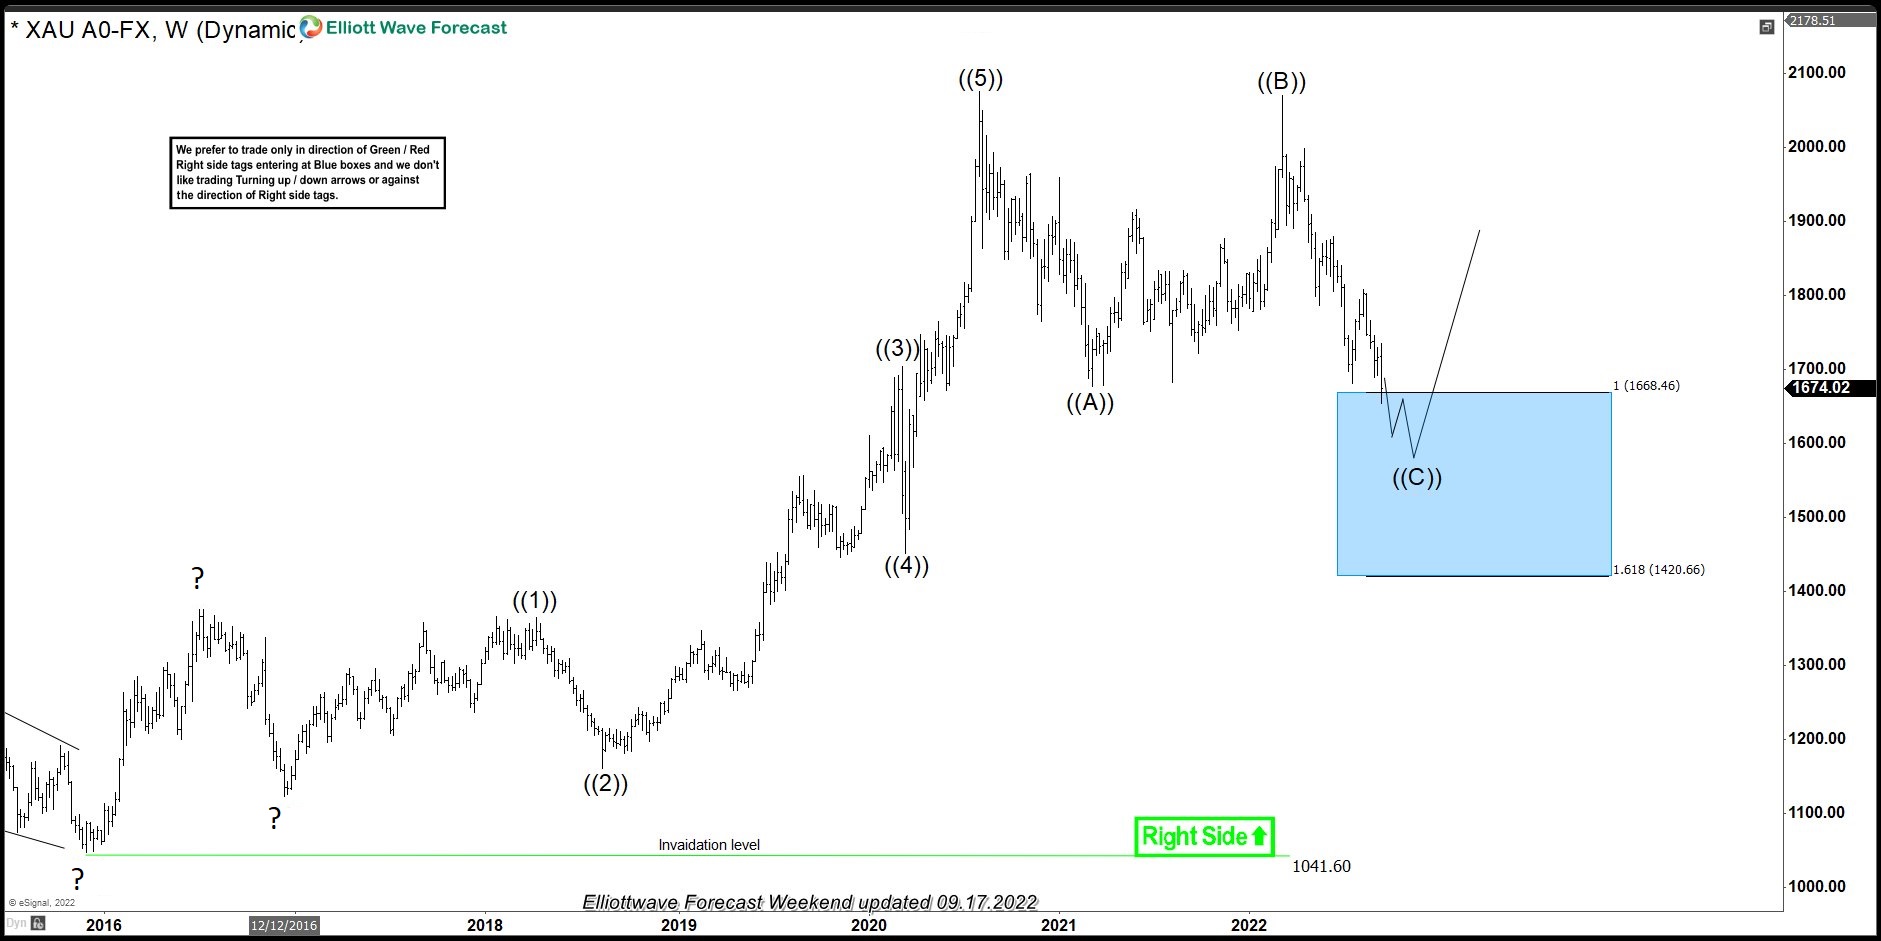
More than two years back, we were calling Gold to end a Zigzag Elliott Wave correction in the blue box area and resume the rally. Zigzag is a 5-3-5 Elliott wave structure in which wave A and C are in 5 waves and wave B is in 3 waves. Blue Boxes are High-Frequency areas and are based in a relationship of sequences, cycles and calculated using Fibonacci extensions. We refer to them as High Frequency trading areas, mainly because at Blue Boxes majority of the times, both buyers and sellers agree in the direction of the next moves and, hence why they present high probability and low-risk opportunities to enter the market in the direction of the trend. Let’s take a look at the weekly Elliott wave chart of Gold from September 2022.
Gold Weekly Chart September 2022
Gold cycle from 2015 low ended at $2075.14 on 08.03.2020 high. Following this peak, $XAUUSD started a pullback which lasted more than two years. Back in September 2022 (as shown in the chart above), we expected the yellow metal pullback to complete in the blue box area between $1668.46 – $1420.66 and rally to resume for a new high above 08.03.2020 high or for a three waves reaction higher at least. $1420.66 being the 161.8% Fibonacci extension of (( A )) related to (( B )) was the invalidation level which we expected to hold.
Gold Weekly Chart January 2025
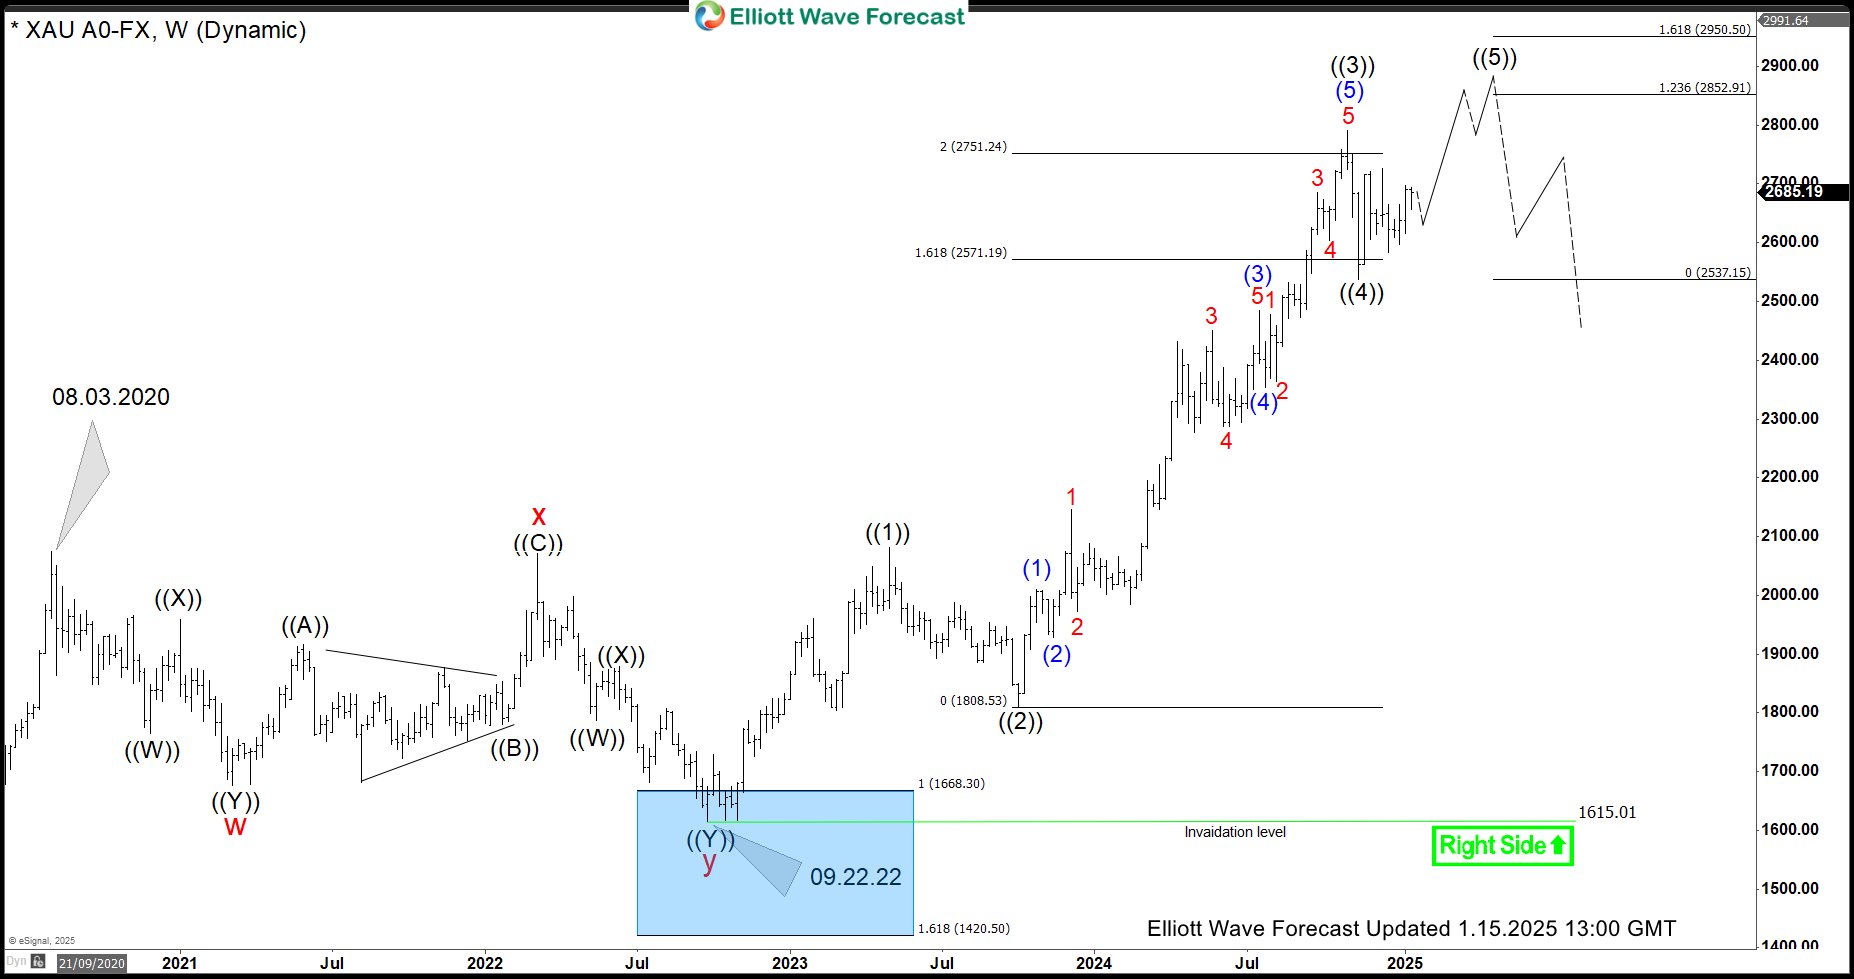
Gold buyers indeed appeared in the blue box as expected and it started a rally which has lasted 27 months but is still not over yet. Blue box low was seen on 09.22.2022 at $1615.01 and since then we see Gold rally to be in fifteen (15) swings. Gold made a new all-time high, rally is extended as third wave went past 161.8 Fibonacci extension of wave (( 1 )) related to wave ((2)) but we still expect more upside because fifteen (15) is part of a corrective sequence and we need at least 1 more high to make it seventeen (17) swings and hence complete the cycle since 09.22.2022 low. As dips hold above wave (( 4 )) low at $2536.89, we are expecting more upside in Gold toward $2852.91 – $2950.50 area to complete wave ((5)). Following this, there should be a larger 3 waves pull back to correct the cycle from 09.22.2022 low. In the unlikely event of a break below $2536.89, Gold should still be in wave ((4)) and can see a test of $2474.41 – $2318.80 area before it turns higher in wave ((5)).
Bitcoin (BTC/USD) vs. Nasdaq: Is the Correlation Affecting Crypto Outflows?
- Bitcoin has recovered from a sharp selloff earlier in the week, rising from around 89000 to nearly 98500 post CPI.
- ETF flow data shows three consecutive days of net outflows for Bitcoin as correlation with Nasdaq grows.
- Could a Trump Presidency lead to significant capital inflow into Bitcoin in 2025?
- Technically, Bitcoin is at a critical juncture breaking the 50-day moving average and eyeing the 100k handle.
Bitcoin has staged an impressive recovery since Monday afternoon lows around the 89000 mark. Cryptocurrencies were also affected by US jobs data ahead of the weekend and the stronger US Dollar early on Monday was in part responsible for the sharp selloff.
The recovery has been swift however with Bitcoin rising from a Monday low of around 89000 to end the day just shy of the 95000 handle. Yesterday the worlds largest Crypto by market cap edged above the key 95000 handle to trade at a high of 97339 (helped by softer than expected US PPI data) before facing some resistance by the 50-day MA.
Let us take a look at the performance of the Crypto market for the day.
Crypto Heatmap (post CPI), January 15, 2025

Source: TradingView (click to enlarge)
ETF Flow Data Shows 3 Successive Days of Outflows
Looking at ETF flow data courtesy of Farside investors, Bitcoin has recorded three consecutive days of net outflows with the largest being on Monday. Bitcoin started the week recording $284.1m of net outflows and followed that up with outflows totaling $209.8m yesterday.
It will be interesting to gauge whether ETF flows turn positive again ahead of the Trump inauguration next week.

Source: Farside Investors (click to enlarge)
There could be a host of reasons for this but one which has gained traction this week stems from a report showing the increase in correlation between US indices (particularly Nas100) and Bitcoin.
K33 Research Report – Nasdaq vs Bitcoin Correlation
K33 Research’s latest “Ahead of the Curve” report highlights that the crypto market is facing the same challenges affecting global markets. Over the past month, Bitcoin (BTC) and the Nasdaq have become more closely linked, with their current 30-day connection reaching its highest point in 2024.
According to K33’s analyst, Trump is expected to push for policies that grow the economy, extend the 2017 tax cuts, and provide more tax breaks for working-class Americans. These actions could be positive for riskier investments like crypto. The analyst also noted that Trump is likely to introduce crypto-friendly policies, which could benefit the crypto market.
Such data may be contributing to ETF outflows as institutional investors looked at Bitcoin as a sort of portfolio hedge providing diversification. However if the correlation with US stocks continues this could result in allocations for equities and Bitcoin being split rather than having their own allocations.
In an interview with Bloomberg on Tuesday, VanEck’s CEO, Jan van Eck stated that ‘it is disappointing to note the correlation between Bitcoin and Nasdaq over the past 6 months. Mr van Eck went further by saying that many people are looking at Bitcoin for the first time which is not what you want (referring to the growing correlation). If you look at the ten-year correlations, they are almost zero, which is really what diversification should be. We’ll have to see how Bitcoin performs going forward.’
Such comments tend to support the idea that the higher the correlation between the Nasdaq and Bitcoin, the greater the chance that outflows may increase due to portfolio diversification and positioning.
Trump Inauguration to Fuel Crypto Rally?
As you can see from the K33 research report above, there is optimism that a Trump Presidency will provide a major boost to the crypto industry.
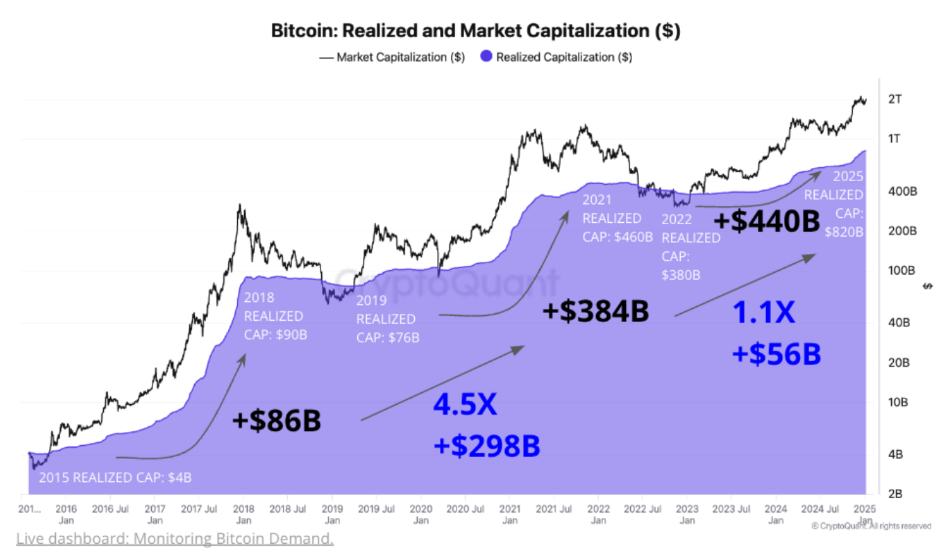
According to CryptoQuant, About $520 billion of fresh capital could flow into Bitcoin in 2025. In the context of favorable regulatory, monetary and cyclical conditions, it’s reasonable to expect capital to continue flowing into Bitcoin in 2025 the data and analytics provider added.
The idea of a bullish run in 2025 for crypto is further supported by Pantera Capital, who claims that the upcoming inauguration of Donald Trump should propel Bitcoin to new heights.
Another interesting one to keep an eye on as inauguration day draws closer.
Bitcoin realized cap data
Source: CryptoQuant (click to enlarge)
An accompanying chart (above) shows Bitcoin’s realized market cap with the combined value of the supply as it moves on chain since 2015. If the market follows historical patterns, CryptoQuant said, the $520 billion tally becomes attainable. Such a move would no doubt fuel rallies in price but leaves one with many questions.
US Data Could Temporarily Drive Bitcoins Price
US inflation data came out a short while ago with the Core inflation print YoY softer than expected. It will be interesting to see if this helps propel Bitcoin toward the 100000 mark and beyond.
Technical Analysis – BTC/USD Rests at Critical Juncture
Bitcoin (BTC/USD) from a technical standpoint on the daily timeframe the overall price action has been messy.
The reason for my observation stems from the lack of a convincing break of the previous swing low around 91800.
Though prices plunged below $90000 handle for a moment on Monday the swiftness with which prices rose suggest strong buying pressure remains in play.
As things stand, BTC/USD is a critical juncture as it tests 50-day MA which could serve to cap gains.
A failure to break back above and find acceptance could lead to a sharper selloff.
A rejection of this level brings the 95000 and 90000 into play, before attention turns to the 91804 and 90000 handle.
Bitcoin (BTC/USD) Daily Chart, January 15, 2025
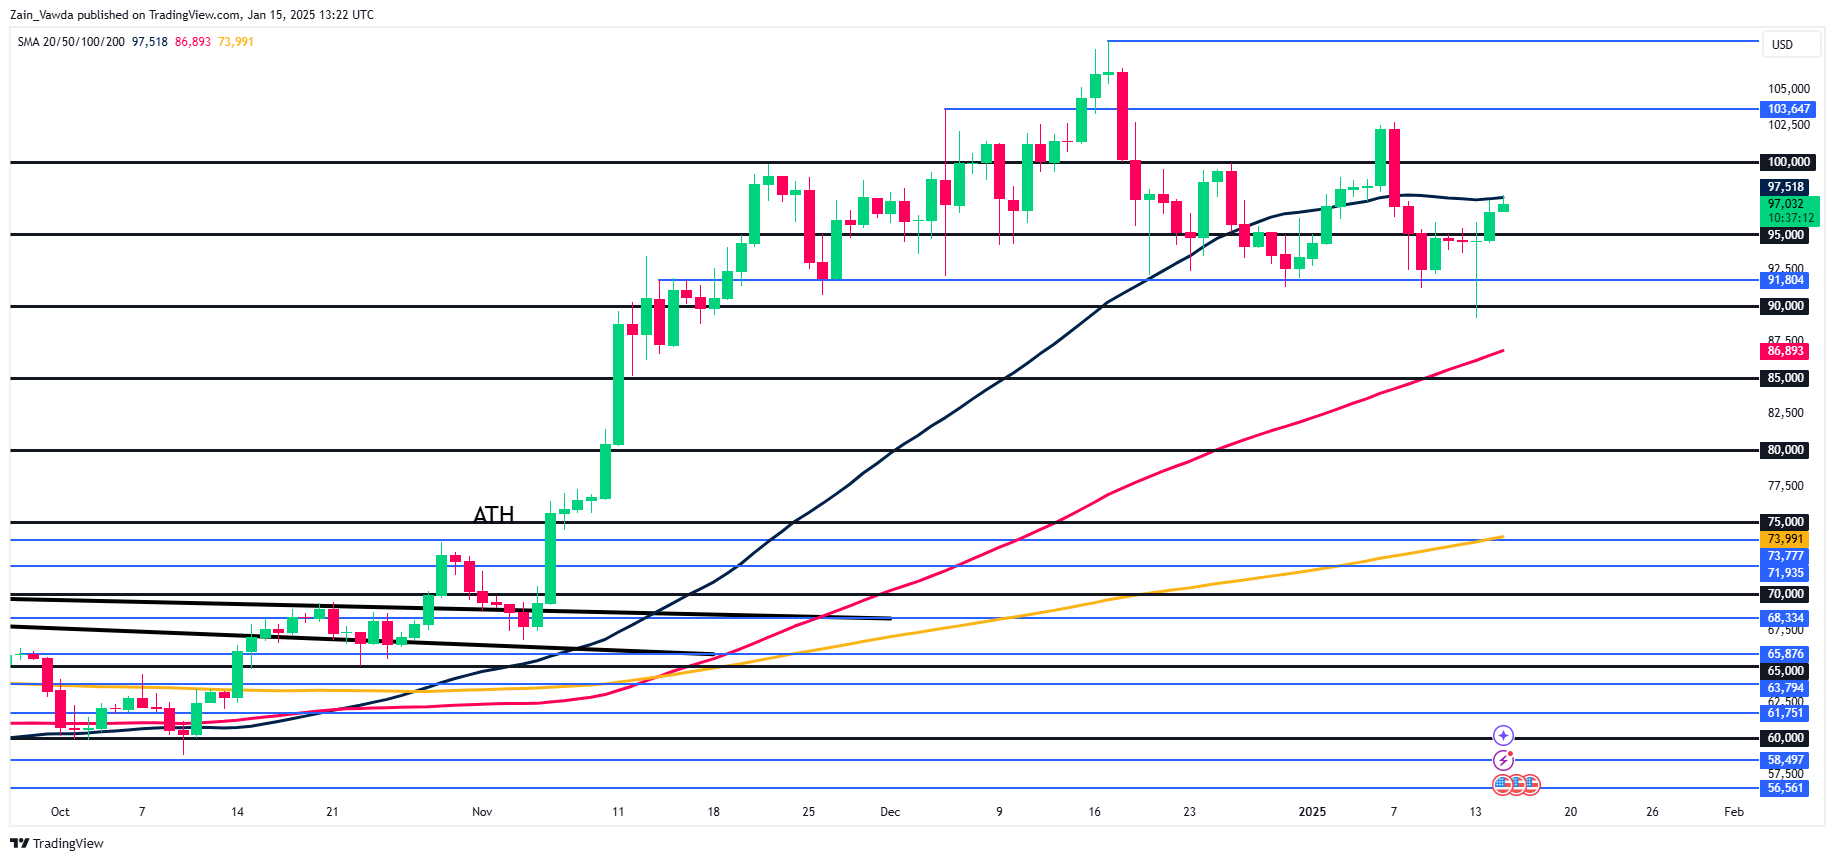
Source: TradingView.com (click to enlarge)
Support
- 97500
- 95000
- 91804
Resistance
- 100000
- 102261
- 103647