
Sample Category Title
BRL To Profit From Political Developments
Summer lull ends for the BRL
After a bumpy start into the summer, caused by the temporary rise in political uncertainty, the Brazilian real has finally returned to its pre-crisis level and stabilised at around 3.15. The move came on the back of falling odds that Michel Temer would face corruption prosecutions together with the approval by Senate of a labour reform.
Interest rates moved accordingly with the 2-year swaps rates consolidating slightly above 8.5%, while on the longer-end of the curve, the 10-year yield stabilised at around 10%. Finally, even though they took their time, CDS rates returned to their pre-crisis levels with the 5-year and 10-year trading at 203bps and 320bps, respectively.
However, since the end of July, USD/BRL has been treading water as investors await impatiently further positive developments on the political side, especially regarding the fiscal situation of the country. Indeed, with inflation back under control, investors will focus almost exclusively on that matter - with the exception of the Fed’s tightening programme - for now on.
The Brazilian government announced it would sell its controlling stake in Eletrobras, Brazil’s largest electricity provider. However, it is far from being a done deal due to regulatory constraint. Nevertheless, those developments are viewed positively by investors as it shows the willingness of Temer’s government to liberalise certain state-held companies. Similar positive developments may ignite a BRL in the coming months should that kind of news continue to flow.
USD/BRL closed at 3.1630 on Tuesday, edging slightly higher by 0.07%. The currency pair will surely gap lower at the opening bell this afternoon as the news will be more than welcomed by investors.
UK - GDP set to continue growing in Q2
UK Q2 GDP will be released tomorrow morning. The British economy is expected to grow 1.7% for the second quarter (annualized). The growth definitely seems to be robust and solid.
Meanwhile, Brexit negotiations are only making slow progress and fears of a Hard Brexit are still present in the markets. In our view, we consider that a Hard Brexit as very unlikely. European Countries have different trade relations with UK and this leads us to think that it will be very complicated that those members agrees on a consensus regarding the negotiations. It seems definitely complicated that the 27 members will all line up against the UK. As a result, this will likely benefit to the UK during this negotiation period.
Since the Brexit vote, the cable has increased from 1.20 to 1.30 and the pair is consolidating slightly above 1.28. There are further room for a weaker GBP in the medium-term as long as markets believe on a likely Hard Brexit or on tough consequences for the UK economy.
Daily Technical Analysis: EURGBP Breaking Out Above Weekly H4
The EUR/GBP is soaring. Upper trend line has been broken and consequently the price is above clear POC 0.9170-85 (W H4, upper trend line, D H4). Subsequent retests of the zone could provide the BPC pattern (breakout-pullback-continuation) towards 0.9230. Some short term shorts might come in play around 0.9215-0.9230, but generally the pair is bullish and buying into dips around the POC zone could be the strategy for today.
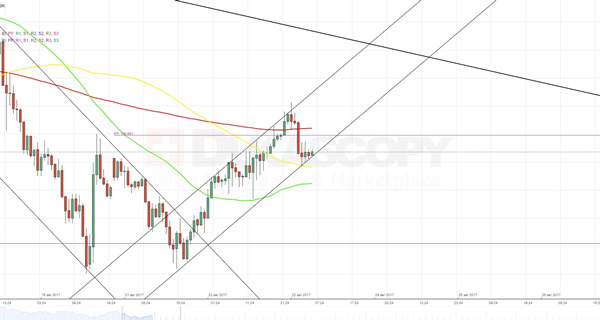
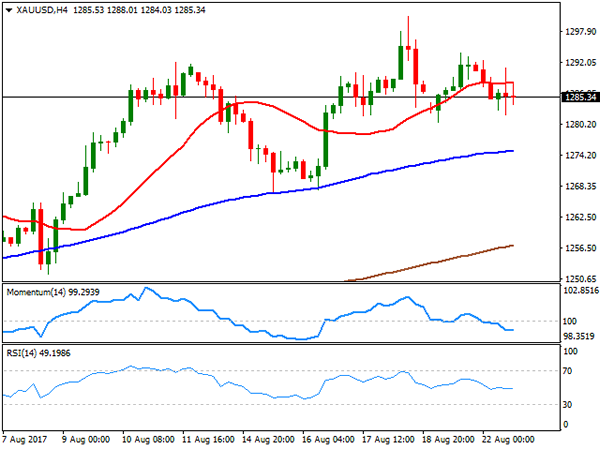
XAU/USD Analysis: Continue To Move Horizontally
In line with expectations, the rest of the previous trading session the yellow metal spent in a relatively flat movement against the US Dollar. The pair did not resume the surge, but it also did not manage to sneak through a combination of the 200-hour SMA and the weekly PP at 1,284.70.
Nevertheless, a steady movement to the bottom seems the most viable scenario, as the bullion has entered in a little short-term descending channel.
On the other hand, an aggregate of technical indicators on the 1D timeframe sends an opposite signal, warning that the above support level might be too strong to be so easily bypassed.
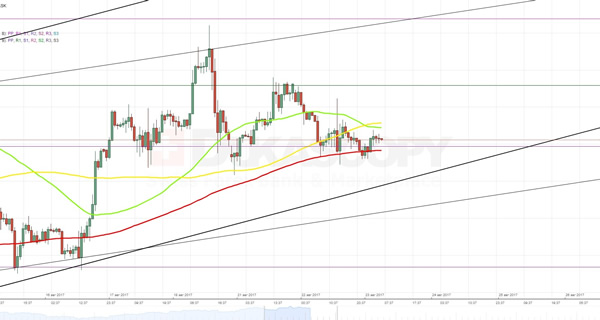
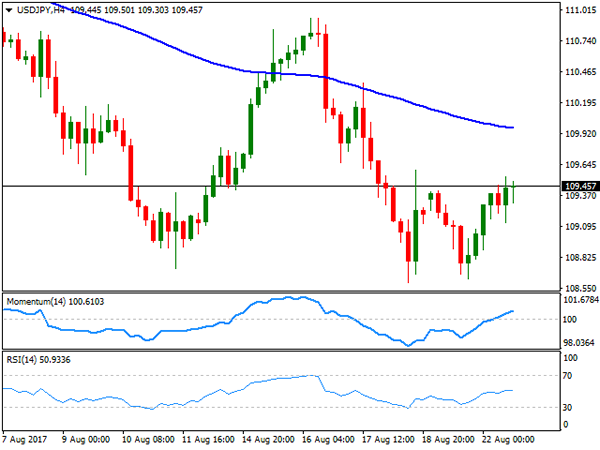
USD/JPY Analysis: Spikes Above 200-Hour SMA
The way the currency pair ended up previous trading day shows how it is important in certain cases to take into account the overall market sentiment. As it can be seen from the chart, yesterday the exchange rate has successfully managed to break through a combined resistance level set up by the 100- and 200-hour SMAs as well as the weekly PP.
Despite the 22-pip fall in the early morning, it seems that the rate is moving in a narrow short-term ascending channel. If this assumption is true, the pair might get a chance to gradually surge to the area between 110.10 and 110.30 levels, which represents a location of the northern boundary of a senior descending channel.
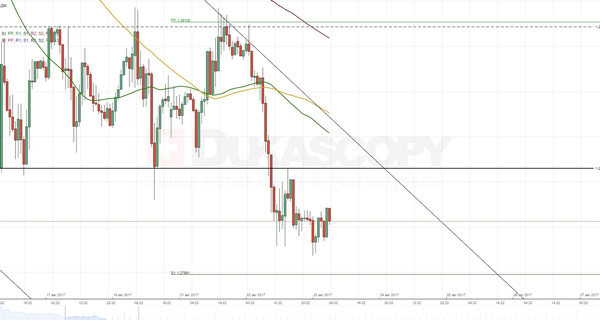
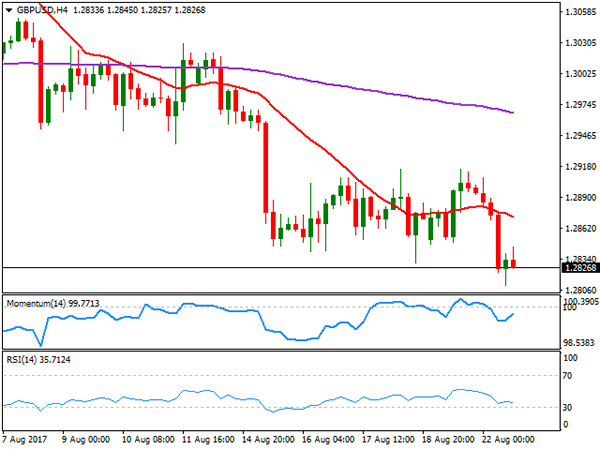
GBP/USD Analysis: Breaks Through 1.2846
In accordance with one of the scenarios expressed yesterday, the currency exchange rate made a confident breakout from the rectangle formation and slipped to the bottom.
The likely impulse for such outcome was provided by a combination of the 55- and 100-hour SMAs near the 1.2881 mark.
At the moment, the currency rate has only one barrier on its way, which is set up by the weekly S1 at 1.2799. In the short run, the pair might a make a rebound.
But, given the general downtrend that started in the beginning of August, the Pound is expected to continue to lose value against the US Dollar.
EUR/USD Analysis: Finds Support At 1.1754
As it was expected, a release of information on the German Economic Sentiment, which appeared to be even less than analysts anticipated, notably affected valuation of the Euro. Namely, it dragged the currency pair down by 0.34%. And the only obstacle that stopped the fall was the weekly PP located at the 1.1754 level. Given that this barrier practically coincides with the bottom edge of a junior ascending channel, the exchange rate should not plunge any further. From technical perspective it is expected to make a rebound and start to move towards the 1.1800 mark. However, this scenario might not materialize due to the ECB President Mario Draghi speech that will be delivered at 7:00 GMT and that most likely will cause significant volatility in the markets.
Technical Outlook: AUDUSD – Negative Near-Term Outlook After Repeated Upside Rejections
The Aussie dollar holds in red for the second day and extends pullback from 0.7950 zone where multiple upside rejections occurred in recent sessions.
This could be seen as a signal further weakness and lower top formation.
The price returned below 10/20SMA's with persisting bearish momentum that could put the pair under stronger pressure.
Key near-term support lies at 0.7867 (last Friday's low/Fibo 61.8% of 0.7807/0.7962 recovery leg) and sustained break here would give stronger signal of lower top and open key support at 0.7807(15 Aug low) for retest.
Broken 20SMA caps today's action and marks initial resistance at 0.7918, guarding key barriers at 0.7950/62 (recent upside rejections) break of which will be bullish.
Res: 0.7918, 0.7950, 0.7967, 0.8000
Sup: 0.7867, 0.7844, 0.7807, 0.7786
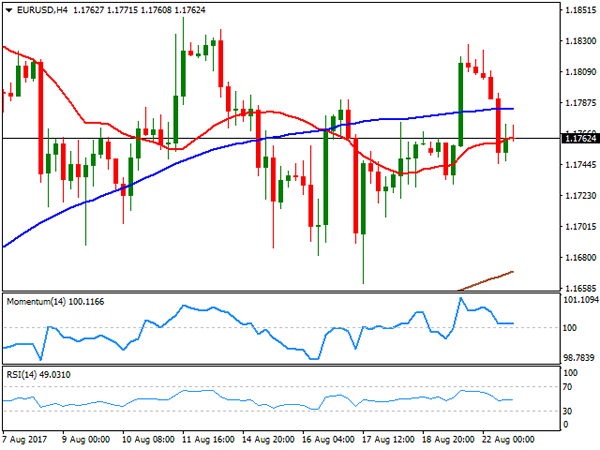
Technical Outlook: EURUSD Jumps From Dangerous Zone, Boosted By PMI Data
The Euro regains momentum and bounces from dangerous zone (1.1730/40) where downside attempts failed for the third time.
Fresh acceleration higher was fuelled by better than expected PMI data from Germany and EU (German Manufacturing PMI was 59.4 in Aug vs 57.7 f/c, while EU manufacturing PMI was at 57.4 in Aug vs 56.3 f/c).
ECB's chief Mario Draghi did not offer something substantially new in his today's speech today, reiterating that unconventional monetary policy in past decade has been a success, however, rigorous research in gaining further knowledge about this toll is required. Draghi said that the world became more resilient after applying unconventional methods in policy and regulation.
More signals from top central bankers are expected on Jackson Hole symposium which starts on Thursday, when Draghi is due to speak.
The Euro hit new session high at 1.1789 and may extend fresh recovery action higher after triple downside rejection and failure to close below daily Tenkan-sen which acts as strong support at 1.1754.
Key near-term barriers lay at 1.1815/28 (Fibo 61.8% of 1.1910/1.1662 pullback / Mon/Tue double upside rejection) and sustained break here is needed to confirm reversal.
Overall bullish structure and political crisis in the US work in favor of Euro bulls.
Res: 1.1800; 1.1815; 1.1828; 1.1846
Sup: 1.1754; 1.1731; 1.1708; 1.1662
Foreign Exchange Market Commentary: EUR/USD, USD/JPY, GBP/USD, GOLD, WTI CRUDE, DJIA, FTSE100, DAX
EUR/USD
The American dollar recovered the ground lost on Monday against most of its major rivals, and even entered positive territory against some of them, but gains remain shallow ahead of first-tier macroeconomic events coming during the second half of the week. Most action took place right after London's opening, when a strong opening of European equities interrupted the reigning risk aversion seen on the previous session. The EUR/USD pair fell down to 1.1744, from where it bounced to stabilize around 1.1760, level that the pair maintained all through the US session. Weighing on the common currency was the only piece of macroeconomic news released in the EU, German's ZEW survey showed that sentiment fell beyond expected. Business sentiment in the country for August fell to 10 from 17.5 in July, while for the whole EU it retreated from 35.6 to 29.3. The assessment of the current situation, however, remained strong up to 86.7 from previous 86.4. In the US, the Richmond Fed manufacturing index remained flat at 14 in August, beating expectations of 11.
Things will heat up this Wednesday, with August preliminary PMIs for the EU and the US, and new home sales for this last, although investors may wait for the upcoming speeches from Yellen and Draghi within the Jackson Hole Symposium that will start on Thursday, and extend into the weekend.
The recovery above 1.1800 was once again reversed, and with the pair having reached a lower high so far this week for a third consecutive time, somehow indicating decreasing buying interest around the common currency, although the greenback is nowhere near on demand. The short term technical outlook is neutral according to the 4 hours chart, with the price right below directionless 20 and 100 SMAs, whilst technical indicators head nowhere around their mid-lines. The immediate support is the weekly low, at 1.1730, with a more relevant one in the 1.1680/90 region. Below this last, the pair can gain bearish momentum and extend its monthly decline beyond the current low of 1.1661. Strong selling interest is capping advances in the 1.1820/30 price zone, so it will take a break beyond 1.1860 to see the pair gaining bullish traction.
Support levels: 1.1730 1.1685 1.1650
Resistance levels: 1.1825 1.1860 1.1910
USD/JPY
The USD/JPY pair recovered slowly but steadily this Tuesday, ending the day not far from a daily high of 109.54, amid a recovery in worldwide equities and a modest uptick in US Treasury yields after Monday's decline to fresh 2-month lows. US data was generally positive, as US home prices rose 1.6% in the second quarter of 2017, despite June's monthly advance was shy of expectations, up by just 0.1%, whilst the Richmond Fed survey showed manufacturing activity in the region was better-than-expected, with the index at 14 for August, against market's forecast of 11. Ahead of key speeches from Fed' Yellen and ECB's Draghi, Japan will release the August preliminary Nikkei Manufacturing PMI during the upcoming Asian session, expected at 52.3 from a downwardly revised 52.1 in July. In the 4 hours chart, the upward potential remains limited, as the price is well below bearish 100 and 200 SMAs, while Friday's high of 109.59 comes as an immediate resistance. Technical indicators in the mentioned time frame have entered positive territory, but the RSI has lost upward strength and turned neutral, reflecting the cautious stance towards the greenback that prevailed these last few weeks.
Support levels: 109.10 108.80 108.45
Resistance levels: 109.60 110.00 110.45
GBP/USD
The GBP/USD pair fell down to 1.2810, its lowest in nearly two months, as dollar's short-term demand affected more the weakened Pound. There were a couple of minor releases in the UK that came in above expected, with the CBI industrial trend survey showing that manufacturing grew in August, as the index came in at 13 from July's 10, also beating expectations of 8, while public sector net borrowing, excluding the nationalized banks, was in surplus by £184m in July, the first surplus since 2002, while excluding public sector banks, it increased by £1.9 billion to £22.8 billion in the current financial year-to-date, compared with the same period in 2016. The Pound, however, is unable to attract buyers ahead of the next round of Brexit negotiations, taking place in Brussels next week. From a technical point of view, the downside remains favored, given that in the 4 hours chart, the 20 SMA began gaining downward momentum above the current level, whilst technical indicators hold within bearish territory, with the RSI indicator already gyrating south around 35. A bearish extension through 1.2810 should favor an approach to the 1.2700/20 region, where the pair presents multiple relevant daily highs and lows from earlier this year.
Support levels: 1.2810 1.2755 1.2710
Resistance levels: 1.2845 1.2885 1.2920
GOLD
Gold prices eased this Tuesday, with spot settling at $1,285.44 a troy ounce, and trimming most of its weekly gains as the dollar rallied on better markets' mood. Still marginally higher for the week, a clearer picture for gold may come on Thursday, when Fed's Yellen will offer a speech within the Jackson Hole Symposium. The head of the Federal Reserve is not expected to talk specifically about the ongoing monetary policy, but investors will be trying to read in-between lines, looking for clues on what's next, particularly on rate hikes. In the meantime, the daily chart indicates that the upward momentum eased, but also that the commodity is far from bearish territory, as technical indicators eased modestly, but remain well above their mid-lines, whilst the price is far above all of its moving averages. In the shorter term, and according to the 4 hours chart, gold maintains a neutral stance, trading slightly below a horizontal 20 SMA and with technical indicators hovering around their mid-lines.
Support levels: 1,281.65 1,273.95 1,261.20
Resistance levels: 1,292.10 1,300.90 1,309.25
WTI CRUDE OIL
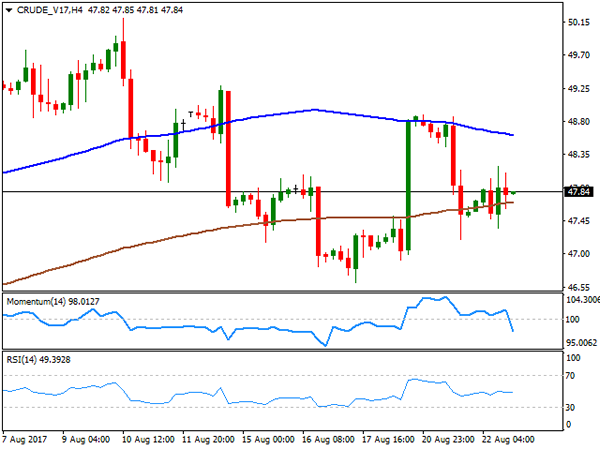
Crude oil prices posted a modest advance this Tuesday, with WTI ending the day at $47.84 a barrel, helped by expectations of another crude stockpile draw-down in the US last week. According to a Reuters' poll, inventories are expected to have fallen by around 3.4 million barrels in the week ended August 18th. The advance, however, was limited by news that Libya's Sharara oil field was reopening after its latest shutdown. The API report, to be released late Tuesday, could give a first glance of what the EIA report will bring. The shallow daily bounce hasn't been enough to revert the negative tone seen on previous updates, as in the daily chart, the commodity has barely bounced from its 100 DMA, while technical indicators remain within bearish territory, but lacking directional strength. In the 4 hours chart, the 100 SMA is gaining downward traction above the current level, the RSI remains flat around its 50 level, whilst the Momentum indicator presents a strong downward slope within negative territory, all of which maintains the risk towards the downside.
Support levels: 47.20 46.60 45.90
Resistance levels: 48.20 48.80 49.50
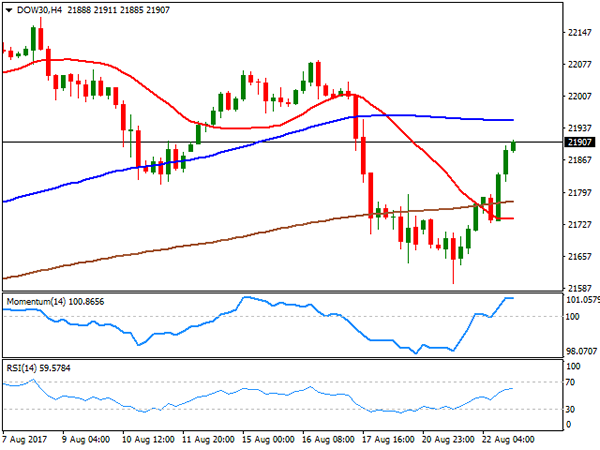
DJIA
Wall Street edged sharply higher this Tuesday, with the DJIA adding 196 points, its largest daily rally in four months, to end at 21,899,89. The Nasdaq Composite gained 1.36%, to close at 6,297.48, while the S&P settled at 2,452.51, up by 24 points. Speculation that the US administration will focus now on the long promised tax reform, woke up investor's appetite for equities, also getting support from a recovery in their overseas counterparts that rallied on the back or rising base metals. Only three members were down within the Dow, with Intel Corp. being the worst performer, down by 0.72%. Cisco Systems, on the other hand, led advancers, up 2.0%, followed by Caterpillar that added 1.95%. In the daily chart, the index pared its recovery a few points below a flat 20 DMA at 21,936, the immediate resistance, whilst technical indicators bounced from oversold levels, with the RSI indicator already entering positive territory, now at 54 and anticipating some further gains for this Wednesday. In the 4 hours chart, technical indicators lost upward strength near overbought territory, whilst the index ended well above its 20 and 200 SMAs, but below the 100 SMA, currently at 21.954.
Support levels: 21,880 21,836 21,790
Resistance levels: 21,936 21,970 22,011
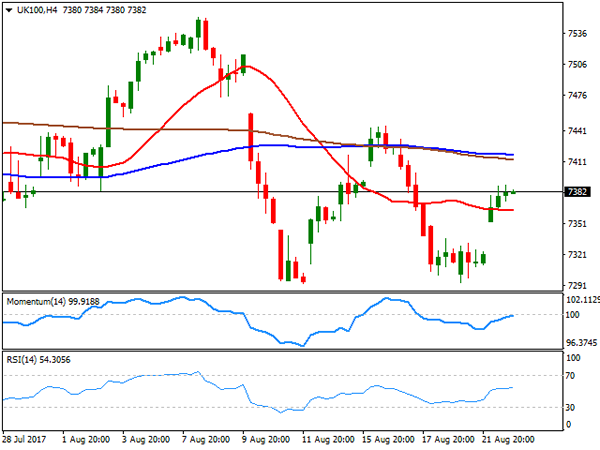
FTSE100
The FTSE 100 closed the day at 7,381.74, up by 63 points, as an advance in mining-related equities offset large losses from insurance related equities. Provident Financial plunged 66.22% after issuing its second profit warning in three months, losing two thirds of its value. Tesco led the advance, adding 4.10%, while Rio Tinto, Glencore and BHP Billiton added over 2.0% each, also making it to the top ten list. The positive tone persists in after-hours trading on Wall Street's recovery, but the daily chart for the Footsie shows that technical indicators remain within bearish territory, with limited upward strength, whilst the 20 and 100 DMAs remain above the current level, not enough to confirm a bullish extension for this Wednesday. In the 4 hours chart, the index presents a modestly positive tone, as it settled above a horizontal 20 SMA while the Momentum indicator aims higher around its mid-line, and the RSI at 55.
Support levels: 7,353 7,309 7,271
Resistance levels: 7,401 7,444 7,482
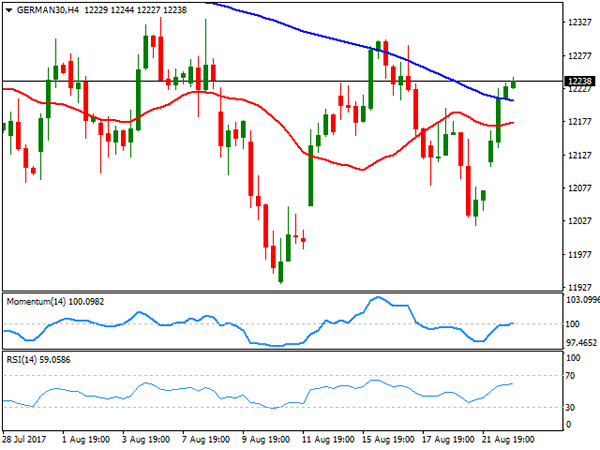
DAX
European equities edged higher this Tuesday, reversing a three-day losing streak, with the German DAX adding 165 points to end at 12,229.34, amid a recovery in the mining and automotive sectors. Within the DAX, only Commerzbank closed in the red, shedding 0.29%, while Fresenius led advancers, adding 3.36%, followed by Linde which gained 2.96%. The daily chart for the index shows that it settled above its 20 DMA, while technical indicators have turned north, but still hovering around their mid-lines and barely above this month highs, not enough to indicate a bullish continuation for this Wednesday. In the 4 hours chart, the index recovered above its 20 and 100 SMAs, while technical indicators entered positive territory but lost upward strength, in line with the longer term perspective. Further gains beyond the 12,300 region where the index topped last week, will likely encourage bulls, resulting in a firmer upward movement this Wednesday.
Support levels: 12,212 12,176 12,131
Resistance levels: 12,263 12,301 12,343
APAC FX Roundup Draghi And PMI’s Eyed
A quiet session with Hong Kong closed with the only notable movers being NZD and MXN.
Hong Kong was closed today as it weathered a T10 typhoon. But it seemed to matter not as Asia was content to sit and wait for ECB Governor Mario Draghi to speak at 08:25 London time in Germany followed by a swath of Eurozone PMI's. In the case of the former, the street will be hanging on to every word for a signal to the timing of the ECB's unconventional monetary policy. In the latter, the markets will be looking for a stronger performance to offset yesterdays surprisingly downbeat ZEW survey.
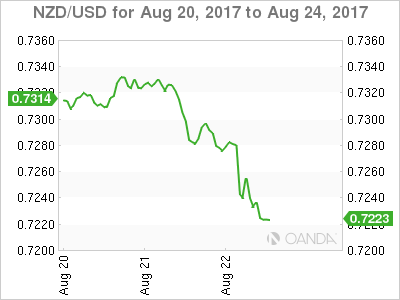
The two primary movers today were NZD and MXN which weakened, but for very different reasons. In the NZ Dollars case, the treasury released downgraded growth forecasts and budget surplus' for the years ahead with saw the Kiwi topple 50 points to a low of 7230 in Asia trading. This trend appears to be continuing into early London as pre-election jitters, and a dovish central bank weighs on the flightless bird.
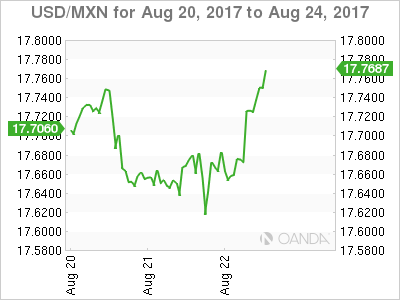
President Trump's Twitter account weighed on the Mexican Peso. Mr. Trump said that he was willing to shut down the government to get funding to build the wall, and is likely to scrap NAFTA at some stage in an underwhelming vote of confidence in North/South relations. USD/MXN rallied from 17.6500 to 17.7450 as the market digested the news from two issues that have been quiet of late.
Later on this evening, we will get U.S> PMI's as well as the official DOE Crude Inventories data which should bring some volatility (as if we didn't need more) to WTI and Brent. The market is forecasting a drawdown of -3.6 million barrels of crude and a drawdown of 1 million bpd of gasolene.