
Sample Category Title
GBPUSD Intraday Analysis
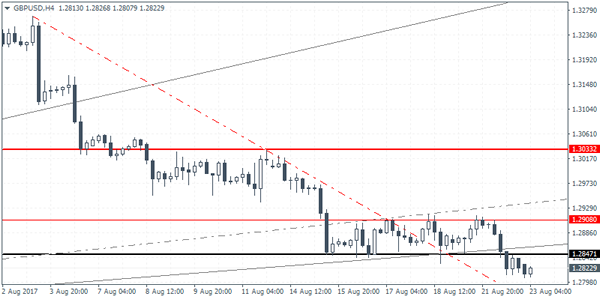
GBPUSD (1.2822): The British pound weakened strongly with price closing below 1.2847 support. However, the declines were limited which could mean that there is a possibility for the price to rebound to the upside. However, on the 4-hour chart, the price has broken to the downside. Therefore, a retest of the broken support at 1.2847 could turn to resistance. A reversal at this level could suggest further downside in price towards 1.2786 marking the completion of the downside move following the breakout from the range.
EURUSD Intraday Analysis
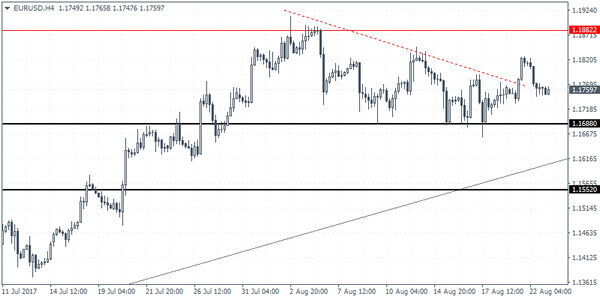
EURUSD (1.1759): The EURUSD weakened slightly yesterday, but price action was subdued, trading within the confines from Monday's range that was established. After rallying towards the highs from 11 August, EURUSD gave up the gains as the price fell back. The decline coincides with the upside breakout from the ascending triangle. The current retest of this breakout level could see price attempt to make another move to the upside. However, further gains are likely to be limited. This potentially keeps EURUSD range bound with support at 1.1688 in focus. A breakdown below this support will extend further declines in the currency pair. To the upside, the previously established range remains in place at 1.1882.
The Euro Currency Slips Ahead Of Draghi’s Speech
The US dollar was seen strengthening across the board yesterday. The modest gains come in anticipation of central bank chiefs convening at the Jackson Hole Symposium that is due to start tomorrow.
The economic calendar was light yesterday. Data from Canada showed that retail sales rose 0.1% which was lower than the median forecasts. Previous month's data was also revised down to show a 0.5% increase. Core retail sales, however, increased 0.7% on the month beating forecasts.
Looking ahead the economic data today will include a speech by ECB President Mario Draghi who will be speaking at an event in Germany. This could be the key event risk for the euro currency today. Later in the day, the Eurozone flash PMI's will be released for August. In the US flash manufacturing and services PMI from Markit will be coming up, and FOMC voting member Kashkari is scheduled to speak.
Trade Idea: GBP/USD – Sell at 1.2910
GBP/USD – 1.2828
Original strategy :
Sell at 1.2910, Target: 1.2710, Stop: 1.2970
Position: -
Target: -
Stop: -
New strategy :
Sell at 1.2910, Target: 1.2710, Stop: 1.2970
Position: -
Target: -
Stop:-
As cable has remained under pressure after breaking below support at 1.2832, adding credence to our bearish view that the selloff from 1.3269 top is still in progress and downside bias remains for this move to bring at least a retracement of early upmove to 1.2800, then 1.2770-75, below there would extend weakness to 1.2750, however, near term oversold condition should prevent sharp fall below previous support at 1.2706, risk from there has increased for a rebound later.
In view of this, would not chase this fall here and would be prudent to sell cable on recovery as said resistance at 1.2918 should limit upside, bring another decline. Above 1.2970-80 would defer and risk a stronger rebound to 1.3000 and possibly test of resistance at 1.3032, however, only break of latter level would abort and signal the fall from 1.3269 has ended instead, bring a stronger rebound to 1.3059 and possibly towards 1.3100 but previous support at 1.3112 (now resistance) should remain intact.
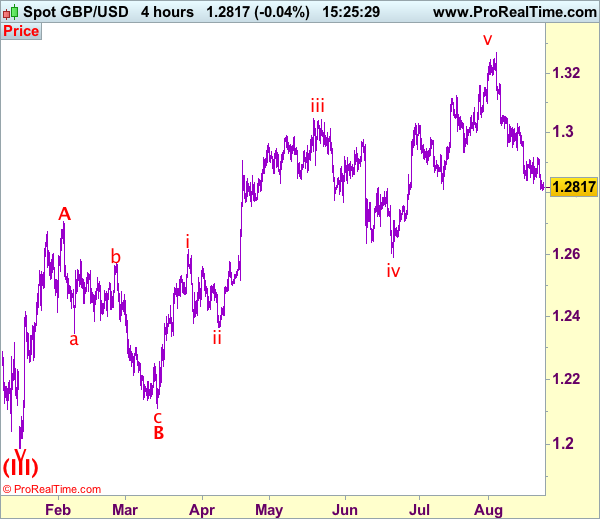
Our preferred count on the daily chart is that cable's rebound from 1.3500 (wave (A) trough) is unfolding as a wave (B) with A ended at 1.7043, followed by triangle wave B and wave C as well as wave (B) has ended at 1.7192, the subsequent selloff is the larger degree wave (C) which is still unfolding with minor wave (III) of larger degree wave 3 ended at 1.1986, hence wave (IV) correction is in progress which could either be a triangle wave (IV) of a complex formation but upside should be limited to 1.3500 and price should falter well below 1.4000, bring another decline in wave (V) of 3 for weakness to 1.1500, then 1.1200.
Trade Idea: GBP/JPY – Sell at 141.40
GBP/JPY - 140.35
Original strategy:
Sell at 141.40, Target: 139.40, Stop: 142.00
Position: -
Target: -
Stop: -
New strategy :
Sell at 141.40, Target: 139.40, Stop: 142.00
Position: -
Target: -
Stop:-
As the British pound has remained confined within recent established range, suggesting further sideways trading would take place before recent decline from 147.75 top resumes, a break below last week’s low at 139.80 would extend this decline to 139.50 but loss of downward momentum should prevent sharp fall below 139.00-10 and price should stay well above previous support at 138.70.
In view of this, we are looking to sell sterling on subsequent recovery as 141.40-50 should limit upside and bring such a decline. Only a break of resistance at 142.05 would suggest low is possibly formed instead, bring a stronger rebound to 142.50-60 but resistance at 143.20 should remain intact and bring another decline later.
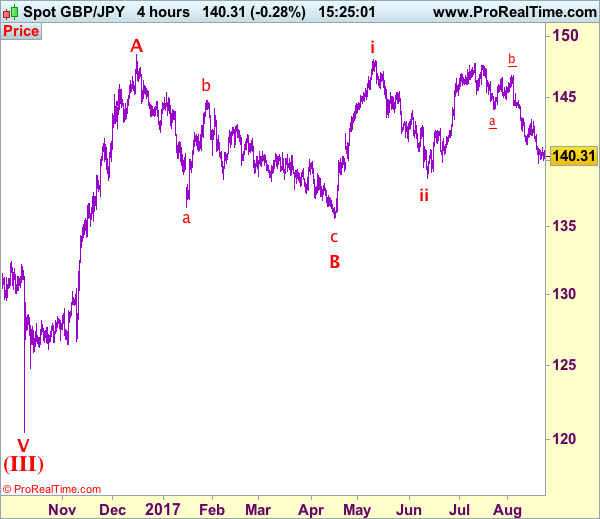
Our preferred count is that larger degree wave V with circle is unfolding from 251.12 with wave (I) 219.34, (II): 241.38 and wave (III) is subdivided into 1: 192.60, 2: 215.89 (23 Jul 2008) and wave 3 ended at 118.87 earlier in 2009. The correction from there to 162.60 is wave 4 which itself is a double three and is labeled as first a-b-c ended at 151.53, followed by wave x at 139.03, 2nd a ended at 162.60, 2nd b at 146.75 and 2nd c leg of wave 4 ended at 163.00. Therefore, the decline from 163.00 to 116.85 is now treated as wave 5 which also marked the end of larger degree wave (III), hence wave (IV) major correction has commenced for retracement of the wave (III) from 241.38 and upside target at 183.95-00 (50% Fibonacci retracement of the wave (II) from 241.38) had been met, a drop below 160.00 would suggest wave (IV) has ended at 195.85, bring decline in wave (V) for initial weakness to 130 (already met) and 120.
Trade Idea: EUR/JPY – Stand aside
EUR/JPY - 128.62
New strategy :
Stand aside
Position: -
Target: -
Stop:-
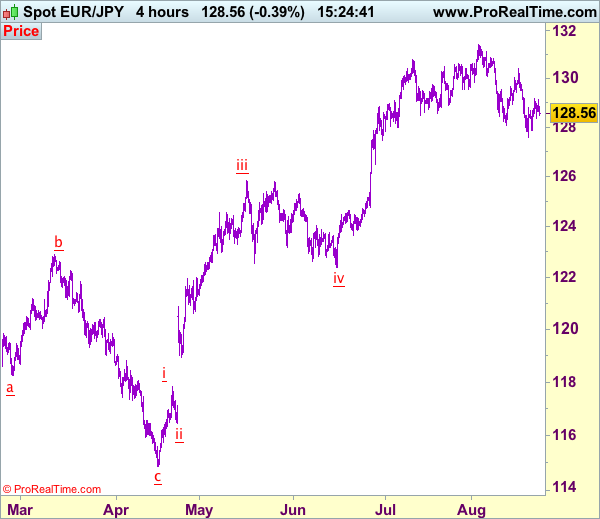
Although the single currency staged a rebound after finding support at 127.56 last week, as the pair met resistance at 129.18 and has retreated, suggesting consolidation would be seen and weakness to 128.10-15 cannot be ruled out, however, break of support at 127.84 is needed to signal the rebound from 127.56 (last week’s low) has ended, bring retest of this level, break there would signal the fall from 131.40 top is still in progress for retracement of early upmove to 127.00, then towards 126.50-60.
On the upside, whilst recovery to 129.15-18 cannot be ruled out, break of said resistance at 129.18 is needed to signal low has been formed at 127.56, bring a stronger rebound to 129.50-60 and possibly towards 130.00. Looking ahead, only break of indicated resistance at 130.40 would revive bullishness and signal the fall from 131.40 has ended, then gain to 130.90-00 would follow. As near term outlook is mixed, would be prudent to stand aside for now.
Our latest preferred count is that wave (ii) is ABC-X-ABC which ended at 123.33 and wave (iii) is unfolding with wave iii ended at 100.77, followed by wave iv at 111.57 and wave v as well as the wave (iii) has ended at 97.04, followed by wave (iv) at 111.43 and wave (v) has ended at 94.12 which is also the end of the larger degree v, this also implied the major wave (C) has also ended there, hence major correction has commenced from there with (A) leg unfolding in its lower degree wave c which has possibly ended at 145.69. Under this count, A-B-C wave (B) has commenced with A leg ended at 136.23, wave B at 143.79 and wave C has possibly ended at 149.79.
Our larger degree count is that the decline from 139.26 is wave (C) and is sub-divided into a diagonal triangle i-ii-iii-iv-v with wave i - 105.44, wave ii- 123.33, wave iii - 97.03, wave iv - 111.43, followed by the final wave v as well as the end of wave (C) at 94.12, this also mark the bottom of larger degree wave B. Under this count, major rise in wave C has commenced as an impulsive wave with minor wave III ended at 145.69, wave V is still in progress for further gain to 150.00. Having said that, this so-called wave V could well be the first leg of larger degree 5-waver wave C and this wave C should bring at least a retest of wave A top at 169.97 (July 2008).
Trade Idea: AUD/USD – Hold long entered at 0.7895
AUD/USD – 0.7886
Recent wave: Wave 5 ended at 1.1081 and major correction has commenced for fall to 0.7000 and then towards 0.6500-10
Trend: Near term up
Original strategy :
Bought at 0.7895, Target: 0.8050, Stop: 0.7865
Position: - Long at 0.7895
Target: - 0.8050
Stop: - 0.7865
New strategy :
Hold long entered at 0.7895, Target: 0.8050, Stop: 0.7865
Position: - Long at 0.7895
Target: - 0.8050
Stop:- 0.7835
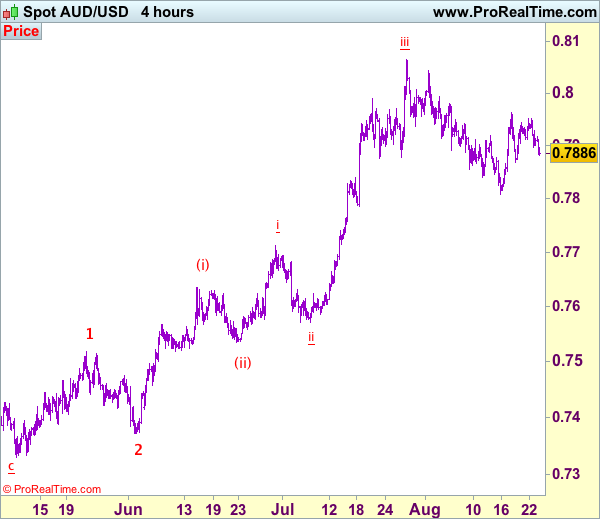
Aussie’s retreat after faltering below resistance at 0.7963 suggests caution on our bullishness but as long as support at 0.7869 holds, prospect of another rebound remains, above indicated resistance at 0.7963 would add credence to our view that low has possibly been formed at 0.7808 early last week, bring a stronger rebound to 0.8000 but break there is needed to signal the pullback from 0.8066 top (wave iii peak) has ended at 0.7808 (wave iv) and bring eventual retest of this level.
In view of this, we are holding on to our long position entered at 0.7895. Below said support at 0.7869 would dampen this bullish scenario and suggest the rebound from 0.9808 has ended, bring another test of this level, below there would signal the wave iv correction from 0.8066 is still in progress for weakness to 0.7786 support, however, oversold condition should prevent sharp fall below 0.7750 and price should stay above i top at 0.7712, bring rebound later. We are keeping our latest bullish count that recent impulsive waves is unfolding as (1 2, (i)(ii), i ii) and may extend headway towards 0.8150.
On the 4-hour chart, the move from 0.8066 is the wave 5 with i: 0.8860, ii: 0.8315, wave iii is an extended move ended at 1.0183, iv: 0.9706 and wave v has ended at 1.1081 (also the top of entire wave 5). The subsequent selloff is the major correction which is unfolding as ABC-X-ABC and 2nd A leg has ended at 0.8848, followed by a-b-c wave B which ended at 0.9758, hence, 2nd C wave is now in progress and indicated downside target at 0.7000 and 0.6950 had been met, so further fall to 0.6710-20 cannot be ruled out.
AUD/JPY Candlesticks and Ichimoku Analysis
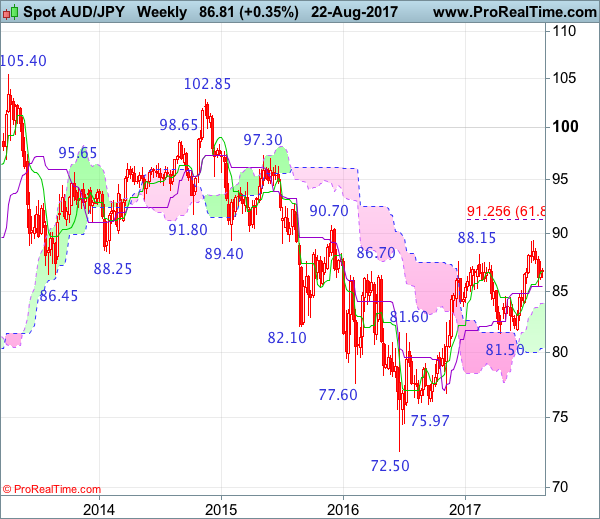
Weekly
• Last Candlesticks pattern: Shooting star
• Time of formation: 13 Mar 2017
• Trend bias: Down
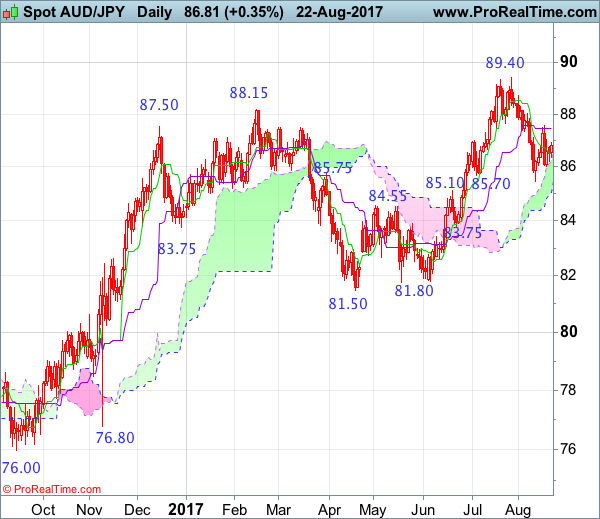
Daily
• Last Candlesticks pattern: Bearish engulfing pattern
• Time of formation: 16 Feb 2017
• Trend bias: Near term down
Although the Australian dollar fell quite sharply to 85.45 earlier this month, as the pair found support there and staged a rebound to 87.55, retaining our bullishness for another rebound, above said resistance at 87.55 would bring further gain to 88.00-10 but break of resistance at 88.70-75 is needed to signal the retreat from 89.40 has ended, bring another rise towards this level, otherwise, further choppy trading would take place. Looking ahead, only a break of this recent high would confirm medium term upmove from 2016 low of 72.50 has resumed and extend further gain to psychological resistance at 90.00, then towards previous chart resistance at 90.70.
On the downside, whilst initial pullback to 86.00 cannot be ruled out, reckon downside would be limited and said support at 85.45 should remain intact, bring another rebound later. A daily close below said support at 85.45 would suggest top has been formed at 89.40, bring retracement of recent rise to 85.00, then 84.50, however, near term oversold condition should limit downside to previous support at 83.75 and bring another rebound in late Q3.
Recommendation: Hold long entered at 85.75 for 88.00 with stop below 84.40.
On the weekly chart, as aussie found support right at the Kijun-Sen and recovered, suggesting consolidation above support at 85.45 would be seen and as long as this level holds, prospect of another rebound to 87.55 is likely, however, break of 88.70-75 resistance is needed to signal the retreat from 89.40 has ended, bring retest of this level which is likely to hold on first testing. Looking ahead, above this recent high would confirm medium term upmove from 72.50 low (formed back in 2016) has resumed and may extend headway to psychological resistance at 90.00, then test of previous resistance at 90.70 but overbought condition should limit upside to 91.50-60 and price should falter below another previous chart resistance at 92.70, bring correction later.
On the downside, below said support at 85.45 (same level as current Kijun-Sen) would suggest a temporary top has possibly been formed at 89.40 and downside risk remains for retracement of recent upmove to bring further fall to 84.95-00, then test of the upper Kumo (now at 84.02) but reckon previous support at 83.75 would limit downside and price should stay above support at 82.55-60, bring rebound later.
EURUSD Range Break Looms
The EURUSD pair is currently moving in a tight trading range, ahead of a key note speech from European Central Bank President Mario Draghi, who is speaking today, at the Lindau symposium, in Germany.
After falling sharply from the 1.1828 level, the euro is now trading between the 1.1745 to 1.1773 zone, with a technical range break-out looming.
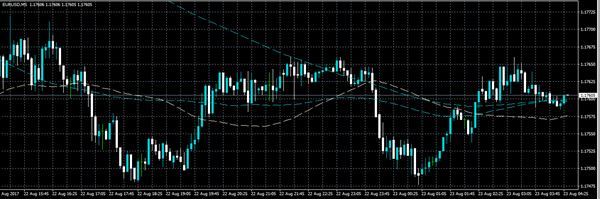
The EURUSD pair remains neutral in the short-term, with a slight negative intraday bias whilst trading below the 1.1770 level.
Key technical intraday support is found at 1.1731, 1.1713 and 1.1680. Higher time frame price closes below the 1.1713 level are now needed to accelerate the euro's downside.
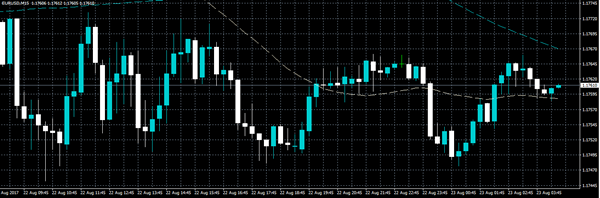
Key intraday technical resistance for the EURUSD pair is found at 1.1770, 1.1783 and 1.1789. Higher time frame price closes above the 1.1789 level are now needed to accelerate the euro's upside.
USDJPY Attemping To Recover 110
The USDJPY is attempting to recover the key 110 level, with buyers pushing the pair to an intraday high of 109.82. A recovery in the U.S dollar index, and rising stocks markets are helping to underpin the greenback's recent strength.
At present, the pair is trading around the 109.50 level, after finding pullback support from USDJPY H1 time frame, 100 period moving average, found at the 109.37 level.
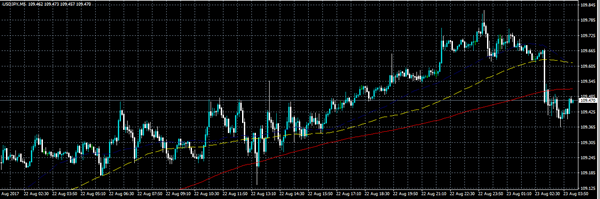
The USDJPY pair remains bearish on all-time frames, with the intraday outlook neutral, until the pair trades firmly above the weekly pivot point, found at 109.59.
Intraday resistance above the 109.59 level is found at the daily high, at 109.82, the psychological 110 level, and the former swing high, at 110.39.
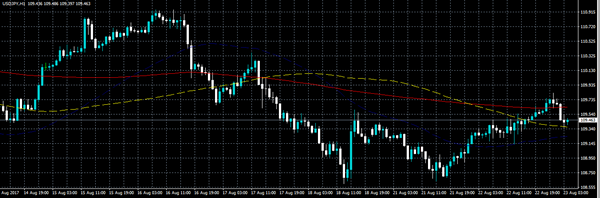
To the downside, the USDJPY pivot point is found at 109.46, with the 100-hour moving average adding further support, at 109.37.
Below the 109.37 level, the former swing low adds intraday support, at 109.13, as does the key 108.90 level.