Sample Category Title
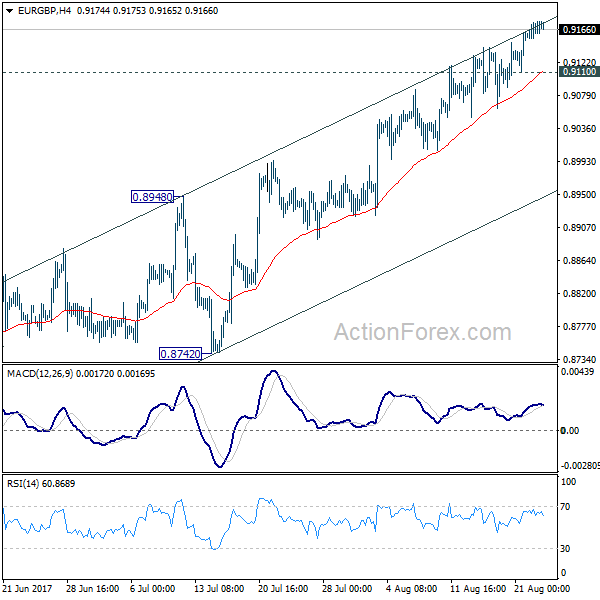
EUR/GBP Shows Little Action
EUR/GBP changed little in the morning, but maintains a bullish perspective on the daily chart as is still located in the green area. The next upside targets will be at the upper median line (UML) of the major ascending pitchforks and at the 0.9226 horizontal resistance. Th outlook is bullish as long as is trading above the median line (ml) of the minor blue ascending pitchfork.
GBP/JPY Targeting New Lows
Price is trading in the red and should resume the corrective phase, after a minor distribution. The next major downside target will be at the first warning line (WL1) of the ascending pitchfork. Could drop towards this target after the failure to retest the median line (ml) of the minor descending pitchfork.
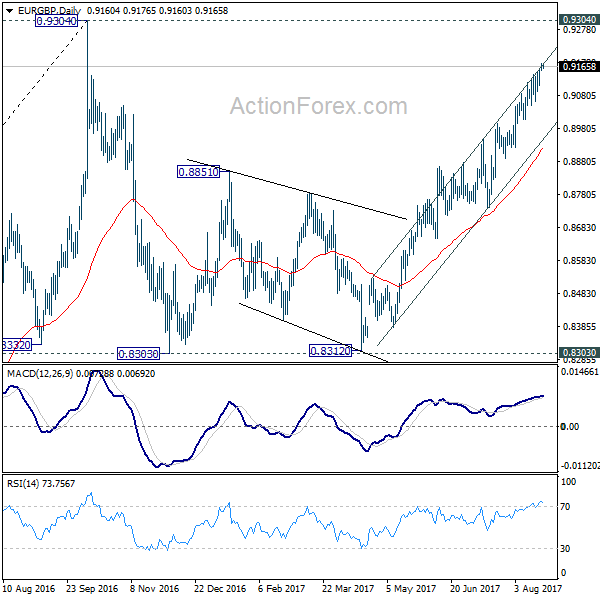
EUR/GBP Daily Outlook
Daily Pivots: (S1) 0.9157; (P) 0.9167; (R1) 0.9180; More
Intraday bias in EUR/GBP remains on the upside for the moment. Current rise from 0.8312 is still in progress for 0.9304 high. At this point, there is no clear sign of up trend resumption yet. Hence, we'll be cautious on strong resistance from 0.9304 to limit upside and bring another fall. On the downside, break of 0.9110 minor support will turn intraday bias neutral first.
In the bigger picture, price actions from 0.9304 are viewed as a medium term corrective pattern. It's uncertain whether it is finished yet. But in case of another fall, we'd expect strong support from 0.8116 cluster support (50% retracement of 0.6935 to 0.9304 at 0.8120) to contain downside and bring rebound. Whole up trend from 0.6935 is expected to resume after consolidation from 0.9304 completes.
EUR/JPY Selling Opportunity?
The price is trading in the red right now and looks determined to turn to the downside again after the minor bounce back. Could drop much deeper as the rate has retested an important dynamic resistance (support turned into resistance) and because the Yen could be boosted by another Nikkei's drop.
JP225 is trading in the red and seems poised for more declines, but we'll see what will happen because has opened with a gap up in the morning. The Nikkei has shown some oversold signs on Monday when has failed to close below the 19309 previous low and now we could see a minor consolidation on the Daily chart.
We may have some volatility in the upcoming hours as the Euro-zone is to release significant data, the Flash Manufacturing PMI and the Flash Services PMI reports will be published.
EUR/JPY retested the inside sliding parallel line (SL) and now could retreat again. Is trading above the 38.2% retracement level, but a valid breakdown will confirm a further drop in the upcoming period. The perspective remains bearish as long as the rate is trading within the minor descending pitchfork. A failure to retest the upper median line (uml) will send the rate tumbling towards the median line (ml) and towards the 50% Fibonacci line (ascending dotted line).
The price action could confirm a minor Head and Shoulders pattern if will stabilize somewhere below the 128.00 psychological level. Price will drop towards the median line (ML) of the major ascending pitchfork if this pattern will be confirmed.
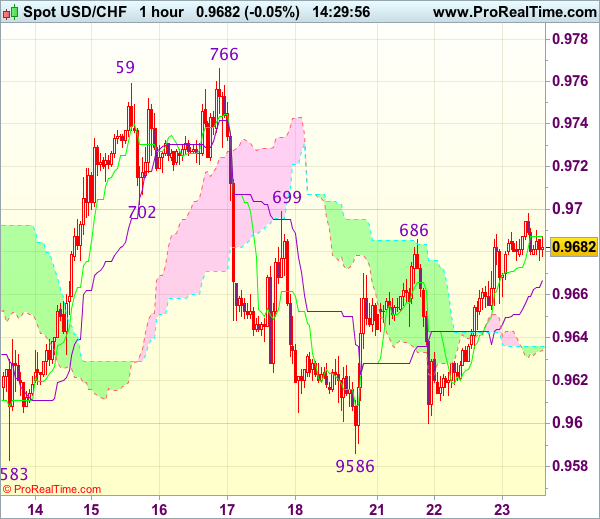
Trade Idea : USD/CHF – Buy at 0.9630
USD/CHF - 0.9683
Most recent candlesticks pattern : N/A
Trend : Sideways
Tenkan-Sen level : 0.9687
Kijun-Sen level : 0.9667
Ichimoku cloud top : 0.9636
Ichimoku cloud bottom : 0.9634
Original strategy :
Buy at 0.9630, Target: 0.9730, Stop: 0.9595
Position : -
Target : -
Stop : -
New strategy :
Buy at 0.9630, Target: 0.9730, Stop: 0.9595
Position : -
Target : -
Stop : -
As the greenback has staged a strong rebound after holding above indicated support at 0.9583-86, suggesting the retreat from 0.9766 has ended at 0.9586 last week and consolidation with mild upside bias is seen for gain to 0.9720, then 0.9740, however, reckon resistance at 0.9766-73 would cap upside and bring further consolidation. Only a break of 0.9773 would retain bullishness and signal early rise from 0.9438 has resumed and extend gain to 0.9800.
In view of this, we are looking to buy dollar on pullback as 0.9620-30 should limit downside. Below 0.9600 would risk test of strong support at 0.9583-86 but only break there would signal a downside break of recent broad range has occurred, bring subsequent fall to 0.9550.
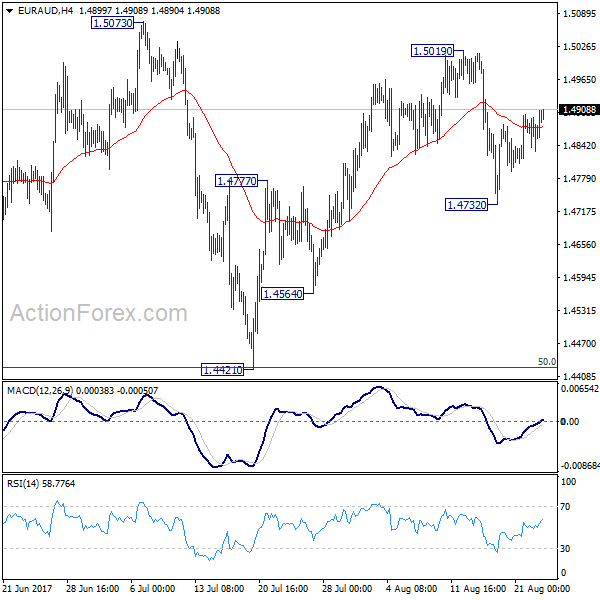
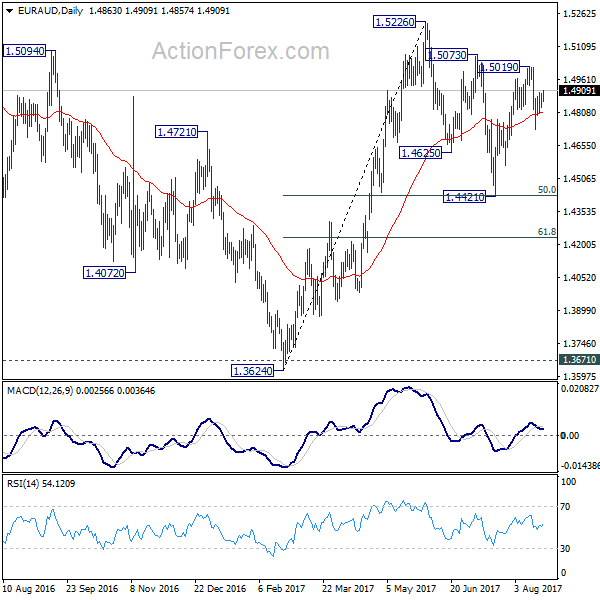
EUR/AUD Daily Outlook
Daily Pivots: (S1) 1.4835; (P) 1.4864; (R1) 1.4898; More...
Intraday bias in EUR/AUD remains neutral for the moment. Consolidation pattern from 1.5226 is possibly still in progress. Below 1.4732 will bring another fall. But we'd expect 1.4421 cluster support (50% retracement of 1.3624 to 1.5226 at 1.4427) to hold and bring rebound. On the upside, above 1.5019 will target a test on 1.5226 high instead.
In the bigger picture, we're holding on to the view that corrective decline from 1.6587 medium term has completed at 1.3624. Rise from 1.3624 is expected to extend to retest 1.6587. The corrective structure of the fall from 1.5226 is affirming this view. Above 1.5226 will target a test on 1.6587 key resistance. However, break of 1.4421 will dampen our view and would drag EUR/AUD lower to retest key support zone around 1.3624.
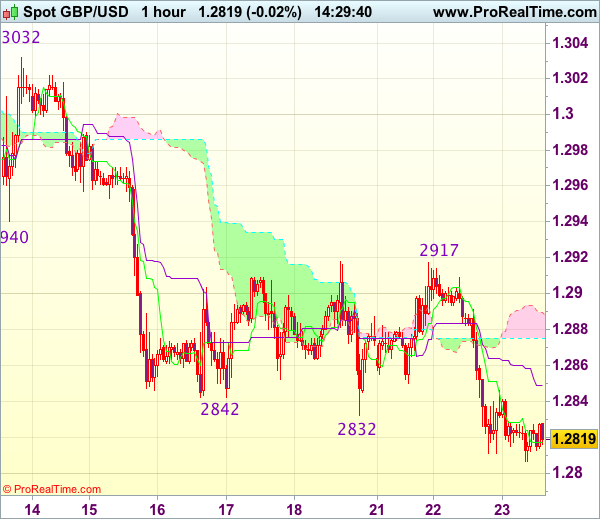
Trade Idea : GBP/USD – Stand aside
GBP/USD - 1.2820
Most recent candlesticks pattern : N/A
Trend : Near term down
Tenkan-Sen level : 1.2818
Kijun-Sen level : 1.2849
Ichimoku cloud top : 1.2890
Ichimoku cloud bottom : 1.2875
New strategy :
Stand aside
Position : -
Target : -
Stop : -
Although cable has remained under pressure after resuming recent decline and near term downside risk remains for weakness to 1.2790-00, loss of downward momentum should prevent sharp fall below 1.2770 and reckon 1.2750 would limit downside, price should stay above 1.2730-35 and risk from there is seen for a rebound to take place later.
In view of this, would not chase this fall here and would be prudent to stand aside for now. Above the Kijun-Sen (now at 1.2849) would bring test of the lower Kumo (now at 1.2875) but break of the upper Kumo (now at 1.2890) is needed to signal a temporary low is formed, bring a stronger rebound towards resistance at 1.2917-18.
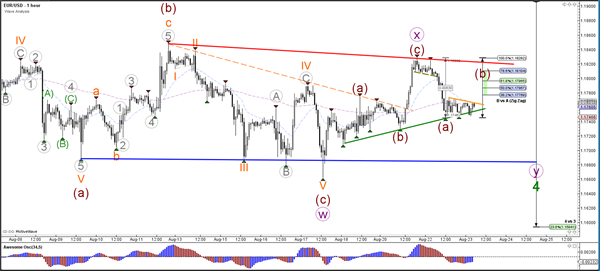
Daily Technical Analysis: EUR/USD Slips Back Into Triangle Pattern And Awaits Breakout
Currency pair EUR/USD
The EUR/USD failed to immediately continue with the bullish breakout yesterday and is building an expanded wave 4 (green) correction via a WXY (purple) pattern. A next breakout above the resistance trend line (red) of the contracting triangle pattern could see the continuation of wave 3 (blue).
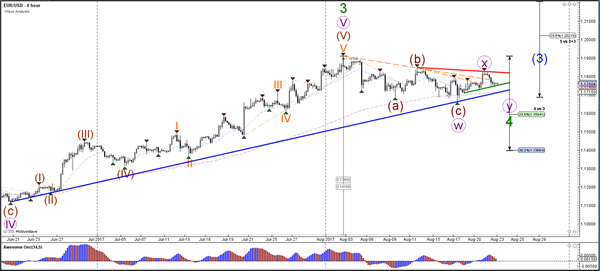
The EUR/USD is building a smaller triangle pattern which are indicated by the support (green) and resistance (orange) trend lines. A break below support could see price challenge the bigger support zone (blue) and perhaps even the 23.6% Fib of wave 4 vs 3. A break above resistance could see price test the bigger resistance line (red). There is the possibility of an ABC (brown) correction before wave 4 (green) is ready but a break above the major resistance (red) would invalidate that and indicate a potential bullish breakout.
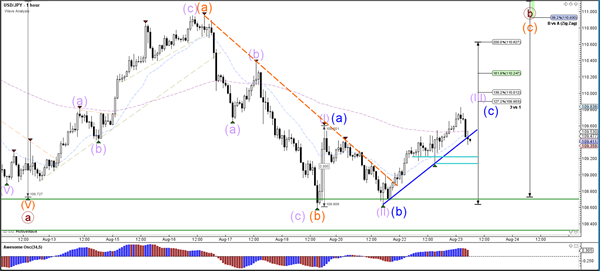
Currency pair USD/JPY
The USD/JPY made a bullish rally away from the key support zone (green lines) but bearish price action is now challenging the support trend line (blue). A bounce could see price move higher towards the Fib levels of wave B vs A whereas a bearish break could indicate a retest of the support zone.
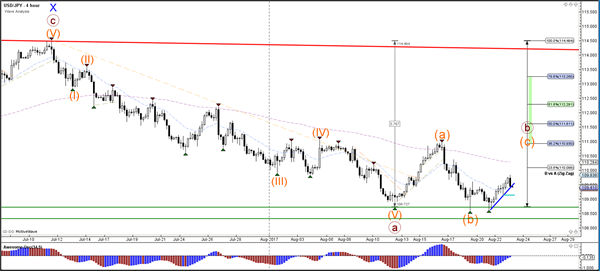
The USD/JPY is testing the intermediate support levels (blue lines). Price is either building a 123 (purple) or completed an ABC (blue), which will depend on how price responds to the support trend lines.
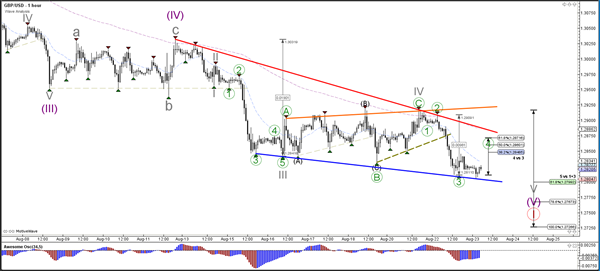
Currency pair GBP/USD
The GBP/USD made a new lower low but was unable to break below the support trend line (blue). The downtrend channel (red) is still valid for this Cable pair and price could test the Fib levels.
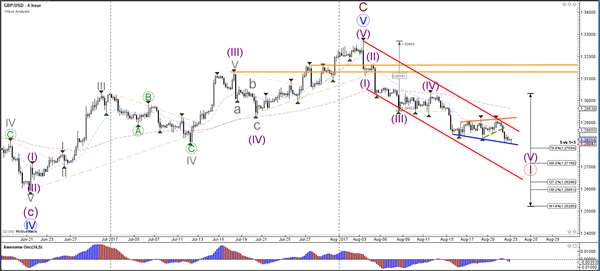
The GBP/USD bearish breakout (dotted green) is most likely a wave 3 (green). The wave 4 (green) is valid as long as price stays below the 61.8% Fib at 1.2872.
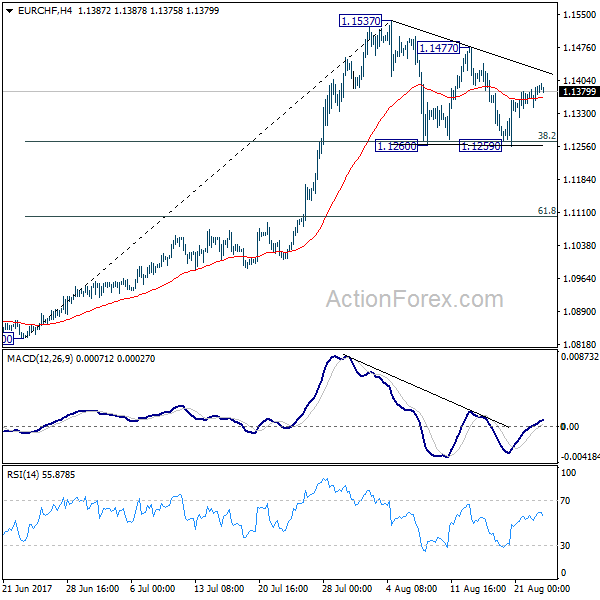
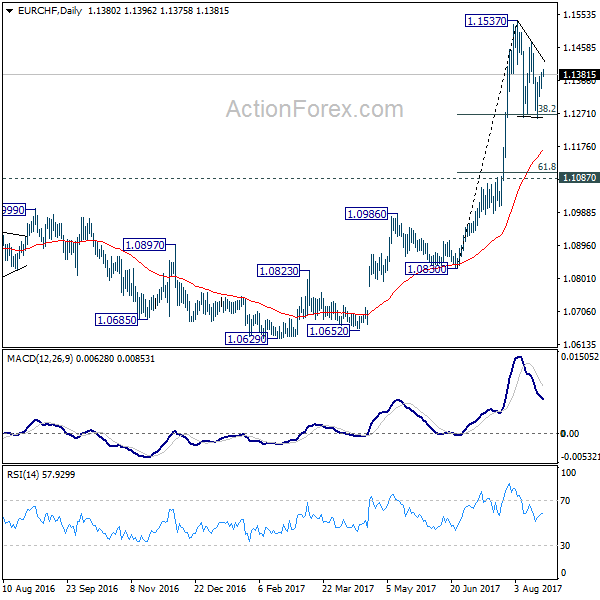
EUR/CHF Daily Outlook
Daily Pivots: (S1) 1.1358; (P) 1.1373; (R1) 1.1404; More...
EUR/CHF's consolidation from 1.1537 is still in progress and intraday bias remains neutral. On the upside, break of 1.1477 resistance will argue that the consolidation from 1.1537 has completed and larger rise is resuming. However, firm break of 38.2% retracement of 1.0830 to 1.1537 at 1.1267 will extend the correction to 61.8% retracement at 1.1100 before completion.
In the bigger picture, firm break of 1.1198 key resistance confirms resumption of the long term rise from SNB spike low back in 2015. In this case, EUR/CHF would eventually head back to prior SNB imposed floor at 1.2000. For now, this will be the favored case as long as 1.1087 resistance turned support holds.
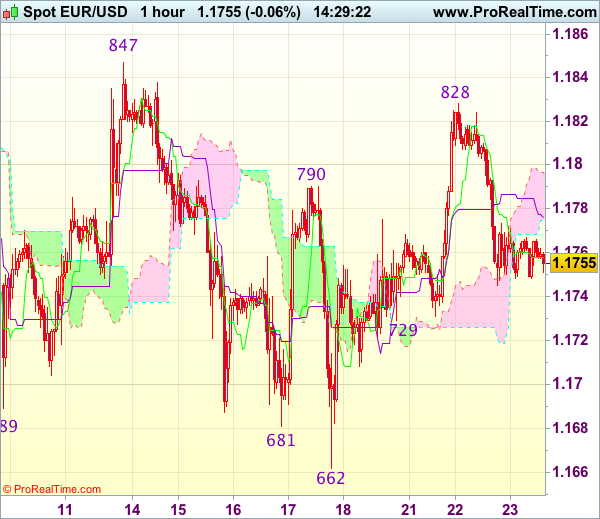
Trade Idea : EUR/USD – Hold long entered at 1.1765
EUR/USD - 1.1758
Most recent candlesticks pattern : N/A
Trend : Sideways
Tenkan-Sen level : 1.1758
Kijun-Sen level : 1.1776
Ichimoku cloud top : 1.1797
Ichimoku cloud bottom : 1.1775
Original strategy :
Bought at 1.1765, Target: 1.1865, Stop: 1.1730
Position : - Long at 1.1765
Target : - 1.1865
Stop : - 1.1730
New strategy :
Hold long entered at 1.1765, Target: 1.1865, Stop: 1.1730
Position : - Long at 1.1765
Target : - 1.1865
Stop : - 1.1730
As euro’s retreat from 1.1828 has kept price under pressure, suggesting caution our near term bullishness but as long as 1.1735-40 holds, mild upside bias remains for another rebound, above 1.1800 would bring test of said resistance at 1.1828, break there would extend the rise from last week’s low of 1.1662 to resistance at 1.1847, above there would provide confirmation the pullback from 1.1910 has ended and encourage for headway to 1.1870-80 but reckon said resistance at 1.1910 would hold from here.
In view of this, we are holding on to our long position entered at 1.1765. Only below 1.1725-30 would abort and suggest the rebound from 1.1662 has ended instead, risk weakness to 1.1695-00 first.