Sample Category Title
AUDUSD In Neutral Phase, Key 0.80 Level Acts As Strong Resistance
AUDUSD shifted to neutral after failing to make a sustained move above the key psychological level at 0.8000. After a brief spike to a more than two-year high of 0.8065 on July 27 the market reached extreme conditions as the RSI reached overbought levels.
Momentum signals are weak and consequently AUDUSD is now consolidating around the 23.6% Fibonacci retracement level of the rise from 0.7328 to 0.8065, at 0.7888. Both MACD and RSI are pointing down, giving room for more weakness in the market.
Support is expected at 0.7785, which is the July 18 low and the 38.2% Fibonacci retracement level. A breakdown at this point would bring AUDUSD under more pressure to drop to the 50% Fibonacci at 0.7695. From here the market would turn increasingly more bearish and reverse the uptrend that took place from 0.7328 to 0.8065.
The short-term bias is expected to remain neutral with the odds of downside risk increasing on a break below current support. Only a bounce back up to break the key 0.8000 resistance level would indicate the current neutral phase has ended and there would be a resumption of the uptrend. In the bigger picture, the medium-term bullish market structure remains intact and there has not been any clear indication of a change in the underlying trend.
Trump Yet Again Induces Dollar Weakness Against Yen, Other Majors Edge Down
President Trump has yet again induced weakness in the US currency with his remarks about a possible government shutdown to fulfill his campaign promises. The greenback weakened against the yen, but gained against other majors making the dollar index flat on the day. The release of flash PMI data out of the eurozone will attract some traction during early hours of European trading.
Speaking at a rally in Phoenix, President Trump said “If we have to close down the government, we are building that wall”, sparking concerns among the investor community and sending the dollar lower against the yen. The President went further to signal a possible end of the NAFTA treaty with Mexico and Canada, just as the first round of interviews finished on Sunday. While there is still time before a situation of a possible government shutdown becomes serious, the forex market did take note of Trump’s remarks. Dollar/yen was trading lower at 109.37 ahead of the European open, though still above the four-month low it touched last week.
Other majors weakened during Asian trading, though most were trading in tight ranges in the wake of no economic data releases and many traders awaiting signals from the central bankers’ symposium in Jackson Hole. The aussie was down at $0.7887, while the pound edged lower at $1.2818, but traded in a very tight range against the dollar for most of the Asian session.
The kiwi plunged against its US counterpart (down 0.73% at $0.72224) due to the government cutting its growth outlook for this and the next fiscal year. The New Zealand Treasury reduced its forecast for the year to June to 2.6% versus the previously estimated 3.2%, and cut its growth projection of 3.5% in the year to June 2018 from 3.7% in the May budget update.
The only economic data release that could have a significant impact on forex markets during the European session is the release of flash PMIs for France, Germany and the eurozone. The euro traded in a very narrow range ahead of the first data publication and was standing at $1.1754. The common currency didn’t react much following the release of the French PMI, and was trading at $1.1752. France’s manufacturing PMI came in better than expected (a preliminary reading of 55.8 for August versus expectations of 54.5). The country’s services PMI disappointed slightly with a figure of 55.5, just below the expected figure of 55.8.
Later in the session, traders could be busy monitoring preliminary PMIs from the US, July figures for new home sales out of the States and crude oil inventories. More so, Federal Reserve Bank of Dallas President Robert Kaplan is due to speak today.
Oil prices fell during the first session of the day despite the API report showing a drawdown in crude inventories. The American Petroleum Institute released a report last night pointing to a drawdown of 3.6 million barrels last week, more than the expected 3.5 million barrels. Initially, oil prices rose but later gave up on those gains following news that the production at Libya’s Sharara field restarted after several disruptions. WTI was last trading at $47.67 a barrel and Brent was at $51.70.
Following dollar weakness against the yen, gold prices rose modestly. The precious metal was last trading at $1,286.09 an ounce.
Technical Outlook: USDJPY – Daily Tenkan-Sen Limits Recovery Action For Now
The pair extended Tuesday’s strong recovery rally in early Wednesday’s trading but gains were so far short-lived and capped by daily Tenkan-sen at 109.77 which was briefly pierced on extension to session high at 109.82.
Subsequent easing suggests that recovery might be over, as the move was seen as correction of larger bear-trend from 114.49 which eyes target at 108.11 (17 Apr low).
However, the pair may remain in extended consolidation which should stay capped by daily Tenkan-sen and psychological 110.00 barrier (also Fibo 61.8% of 110.94/108.60 downleg / falling 20SMA) before bears resume).
Conversely, extension above 110.00 barrier would ease immediate bearish pressure, while extension above daily Kijun-sen (110.50) is needed to neutralize.
Res: 109.82, 110.00, 110.36, 110.50
Sup: 109.32, 108.85, 108.60, 108.11
Technical Outlook: GBPUSD – Bearish Signal On Break Below Daily Cloud
Cable traded within narrow range in Asia and pressuring 1.2800 support zone after strong fall on Tuesday closed well below key supports at 1.2857/48 (daily cloud base / Fibo 61.8% of 1.2588/1.3268 rally). Strong signal for bearish continuation of the downtrend from 1.3268 has been generated on eventual break below near-term 1.2831/1.2917 congestion and extension below daily cloud.
Fresh weakness also dented another important support at 1.2811 (12 July trough), firm break of which is needed to confirm bearish resumption towards 1.2749 (Fibo 76.4%).
Strong bearish setup of daily studies favors further downside, with consolidation above 1.2800 handle to precede fresh weakness.
Daily cloud base now acts as solid resistance at 1.2857, along with broken 100SMA (1.2880) and expected to keep corrective upticks capped.
Alternative scenario requires acceleration above daily cloud to sideline immediate bearish threats.
Res: 1.2848, 1.2857, 1.2880, 1.2912
Sup: 1.2806, 1.2749, 1.2715, 1.2647
EUR/CHF Elliott Wave Analysis
EUR/CHF : 1.1327
EUR/CHF: Major wave 5 trough ended at 0.8426 and correction has commenced from there for subsequent gain towards 1.1400-1.1500.
Although the single currency met renewed selling interest at 1.1479 and slipped again week, lack of follow through selling on break of support at 1.1261 and the subsequent rebound from 1.1259 suggest the correction from 1.1538 (i.e. wave iv) has possibly ended there, hence consolidation with upside bias is seen for another test of said resistance at 1.1479 but a daily close above there is needed to add credence to this view, bring retest of this recent high. Looking ahead, a break of this resistance at 1.1538 (wave iii top) is needed to confirm upmove has resumed in wave v to 1.1600, then towards 1.1700-10.
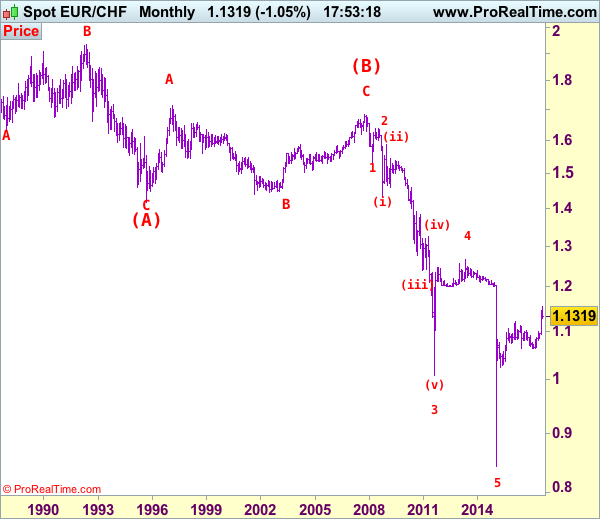
To recap our preferred count, the decline from 1.6828 (end wave (B)) is labeled as the beginning of wave (C) which should unfold as an impulsive move with 1: 1.5326, 2: 1.6377 and wave 3 is sub-divided into (i): 1.4300, (ii): 1.5880 and wave (iii) is still unfolding with (1): 1.4577, (2): 1.5448 and wave (3) is an extended 3rd with i: 1.5006, ii: 1.5383, wave iii: 1.3073, then wave iv ended at 1.3925 and wave v at 1.3073, wave (4) ended at 1.3925 and wave (5) has ended at 1.2765 which also marked the low of wave (iii) and wave (iv) has ended at 1.3835 and wave (v) as well as larger degree wave 3 has ended at 1.0075. The selloff from 1.2650 signals wave 4 has ended there and we are taking a view that the wave 5 could also have ended 0.8426, hence consolidation is seen with mild upside bias for rebound to 1.1400 (already met), then towards 1.1600.
On the downside, whilst initial pullback to 1.1370-80 is likely, reckon 1.1325-30 would limit downside and bring another rise later. Below said support at 1.1259 would defer and signal the wave iv correction is still in progress (probably a complex one), bring retracement of recent upmove to 1.1185-90 (50% Fibonacci retracement of 1.0833-1.1538), however, reckon downside would be limited to 1.1100-05 (61.8% Fibonacci retracement of 1.0833-1.1538), bring upmove in wave v later (probably in late Q3). Only a drop below previous resistance at 1.0988 (wave i top) would abort and signal recent upmove has ended, bring correction to 1.0950, then 1.0900 but support at 1.0833 should remain intact.
Recommendation: Buy again at 1.1330 for 1.1530 with stop below 1.1230.
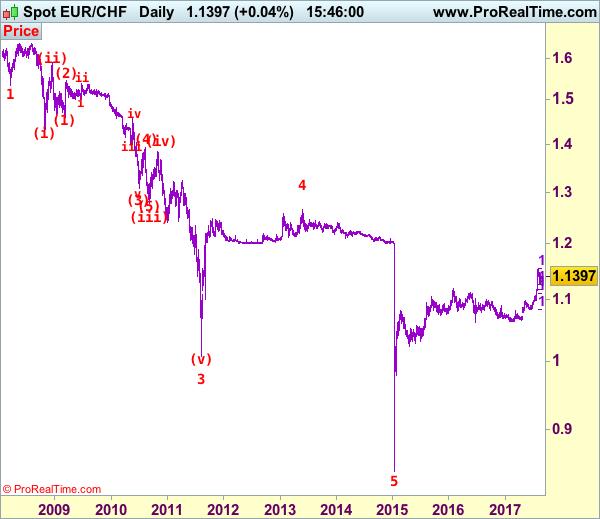
The long-term downtrend started from 1.9626 (Apr 1985) to 1.4166 (Sep 1995) is treated as wave (A) with A:1.6285 (Dec 1987), B: 1.9342 (May 1992) and C: 1.4166, then wave (B) ended at 1.6828 with A: 1.7147 (Feb 1997), B: 1.4398 (Sep 2001), C: 1.6828 (Nov 2007), therefore, wave (C) is now in progress with the breakdown indicated as above. This wave (C) already met indicated downside target at 1.1455/60 and 1.1300, it could have ended at 0.8426, consolidation with mild upside bias is seen for gain to 1.1000 and later towards 1.2000.
USD/CAD: Retail Sales
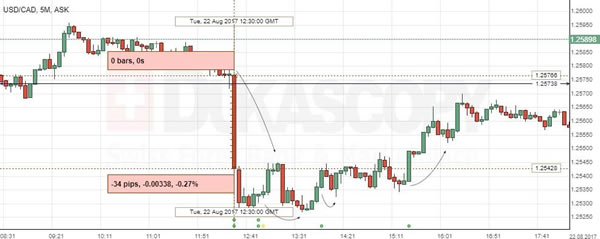
Tuesday's reports on Canadian retail sales and core retail sales were in overall strong enough to result in a 34 base points fall of the USD/CAD exchange rate. However, by the end of the session the pair returned to the levels seen before the release. The Greenback is expected to keep trying to get stronger footing against the CAD in the absence of Canadian economic data today.
Statistics Canada said that the country's retail sales growth slowed more than expected to 0.1% in June from a downwardly revised 0.5% rise in the prior month, while the core measure increased strongly 0.7% after 0.1% drop in the same period. The latest report confirmed expectations for the Bank of Canada to raise interest rates once again in October.
EUR/USD: German ZEW Economic Sentiment
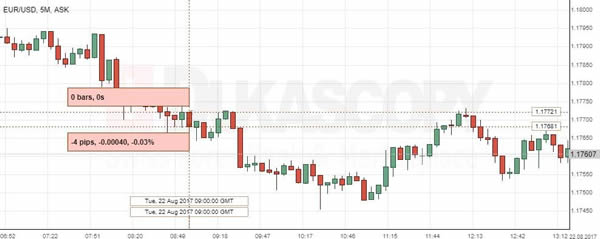
The Euro continued depreciation against the US Dollar, as the ZEW report showed notable weakening in the German investors' confidence. The EUR/USD fell initially just by 4 base points to continue the trading session below the 1.1768 level.
The Mannheim-based Centre for European Economic Research stated that its German Economic Sentiment Index came in at 10.0 points for August, showing a decline for the third consecutive month. A decrease was fuelled by concerns over the further expansion of the Germany's economy, as the scandal in the country's automobile sector was likely to affect the stability of growth. On the contrary, the current situation in the Euro zone was evaluated much higher than expected.
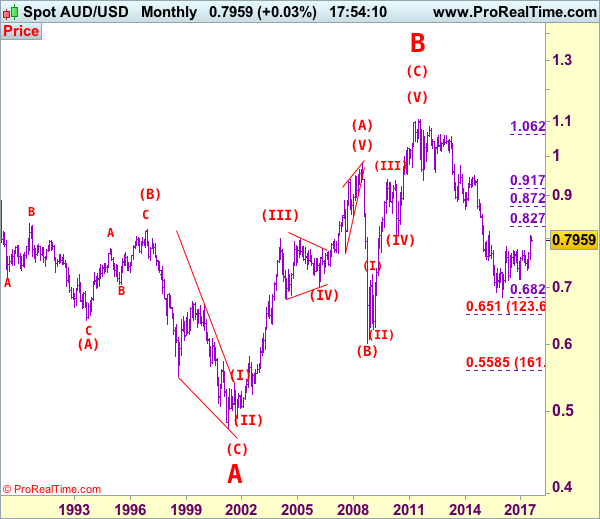
AUD/USD Elliott Wave Analysis
AUD/USD – 0.7885
Despite staging a brief bounce to 0.7963 last week, lack of follow through buying and the subsequent retreat suggest consolidation below this level would be seen and test of support at 0.7869 cannot be ruled out, however, reckon downside would be limited to 0.7820-25 and support at 0.7808 (last week’s low) should hold, bring further sideways trading. A drop below this support would signal another leg of corrective fall from 0.8066 temporary top is underway, bring retracement of recent upmove to 0.7760 (61.8% Fibonacci retracement of 0.7571-0.8066) and then test of previous resistance at 0.7712 but reckon downside would be limited to 0.7640-50.
We are keeping our count that top has been formed at 1.1081 (wave 5 of V) and major correction (A-B-C-X-A-B-C) has commenced, indicated downside targets at 0.7945 (61.8% Fibonacci retracement of entire rise from 0.6007-1.1081) and 0.7750 had been met and downside bias is seen for further weakness to 0.6800, then 0.6700 but reckon 0.6500 would hold from here.
Our preferred count is that the rally from 0.6007 to 0.7270 (7 Jan 2009) is marked as wave A, the retreat to 0.6248 (2 Feb 2009) is wave B and the subsequent upmove is labeled as wave C with wave (iii) and wave (iv) ended at 0.8265 and 0.7700 respectively and wave (v) as well as 3 ended at 0.9407, then wave 4 ended at 0.8066 (instead of 0.8578). The wave 5 has met our indicated projection target of 1.1060 and could ended at 1.1081, this level is now treated as the peak of wave (C) as well as larger degree wave B, hence major fall in wave C has commenced, our initial downside target at psychological support at 0.7000 has just been met and further weakness to 0.6500 would be seen later.
On the upside, expect recovery to be limited to 0.7925-30 and said resistance at 0.7963 should hold, bring further consolidation. A daily close above 0.7963-80 resistance area would signal first leg of corrective decline from 0.8066 top has ended, risk a stronger rebound to 0.8000, however, only a sustained breach above 0.8000 would bring retest of 0.8066, break there to signal medium term erratic rise from 0.6827 (2016 low) has resumed and extend gain to 0.8100, then towards previous resistance at 0.8163.
Recommendation: Stand aside for this week.
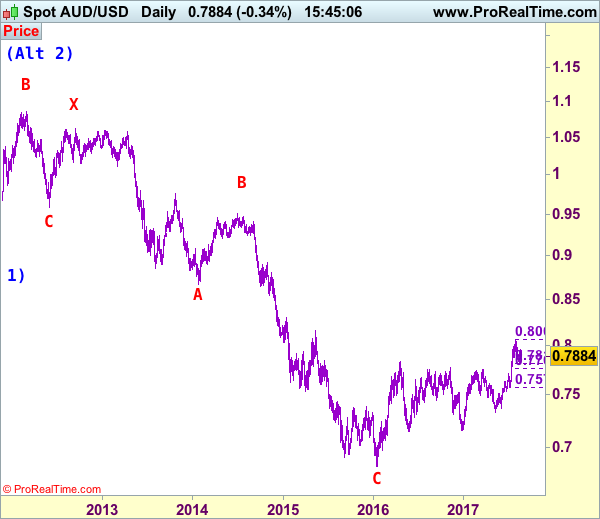
Our alternate count on the daily chart treated the top formed in 2008 at 0.9851 could be a larger degree wave I and was followed by a deep and sharp correction in wave II to 0.6007 and wave III is unfolding from there.
The long-term uptrend started from 0.4775 (2 Apr 2001) with an impulsive structure. Wave I is labeled as 0.4775 to 0.9851 (15 Jul 2008), wave II has ended at 0.6007 (Oct 2008) and wave III is still in progress which may extend further gain to 1.1265.
Forex Technical Analysis: EUR/USD, USD/JPY, GBP/USD
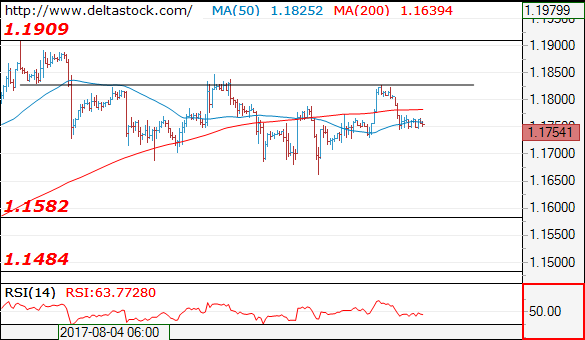
EUR/USD
Current level - 1.1754
My outlook here is bearish, for a break through 1.1730, towards 1.1660 low, en route to 1.1580 area.
| Resistance | Support | ||
| intraday | intraweek | intraday | intraweek |
| 1.1830 | 1.1909 | 1.1730 | 1.1580 |
| 1.1850 | 1.2000 | 1.1580 | 1.1480 |
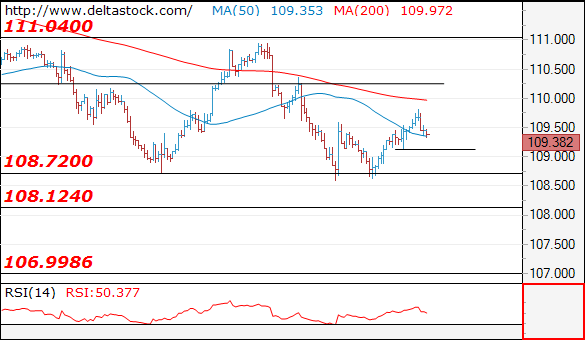
USD/JPY
Current level - 109.38
Yesterday's rise has been reversed at 109.80 and the bias is already negative, for a break through the trigger 109.10, towards 108.10 and 107.00.
| Resistance | Support | ||
| intraday | intraweek | intraday | intraweek |
| 109.80 | 111.00 | 109.10 | 108.10 |
| 110.30 | 112.20 | 108.10 | 107.00 |
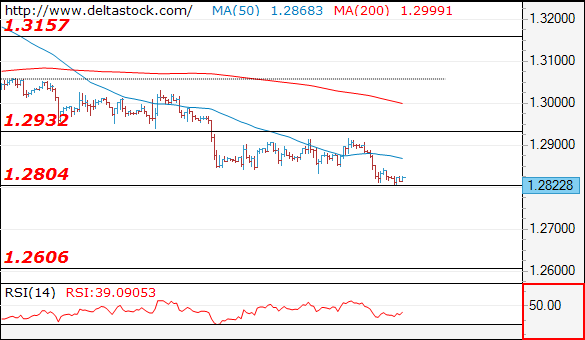
GBP/USD
Current level - 1.2822
The downtrend has been renewed and the bias is bearish, for a break through 1.2804, towards 1.2600 area. Crucial on the upside is still 1.2930 area.
| Resistance | Support | ||
| intraday | intraweek | intraday | intraweek |
| 1.2930 | 1.3260 | 1.2804 | 1.2804 |
| 1.3050 | 1.3500 | 1.2705 | 1.2606 |
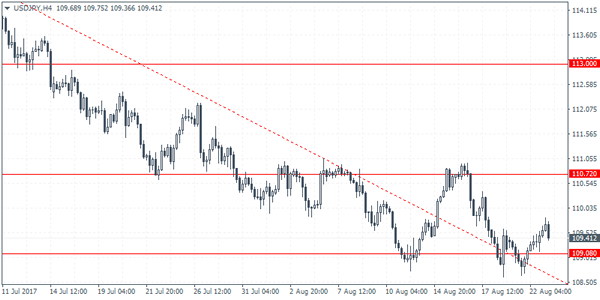
USDJPY Intraday Analysis
USDJPY (109.41): The USDJPY posted strong gains yesterday rising to a three day high and clearing above the price level of 109.15 which has acted as support so far. Currently, the weakness in the currency pair is seen pushing USDJPY lower back to 109.15. A rebound off this level could, however, keep the bias to the upside. The resistance level of 110.72 remains in focus currently as long as the support is held. In the event that USDJPY fails the support once again, we could expect to see the current ranging price action to continue.