Sample Category Title
Trade Idea: AUD/USD – Hold long entered at 0.7895
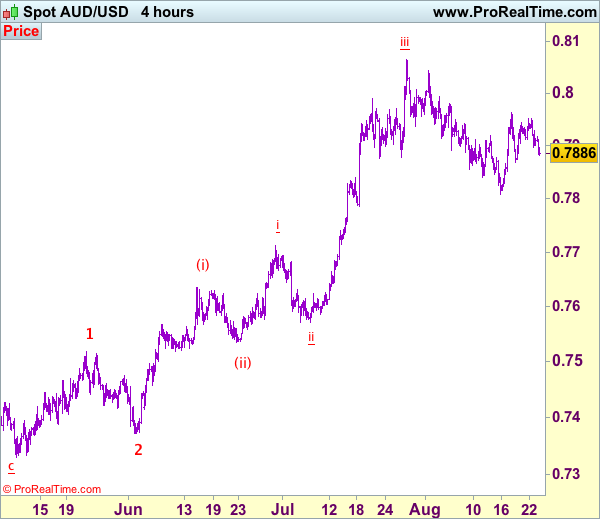
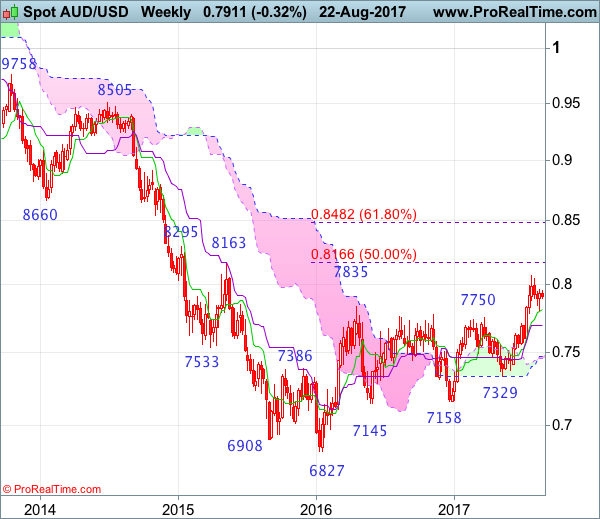
AUD/USD – 0.7886
Recent wave: Wave 5 ended at 1.1081 and major correction has commenced for fall to 0.7000 and then towards 0.6500-10
Trend: Near term up
Original strategy :
Bought at 0.7895, Target: 0.8050, Stop: 0.7865
Position: - Long at 0.7895
Target: - 0.8050
Stop: - 0.7865
New strategy :
Hold long entered at 0.7895, Target: 0.8050, Stop: 0.7865
Position: - Long at 0.7895
Target: - 0.8050
Stop:- 0.7835
Aussie’s retreat after faltering below resistance at 0.7963 suggests caution on our bullishness but as long as support at 0.7869 holds, prospect of another rebound remains, above indicated resistance at 0.7963 would add credence to our view that low has possibly been formed at 0.7808 early last week, bring a stronger rebound to 0.8000 but break there is needed to signal the pullback from 0.8066 top (wave iii peak) has ended at 0.7808 (wave iv) and bring eventual retest of this level.
In view of this, we are holding on to our long position entered at 0.7895. Below said support at 0.7869 would dampen this bullish scenario and suggest the rebound from 0.9808 has ended, bring another test of this level, below there would signal the wave iv correction from 0.8066 is still in progress for weakness to 0.7786 support, however, oversold condition should prevent sharp fall below 0.7750 and price should stay above i top at 0.7712, bring rebound later. We are keeping our latest bullish count that recent impulsive waves is unfolding as (1 2, (i)(ii), i ii) and may extend headway towards 0.8150.
On the 4-hour chart, the move from 0.8066 is the wave 5 with i: 0.8860, ii: 0.8315, wave iii is an extended move ended at 1.0183, iv: 0.9706 and wave v has ended at 1.1081 (also the top of entire wave 5). The subsequent selloff is the major correction which is unfolding as ABC-X-ABC and 2nd A leg has ended at 0.8848, followed by a-b-c wave B which ended at 0.9758, hence, 2nd C wave is now in progress and indicated downside target at 0.7000 and 0.6950 had been met, so further fall to 0.6710-20 cannot be ruled out.
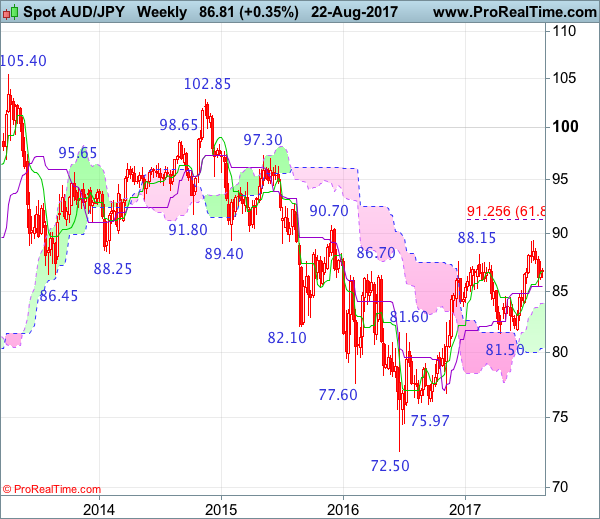
AUD/JPY Candlesticks and Ichimoku Analysis
Weekly
• Last Candlesticks pattern: Shooting star
• Time of formation: 13 Mar 2017
• Trend bias: Down
Daily
• Last Candlesticks pattern: Bearish engulfing pattern
• Time of formation: 16 Feb 2017
• Trend bias: Near term down
Although the Australian dollar fell quite sharply to 85.45 earlier this month, as the pair found support there and staged a rebound to 87.55, retaining our bullishness for another rebound, above said resistance at 87.55 would bring further gain to 88.00-10 but break of resistance at 88.70-75 is needed to signal the retreat from 89.40 has ended, bring another rise towards this level, otherwise, further choppy trading would take place. Looking ahead, only a break of this recent high would confirm medium term upmove from 2016 low of 72.50 has resumed and extend further gain to psychological resistance at 90.00, then towards previous chart resistance at 90.70.
On the downside, whilst initial pullback to 86.00 cannot be ruled out, reckon downside would be limited and said support at 85.45 should remain intact, bring another rebound later. A daily close below said support at 85.45 would suggest top has been formed at 89.40, bring retracement of recent rise to 85.00, then 84.50, however, near term oversold condition should limit downside to previous support at 83.75 and bring another rebound in late Q3.
Recommendation: Hold long entered at 85.75 for 88.00 with stop below 84.40.
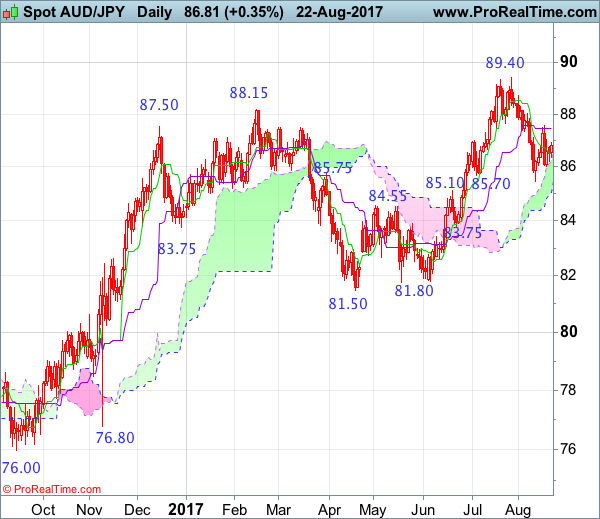
On the weekly chart, as aussie found support right at the Kijun-Sen and recovered, suggesting consolidation above support at 85.45 would be seen and as long as this level holds, prospect of another rebound to 87.55 is likely, however, break of 88.70-75 resistance is needed to signal the retreat from 89.40 has ended, bring retest of this level which is likely to hold on first testing. Looking ahead, above this recent high would confirm medium term upmove from 72.50 low (formed back in 2016) has resumed and may extend headway to psychological resistance at 90.00, then test of previous resistance at 90.70 but overbought condition should limit upside to 91.50-60 and price should falter below another previous chart resistance at 92.70, bring correction later.
On the downside, below said support at 85.45 (same level as current Kijun-Sen) would suggest a temporary top has possibly been formed at 89.40 and downside risk remains for retracement of recent upmove to bring further fall to 84.95-00, then test of the upper Kumo (now at 84.02) but reckon previous support at 83.75 would limit downside and price should stay above support at 82.55-60, bring rebound later.
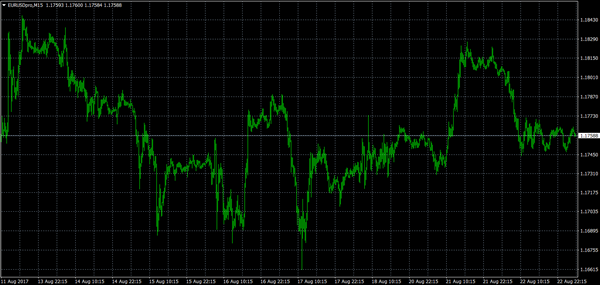
EURUSD Range Break Looms
The EURUSD pair is currently moving in a tight trading range, ahead of a key note speech from European Central Bank President Mario Draghi, who is speaking today, at the Lindau symposium, in Germany.
After falling sharply from the 1.1828 level, the euro is now trading between the 1.1745 to 1.1773 zone, with a technical range break-out looming.
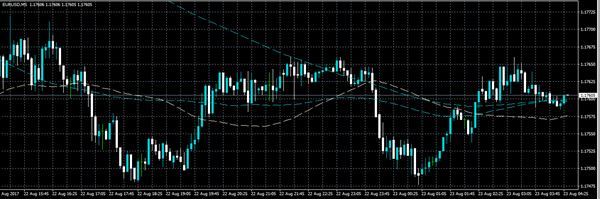
The EURUSD pair remains neutral in the short-term, with a slight negative intraday bias whilst trading below the 1.1770 level.
Key technical intraday support is found at 1.1731, 1.1713 and 1.1680. Higher time frame price closes below the 1.1713 level are now needed to accelerate the euro's downside.
Key intraday technical resistance for the EURUSD pair is found at 1.1770, 1.1783 and 1.1789. Higher time frame price closes above the 1.1789 level are now needed to accelerate the euro's upside.
USDJPY Attemping To Recover 110
The USDJPY is attempting to recover the key 110 level, with buyers pushing the pair to an intraday high of 109.82. A recovery in the U.S dollar index, and rising stocks markets are helping to underpin the greenback's recent strength.
At present, the pair is trading around the 109.50 level, after finding pullback support from USDJPY H1 time frame, 100 period moving average, found at the 109.37 level.
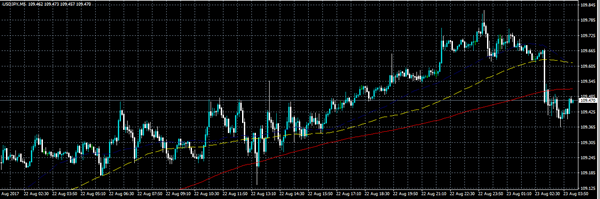
The USDJPY pair remains bearish on all-time frames, with the intraday outlook neutral, until the pair trades firmly above the weekly pivot point, found at 109.59.
Intraday resistance above the 109.59 level is found at the daily high, at 109.82, the psychological 110 level, and the former swing high, at 110.39.
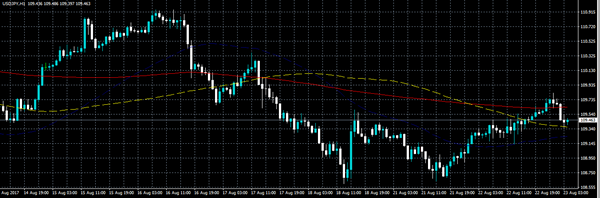
To the downside, the USDJPY pivot point is found at 109.46, with the 100-hour moving average adding further support, at 109.37.
Below the 109.37 level, the former swing low adds intraday support, at 109.13, as does the key 108.90 level.
PMI Data In The Headlines On Wednesday
Economic data will continue to drive headlines on Wednesday, with IHS Markit scheduled to release a batch of PMI data covering the United States and Eurozone. At the same time, monetary policy will also be on the radar ahead of the annual Jackson Hole Symposium.
At 07:00 GMT, European Central Bank (ECB) President will deliver a speech that will be closely watched by the financial markets. The central bank is widely expected to signal for policy tightening in the not-too-distant future after the euro area economy surpassed expectations through the first half of 2017.
On the data front, Markit will begin releasing its monthly purchasing managers' index (PMI) beginning at 07:00 GMT. The France manufacturing, services and Composite PMI reports are scheduled at 07:00 GMT. Over the next hour, Markit will unveil PMI data for Germany and the broader euro area.
Germany's Composite index, which measures manufacturing and services activity, is forecast to hold steady at 54.7. The Eurozone Composite PMI is expected to come in at 55.4, unchanged from the previous month.
The North American session begins with commentary from Federal Open Market Committee (FOMC) member Robert Kaplan, who will be participating in a moderated Q&A session in Texas.
At 13:45 GMT, Markit will release the latest batches of US PMI data. The nation's manufacturing industry is forecast to gather pace in August. Meanwhile, the services sector is expected to grow at a moderate pace.
In a separate report, the Commerce Department will issue new home sales data for the month of July. New home sales, which are a much more volatile segment of the housing market, are expected to rise 0.3% from June to reach a seasonally adjusted annual pace of 612,000.
Energy traders will also keep a close eye on weekly inventory data from the US Energy Information Administration, which are due at 14:30 GMT.
EUR/USD
The euro lost momentum on Tuesday, with the EUR/USD falling back below 1.1800. The losses were triggered by a resurgent US dollar, which rose sharply against a basket of world peers. The pair faces immediate support at 1.1661, which is the low from 17 August. Immediate resistance is located at 1.1828, which is the high from 11 August.
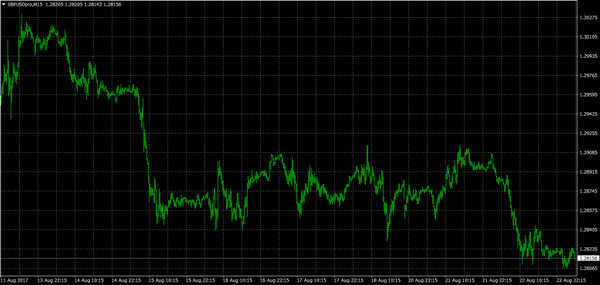
GBP/USD
A stronger dollar weighed on the British pound on Tuesday, as cable fell to fresh eight-week lows. The GBP/USD briefly touched 1.2805 before consolidating slightly higher. A clean break below 1.2810 would favour a bearish extension that could send prices back down towards 1.2700.
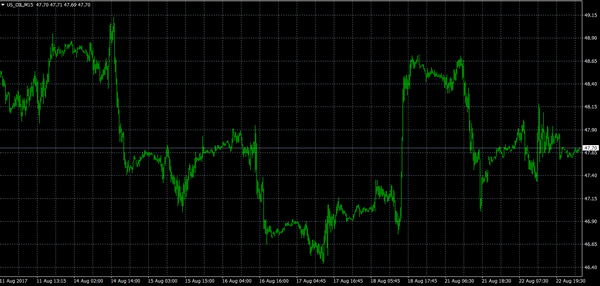
WTI OIL
Oil prices stabilized on Tuesday after a volatile start to the week. US West Texas Intermediate (WTI) was trading lower during the Asian session, with prices hovering around $47.70 a barrel. The outlook on crude is neutral, with the RSI hovering below 50 and the MACD just above the zero line.
ECB President Mario Draghi Is Due To Speak Today
.
Market movers today
ECB President Mario Draghi is due to speak today at 9:00 CET, giving a key note speech at the Lindau Nobel Laureate Meetings. We expect him to come back from the summer holidays with a dovish message – one that is likely to be delivered at Jackson Hole on Friday also. See Euro Area Research: Draghi returns to Jackson Hole with a dovish message, 18 August 2017.
Euro Flash PMI are also due for release. After a 10-month streak of rising manufacturing PMI in the euro area, we saw a decline from 57.4 in June to 56.6 in July. We saw declines in both activity and the leading order-inventory indicator. The appreciating euro is also likely to become a headwind for export orders, so we estimate manufacturing PMI has fallen to 56.2. Services PMI remained at 55.4 between June and July but has also started to show some exhaustion since April. While we expect services PMI to show a small decline to 55.2, we emphasise that PMIs remain at very strong levels, still pointing towards solid growth in Q3.
In the US, the Markit PMIs for both manufacturing and service are due for release. In July, manufacturing PMI took a large jump to 53.3, up from 52.0 in June, ending a five-month streak of declines. We expect the August figure to have remained around the 53.3 level. Service PMIs have shown a rising trend over the past four months, climbing from 52.8 in March to 54.7 in July. We expect the August figure to continue upwards to 55.0.
Other events will be the Fed's Robert Kaplan speaking (voter, dove), US new home sales and euro area consumer confidence.
Selected market news
Risk sentiment improved yesterday supported by reports that the Trump administration and law makers are making progress on tax reform plans. US stock markets mirrored the positive development in Europe with S&P500 and Dow Jones closing 0.99% and 0.90% higher, respectively, while the USD gained versus JPY in the FX market . With Steve Bannon leaving the White House last week, the odds of less infighting within the white House and more politics is likely to have improved. Price actions yesterday indicate that expectations of any fiscal boost are low and this could potentially be a posit ive for risk markets in coming months if the administration succeeds with a tax reform.
The Trump administ ration raised the pressure on Russia and China yesterday to isolate North Korea by imposing sanctions (financial rest rict ions) on Chinese and Russian companies and individual persons it accused of conspiring with North Korea to avoid sanctions, and thereby assisting Nort h Korea's development of nuclear weapons and ballistic missiles.
Italian government bonds underperformed significantly yesterday with yields on the 10-year benchmark government bond trading 7bp higher versus Germany. The negative market reaction follows an interview with the Italian publication Libero Quotidiano, where Silvio Berlusconi argued in favour of the introduction of a national parallel currency, to help Italy regain monetary sovereignty. Berlusconi said that such a parallel currency would be consistent with European Treaties, despite possible opposition from other countries. The adverse market react`ion to this story underscores that Italy remains a weak spot in the euro area. For more details on Italy,
Mixed Data From Europe Invites USD Bulls
On Tuesday, Germany's monthly economic sentiment index came in below market expectations. The ZEW Survey for Economic Sentiment cited a “strong decrease in expectations” as the index fell to 10 in August, down from 17.5 in July – causing a selloff in EUR.
News was rosier in the UK with the country posting its first July surplus in 15 years and defying expectations of another deficit. The Office for National Statistics reported a modest surplus in July. Whilst the data is positive, the markets reacted with a selloff in GBP likely indicating such positive news is an aberration.
In the US, markets reacted positively amid growing speculation that Trumps administration is gaining momentum in its efforts to reform the US tax code. It is on this issue that Trump hopes to finally secure a major legislative achievement and rebuild relations with his party. However, markets reacted negatively to comments made by Trump, late on Tuesday, that he would force a government shutdown if he does not receive funding to build his “infamous” wall.
The markets are focusing on the Jackson Hole conference later this week with scheduled speeches from Fed Chair Yellen and ECB President Draghi. The markets are looking for clues on the FOMC's monetary policy and any new policy messages from Global Central Bankers.
EURUSD lost 0.5% on Tuesday, trading down to 1.17446. Currently, EURUSD is trading around 1.1760.
USDJPY gained 0.45% to trade as high as 109.54 on Tuesday and continued higher overnight, to reach a high of 109.821 in early Wednesday trading. Currently, USDJPY is trading around 109.40.
GBPUSD lost more than 0.5% on Tuesday. Currently, GBPUSD is trading around 1.2820.
Gold recovered from lows of $1,281.96 on Tuesday to currently trade around $1,287.
WTI was little changed overnight and currently trades around $47.70pb.
At 08:00 BST, A keynote speech will be made by ECB President Mario Draghi at the opening ceremony of the 6th Lindau Meeting on Economic Sciences in Lindau, Germany. Markets will be interested to hear any clues to ECB Economic Policy updates.
At 09:00 BST, Markit Economics will release Eurozone Manufacturing, Services and Composite PMI for August. Sentiment is expected to remain above 50 but forecasts are calling for a slight reduction from the previous release.
At 14:45, Markit Economics will release US Manufacturing, Services and Composite PMI for August. Similar to Eurozone PMI, markets are expecting releases in line with the previous release, with Services seeing a slightly better release of 54.9 compared to the previous 54.7.
At 15:30 BST, the US Energy Information Administration will release Crude Oil Stocks change for the week of August 18th. Another drawdown is expected of -3.375M, less than the previous -8.945M.
AUD/USD Candlesticks and Ichimoku Analysis
Weekly
• Last Candlesticks pattern: Long white candlestick
• Time of formation: 10 Jul 2017
• Trend bias: Up
Daily
• Last Candlesticks pattern: Long white candlestick
• Time of formation: 18 Jul 2017
• Trend bias: Up
Despite staging a strong rebound from 0.7808 to 0.7963, as aussie continued meeting strong resistance above 0.7950 area and has retreated, suggesting further consolidation would take place and weakness to 0.7835-40 cannot be ruled out, however, only break of said support at 0.7808 would signal the corrective fall from 0.8066 temporary top is still in progress for retracement of recent upmove to 0.7760 (61.8% Fibonacci retracement of 0.7571-0.8066) but reckon downside would be limited to previous resistance at 0.7712 and 0.7670-75 would hold from here, bring another rebound later.
On the upside, whilst recovery to 0.7915-20 cannot be ruled out, reckon said resistance at 0.7963 would limit upside and bring another decline. Only a daily close above 0.7963 would suggest low is formed, bring test of resistance at 0.7980 but a sustained breach above 0.8000 is needed to signal the pullback from 0.8066 has ended, bring retest of this level later. Looking ahead, a break above 0.8066 would confirm upmove has resumed and extend the medium term erratic rise from 0.6827 to 0.8163 resistance, then 0.8200, however, loss of near term upward momentum should limit upside and reckon another previous resistance at 0.8295 would hold.
Recommendation: Stand aside for now.

On the weekly chart, although aussie found support just above the Tenkan-Sen and recovered from 0.7808 last week, reckon upside would be limited to 0.7960-65 and as long as resistance at 0.7980 holds, near term downside risk remains for the retreat from 0.8066 temporary top to bring retracement of recent upmove, below 0.7801-08 (current level of the Tenkan-Sen and previous support) would bring correction to 0.7750, however, a sustained breach below previous resistance at 0.7712 is needed to signal a temporary top has been formed, bring test of the Kijun-Sen (now at 0.7698), then towards 0.7600-10 but support at 0.7571 should contain weakness.
On the upside, expect recovery to be limited 0.7915-20 and resistance at 0.7963 should hold, bring another retreat. Above 0.7980 resistance would revive near term bullishness and suggest the pullback from 0.8066 has ended, bring retest of this level, break there would extend recent upmove from 0.6827 low to previous resistance at 0.8163, then 0.8250, however, near term overbought condition should limit upside to another previous resistance at 0.8295 and price should falter below 0.8390-00, bring retreat later.
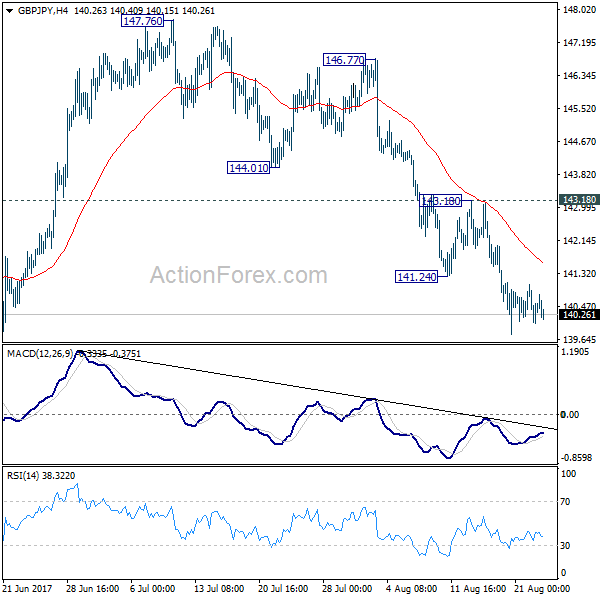
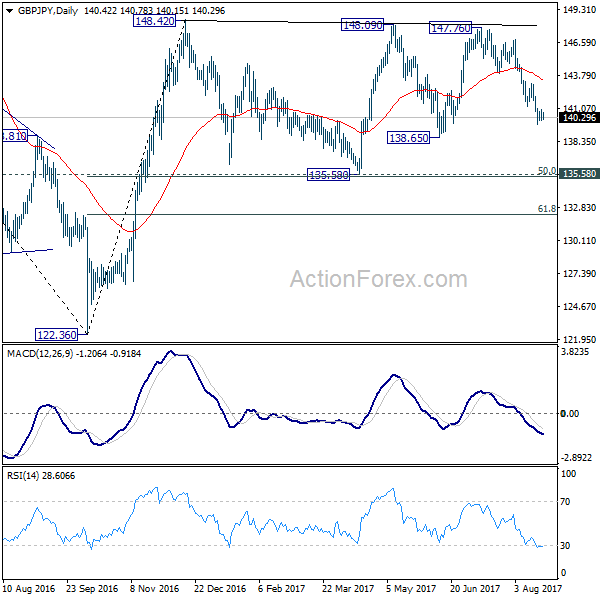
GBP/JPY Daily Outlook
Daily Pivots: (S1) 140.00; (P) 140.51; (R1) 140.98; More
No change in GBP/JPY's outlook. With 143.18 minor resistance intact, fall from 147.76 is still progress for 138.65 support first. Break there will extend the decline to 135.58 key support level. At this point, price actions from 148.42 are seen as a sideway consolidation pattern. Hence, we'll expect strong support from 135.58 to contain downside and bring rebound. Nonetheless, break of 143.18 resistance is needed to indicate short term bottoming first. Otherwise, near term outlook will remain bearish in case of recovery.
In the bigger picture, the sideway pattern from 148.42 is extending with another leg. We'd expect strong support from 135.58 and 50% retracement of 122.36 to 148.42 at 135.39 to contain downside. Medium term rise from 122.36 is still expected to resume later. And break of 38.2% retracement of 196.85 to 122.36 at 150.43 will carry long term bullish implications. However, firm break of 135.58/39 will dampen the bullish view and turn focus back to 122.36 low.
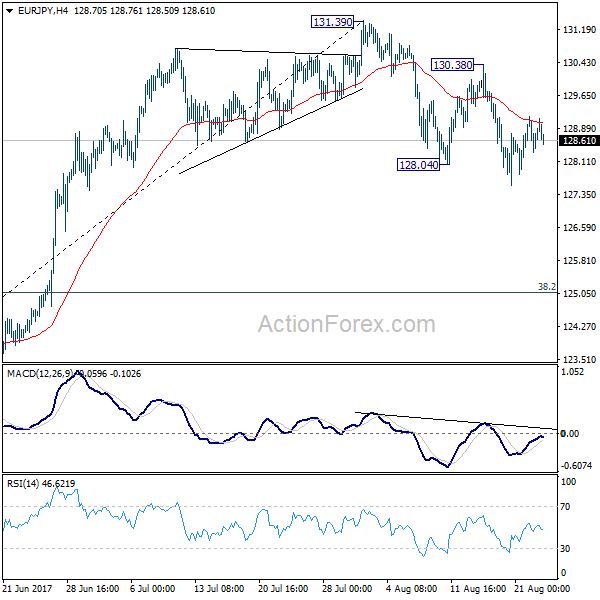
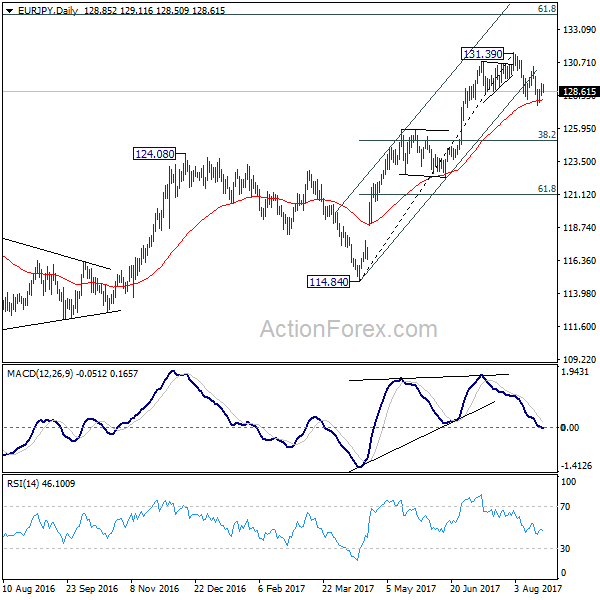
EUR/JPY Daily Outlook
Daily Pivots: (S1) 128.39; (P) 128.78; (R1) 129.25; More...
No change in EUR/JPY's outlook. The decline from 131.39 is still in progress. Such decline is seen as correcting whole rise from 141.84 with break of channel support. Deeper decline would be seen to 38.2% retracement of 114.84 to 131.39 at 125.05 before completion. On the upside, break of 130.38 resistance is needed to confirm completion of the pull back. Otherwise, deeper decline is expected even in case of recovery.
In the bigger picture, the down trend from 149.76 (2014 high) is completed at 109.03 (2016 low). Current rally from 109.03 should be at the same degree as the fall from 149.76 to 109.03. Further rise is expected to 61.8% retracement of 149.76 to 109.03 at 134.20. Sustained break there will pave the way to key long term resistance zone at 141.04/149.76. Medium term outlook will remain bullish as long as 124.08 resistance turned support holds. However, firm break of 124.08 will argue that rise from 109.03 is completed and turn outlook bearish.