Sample Category Title
Eurozone PPI rises 1.6% mom, energy prices drive monthly gains
Eurozone producer prices rebounded more than expected in November, with PPI rising 1.6% mom, surpassing market forecasts of 1.5% mom. On an annual basis, PPI improved to -1.2% yoy from -3.3% in October, slightly better than the anticipated -1.3% yoy. The data highlights the ongoing influence of energy price volatility on the region's industrial sector.
Breaking down the monthly changes, Eurozone's energy prices surged by 5.4% mom, providing the largest contribution to the overall increase. Intermediate goods saw a modest decline of -0.1% mom, while prices for capital goods and non-durable consumer goods remained stable. Durable consumer goods recorded a slight decline of -0.2% mom.
At the EU level, industrial producer prices climbed by 1.7% mom but fell -1.1% yoy. Among member states, Bulgaria (+4.9%), Ireland (+4.5%), and Sweden (+4.2%) posted the highest monthly gains in producer prices, reflecting the energy-driven rise. Conversely, Estonia, Cyprus (-1.4% each), Slovakia (-0.5%), and Luxembourg (-0.4%) saw the sharpest declines, highlighting regional disparities.
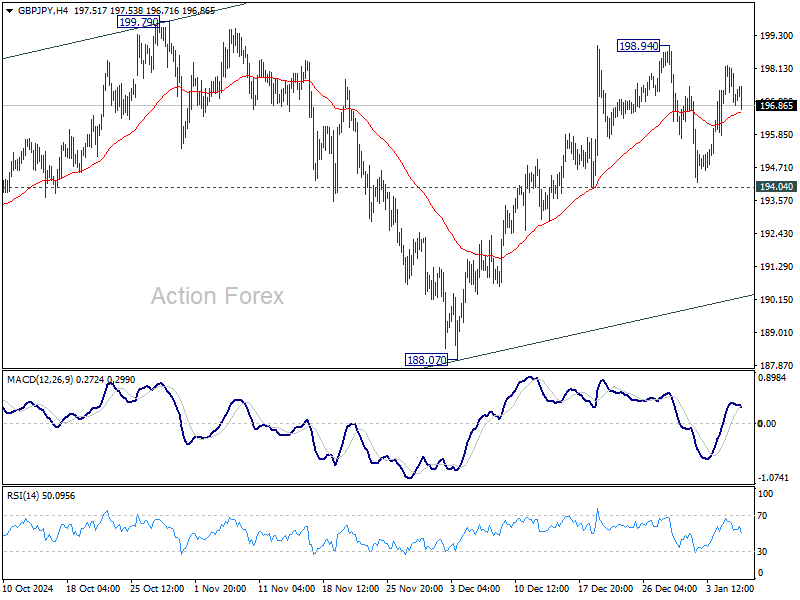
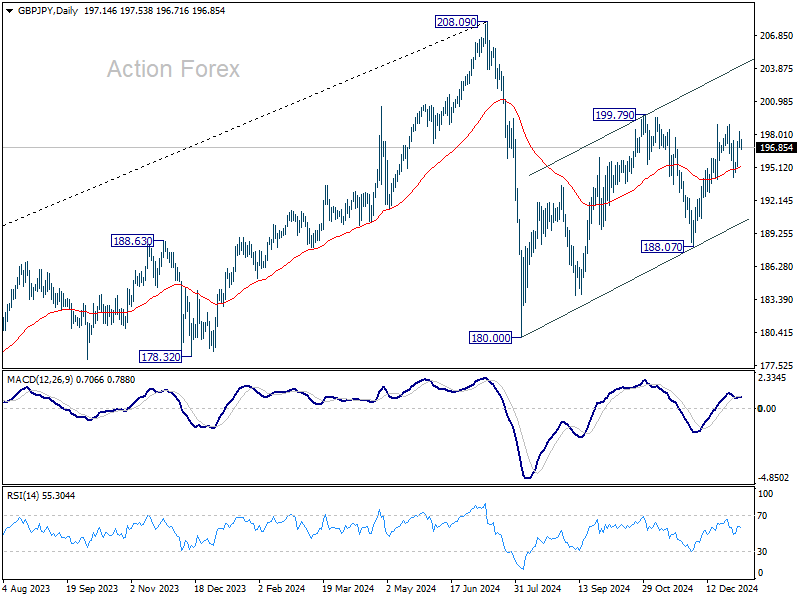
GBP/JPY Daily Outlook
Daily Pivots: (S1) 196.65; (P) 197.46; (R1) 198.03; More...
GBP/JPY is staying in range trading below 198.84 and intraday bias remains neutral. Further rally is expected with 194.04 support intact. Break of 198.94 will resume the rise from 188.07, as a leg of the corrective pattern from 180.00, and target channel resistance (now at 204.05). However, firm break of 194.04 will turn bias to the downside for 188.07 support instead.
In the bigger picture, price actions from 208.09 are seen as a correction to whole rally from 123.94 (2020 low). The range of consolidation should be set between 38.2% retracement of 123.94 to 208.09 at 175.94 and 208.09. However, decisive break of 175.94 will argue that deeper correction is underway.
EUR/JPY Daily Outlook
Daily Pivots: (S1) 162.88; (P) 163.72; (R1) 164.22; More...
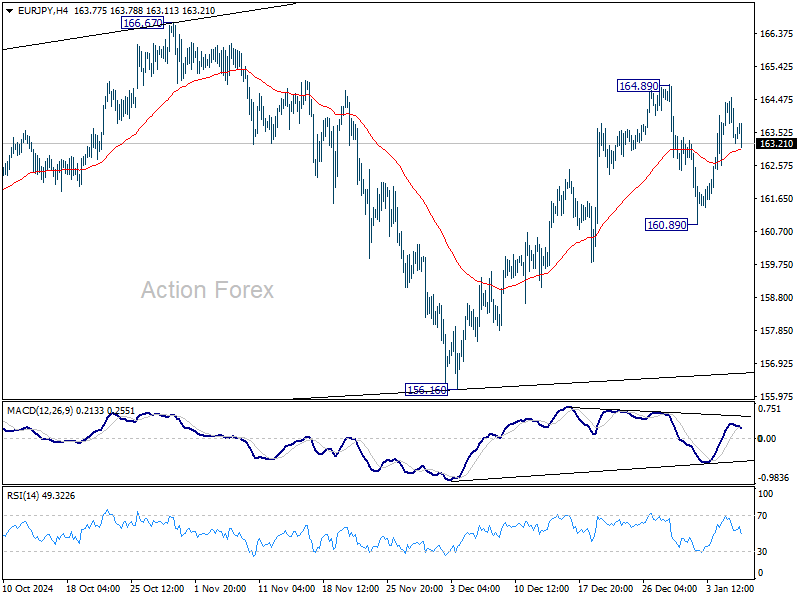
EUR/JPY retreated ahead of 164.89 resistance and intraday bias is turned neutral for now. Outlook is unchanged that corrective pattern from 154.40 is extending. Break of 164.89 will target 166.67, and above. This will remain the favored case as long as 160.89 support holds.
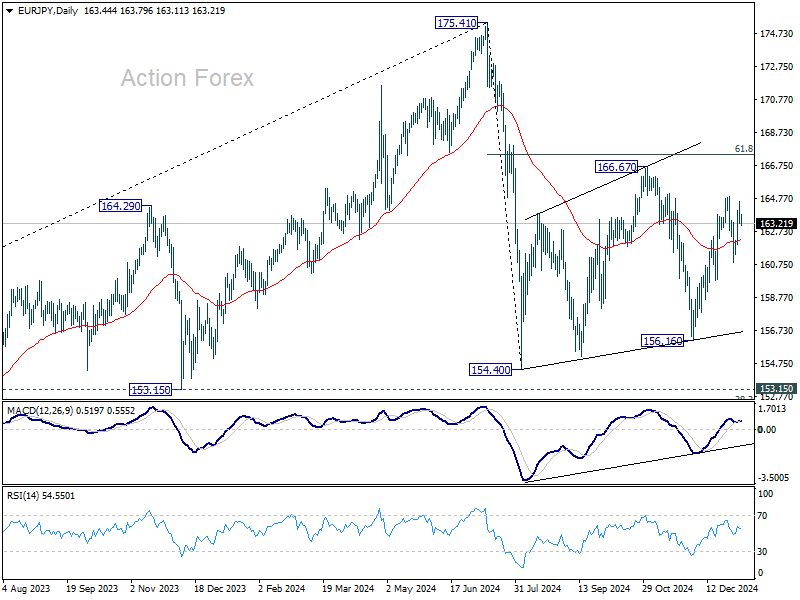
In the bigger picture, price actions from 175.41 are seen as correction to rally from 114.42 (2020 low). The range of consolidation should have been set between 38.2% retracement of 114.42 to 175.41 at 152.11 and 175.41 high. However, decisive break of 152.11 would argue that deeper correction is underway.
EUR/GBP Daily Outlook
Daily Pivots: (S1) 0.8280; (P) 0.8293; (R1) 0.8300; More...
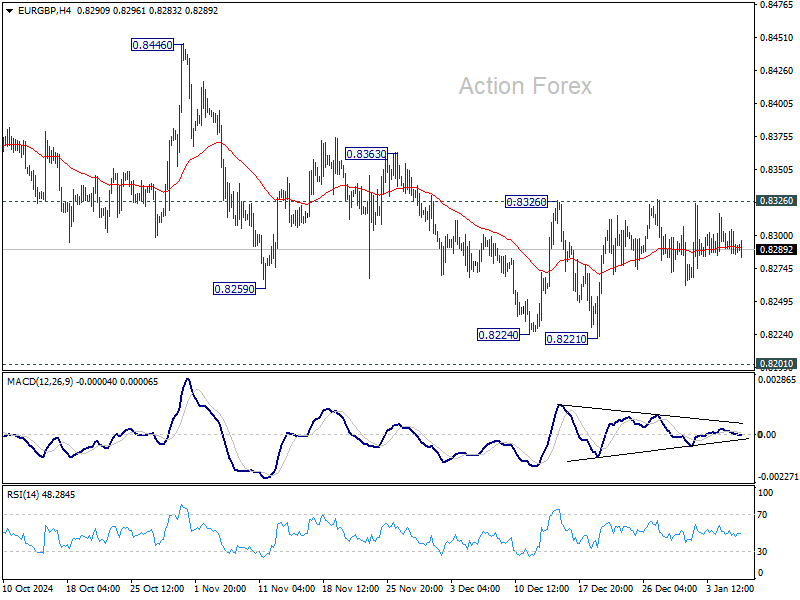
EUR/GBP is staying in consolidations and intraday bias remains neutral. On the upside, firm break of 0.8326 resistance will confirm short term bottoming at 0.8221, ahead of 0.8201 key support. Intraday bias will be turned back to the upside for 0.8446 structural resistance next.
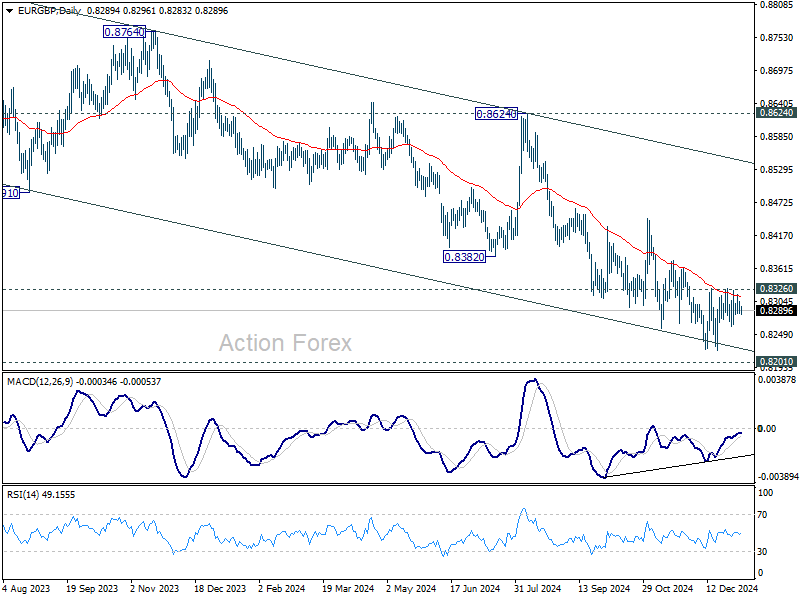
In the bigger picture, focus remains on whether 0.8201 key support (2022 low) is strong enough to complete the whole down trend from 0.9267 (2022 high). In any case, medium term outlook will be neutral at best until decisive break of 0.8624 key resistance. Risk will stay on the downside even in case of strong rebound.
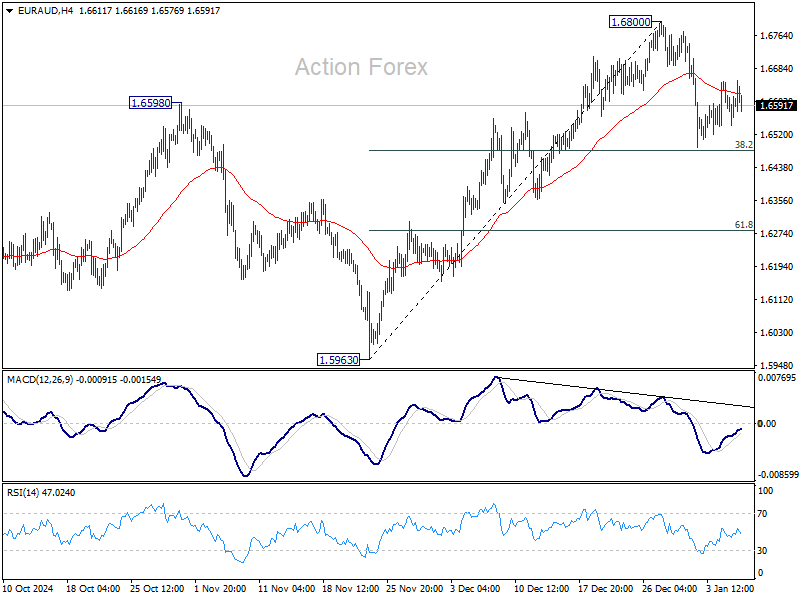
EUR/AUD Daily Outlook
Daily Pivots: (S1) 1.6542; (P) 1.6597; (R1) 1.6649; More...
Intraday bias in EUR/AUD stays neutral for the moment. Corrective pattern from 1.6800 could extend further. But strong support could be seen from 38.2% retracement of 1.5963 to 1.6800 at 1.6480 to bring rebound. Near term risk will stay mildly on the downside as long as 1.6800 resistance holds, in case of extended recovery. Firm break of 1.6480 will bring deeper correction 61.8% retracement at 1.6283.
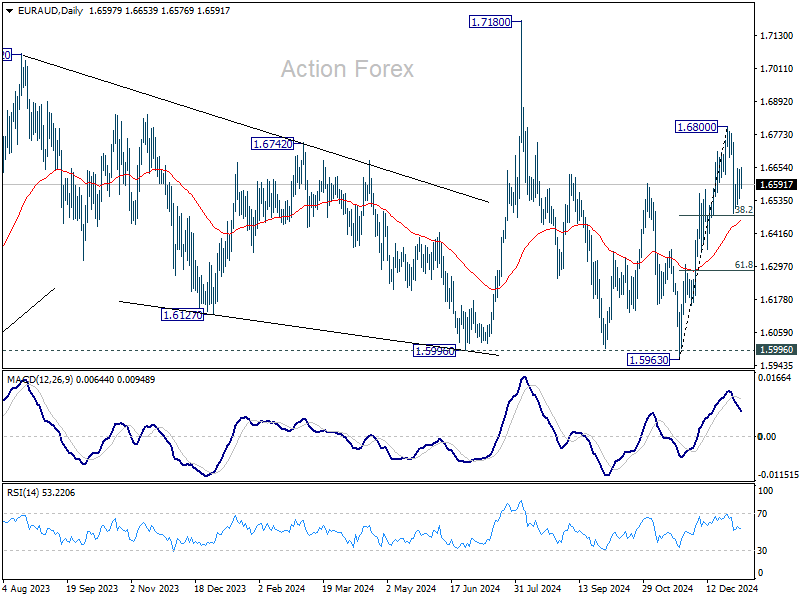
In the bigger picture, EUR/AUD is holding on to 1.5996 key support despite brief breach. Larger up trend from 1.4281 (2022 low) is still in favor to resume through 1.7180 at a later stage. Nevertheless, sustained break of 1.5995 will indicate that such up trend has completed and deeper decline would be seen.
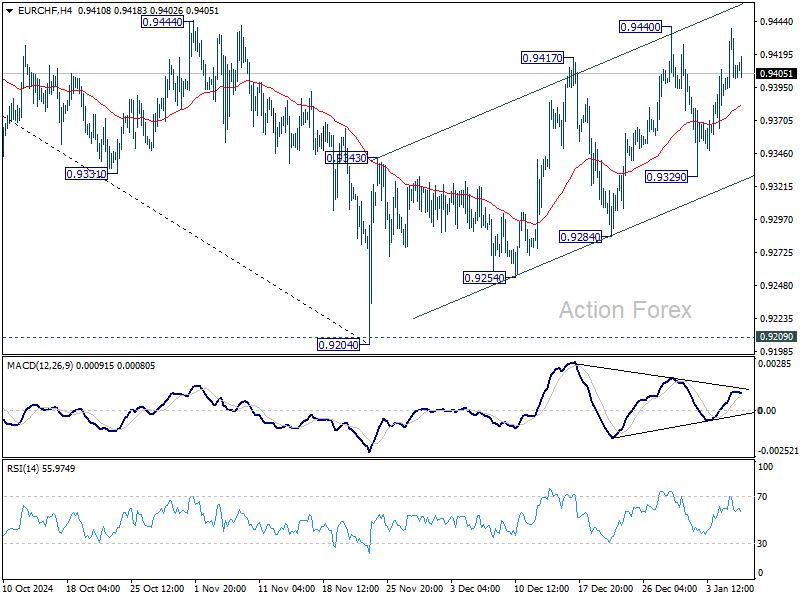
EUR/CHF Daily Outlook
Daily Pivots: (S1) 0.9378; (P) 0.9409; (R1) 0.9437; More....
EUR/CHF retreated ahead of 0.9440 resistance and outlook is unchanged. Corrective rebound from 0.9204 could still extend higher through 0.9440. But upside should be limited by 0.9481 fibonacci resistance. On the downside, firm break of 0.9329 support will argue that the correction has completed, and bring retest of 0.9204 low.
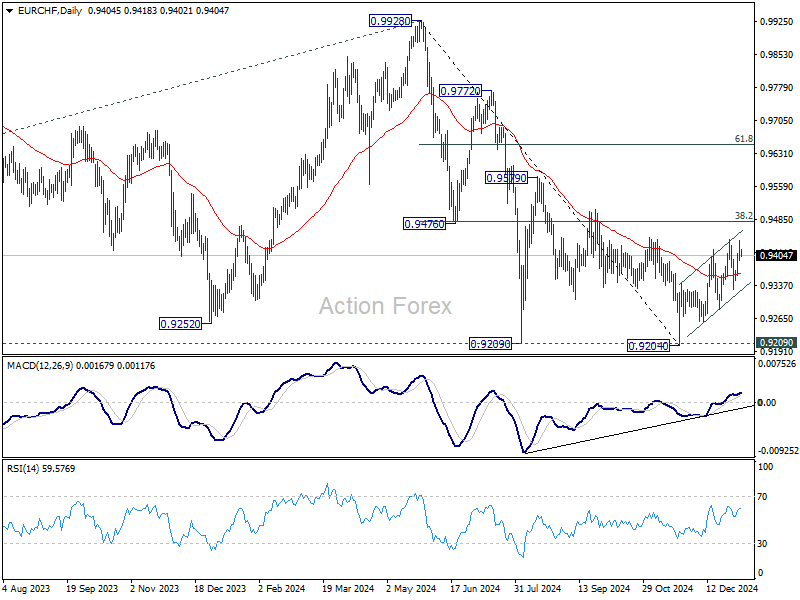
In the bigger picture, while rebound from 0.9204 might extend higher, strong resistance could be seen from 38.2% retracement of 0.9928 to 0.9204 at 0.9481 to limit upside. Down trend from 0.9928 (2024 high) is still in favor to resume through 0.9204/9 support zone at a later stage.
Hang Seng Index: Transforming into a Medium-Term Bearish Trend Despite Improving Services PMI from China
- Sentiment remains fragile in China and Hong Kong stock market even China services activities have improved in December.
- Weak market breadth and a persistent bearish trend of the Chinese yuan since November has added to more woes to the Hang Seng Index.
- Watch the 19,700/20,130 key medium-term resistance on the Hang Seng Index.
Since our last publication, the Hong Kong benchmark stock indices (a proxy for international investors and traders to get exposure into China equities) have wobbled where market participants have lost patient over China’s top policy makers’ rhetoric of the “yet to materialise” forceful fiscal stimulus measures to negate the ongoing deflationary spiral in the Chinese economy.
The Hang Seng Index has broken below its 19,700 key medium-term support and shed 5% to print an intraday low of 19,111 at this time of the writing.
Start of the start of the new year, China and Hong Kong bench stock indices are the worst performers against the rest of the world as both of them recorded losses of 2.22% and 2.58% respectively despite services activities have started to show signs of growth in December as indicated by the latest the official NBS non-manufacturing PMI and privately complied Caixin services PMI data.
Weak market breadth
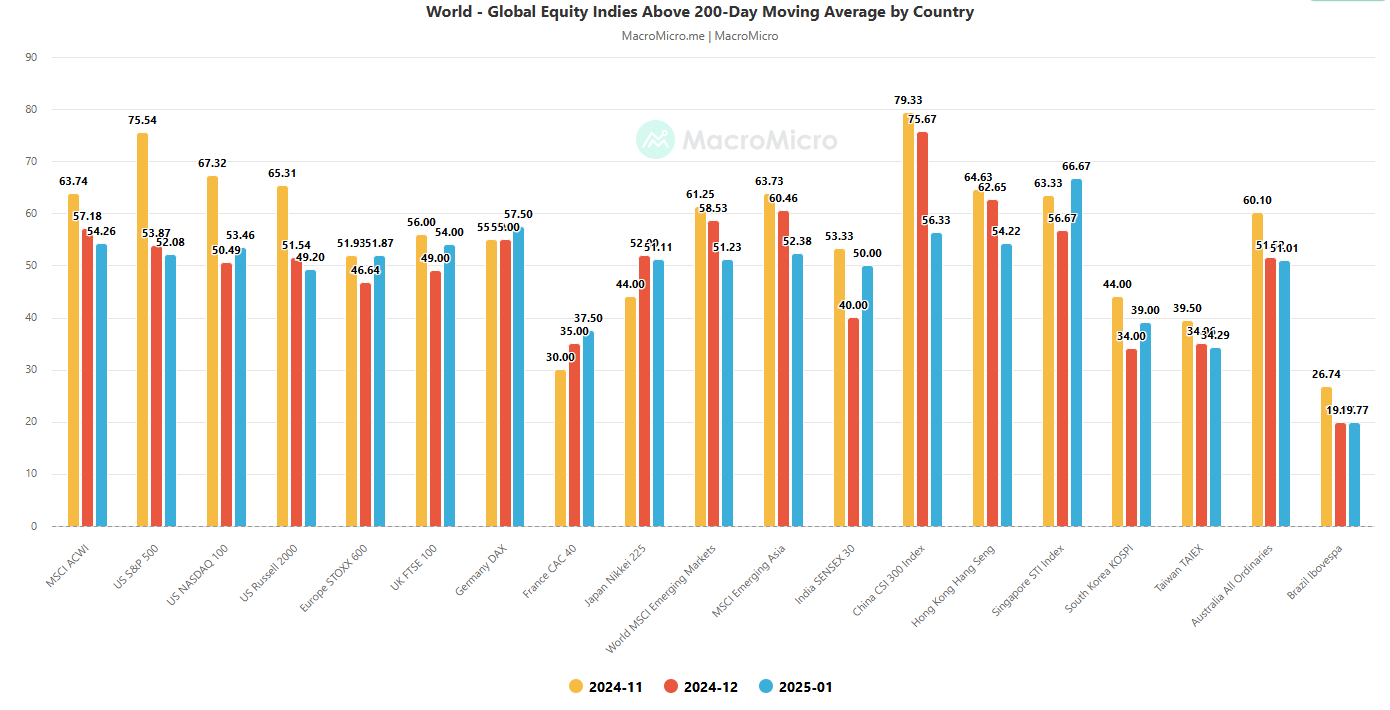
Fig 1: Major stock indices percentage of component stocks above 200-day MA as of 7 Jan 2025 (Source: MacroMicro, click to enlarge chart)
Sentiment has remained fragile as the number of component stocks of the two key benchmark stock indices; China’s CSI 300 and Hong Kong’s Hang Seng Index that are trading above their respective long-term 200-day moving averages have declined steadily since November 2024.
The percentage of CSI 300 component stocks trading above their respective 200-day moving averages have slipped to 56% in January from 79% previously recorded in November, and the Hang Seng Index also showed a similar dire fate where the percentage of its component stocks declined to 54% currently from 64% in November (see Fig 1).
A persistent weak yuan has more negative impact on China and Hong Kong stock markets
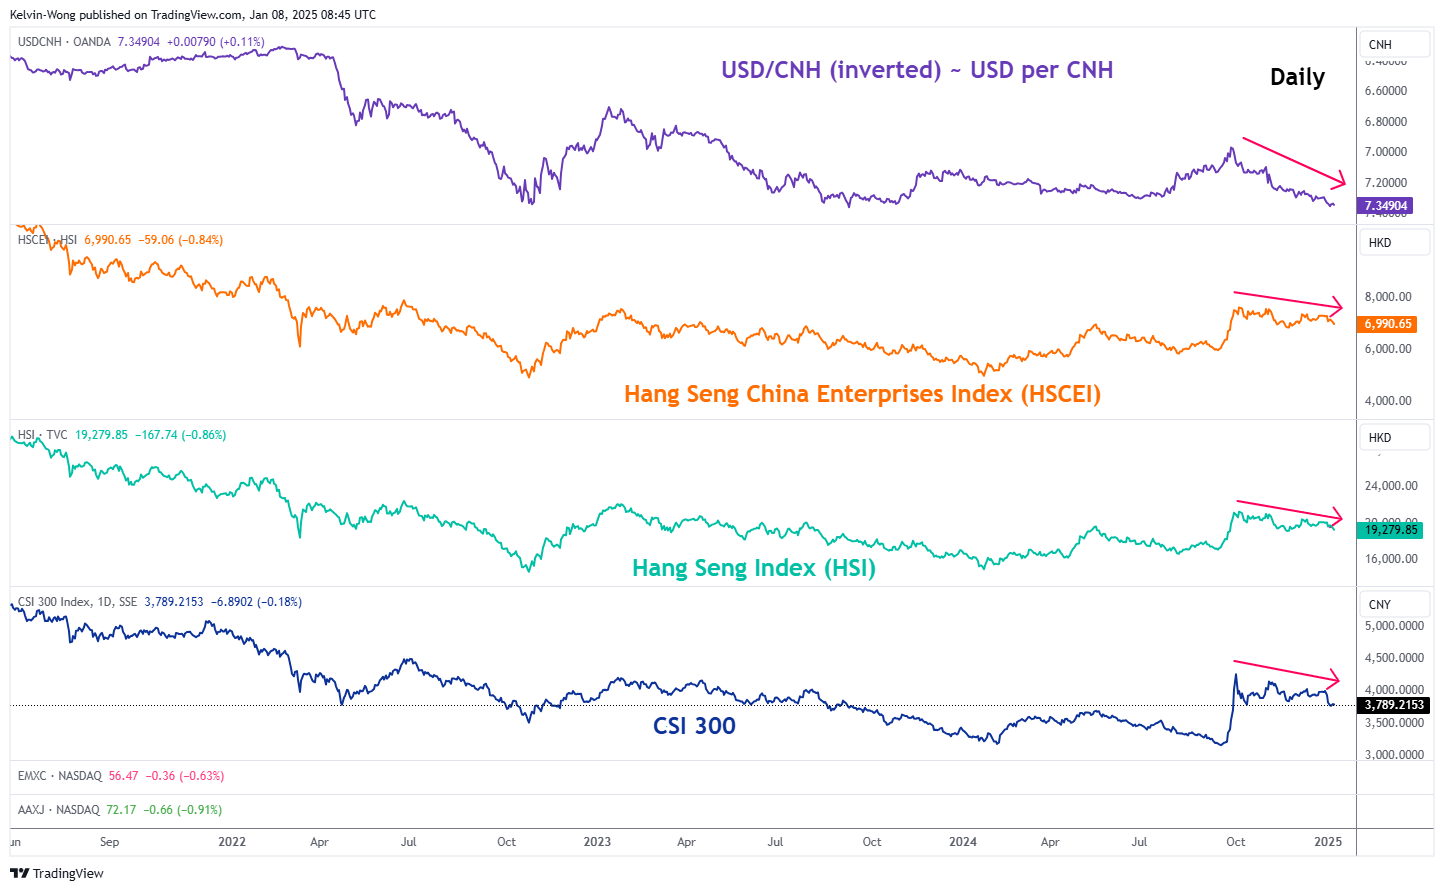
Fig 2: USD/CNH major trend with HSCEI, HSI & CSI 300 as of 8 Jan 2025 (Source: TradingView, click to enlarge chart)
Since the outcome of the US presidential election on 6 November, the offshore Chinese yuan has depreciated by 3.7% against the US dollar to a two-year low where the USD/CNH exchange rate its now coming close to a major swing high of 7.3750 printed on 25 October 2022.
China policy makers have “deliberately” allow the yuan to weaken to offset the potential incoming higher trade tariffs from US President-elect Trump’s hawkish trade policy towards US major trading partners that includes China where he has proposed to implement 60% additional tariffs on China’s exports to the US.
Even though, a weaker yuan on a trade weighed basis may allow China to maintain its share of exports but it may create a negative feedback loop into the stock markets of China and Hong Kong as hot capital flight can materialised. Further sparked by a potential regional currency war where other Asian trading hubs such as South Korea, Singapore, and Taiwan may be forced to weaken their respective domestic currencies to maintain export competitiveness (see Fig 2).
Bearish momentum in Hang Seng Index
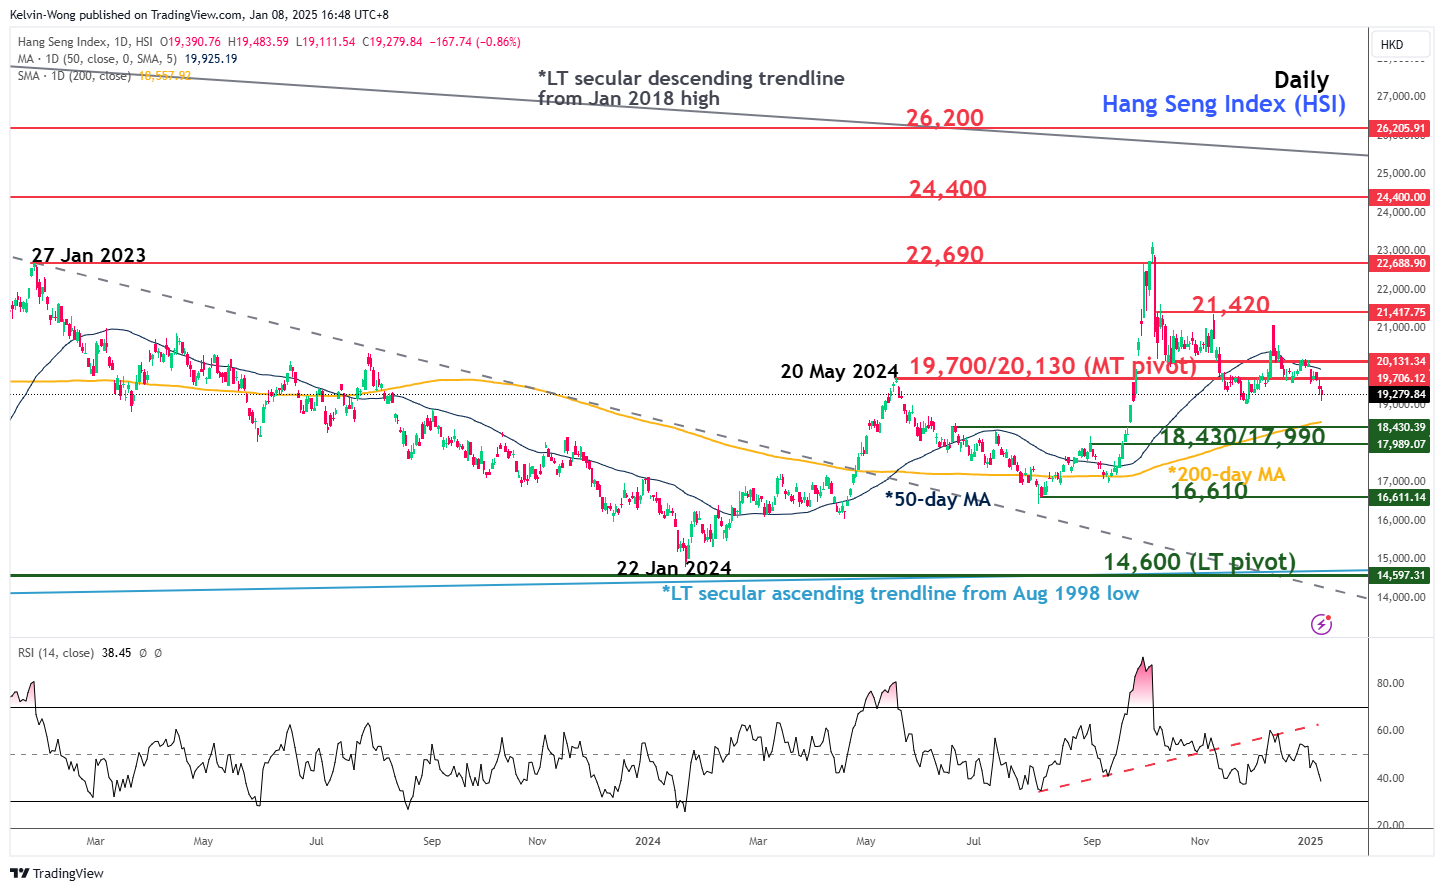
Fig 3: Hang Seng Index medium-term trend as of 8 Jan 2025 (Source: TradingView, click to enlarge chart)
The Hang Seng Index has failed to reintegrate above its 50-day moving average and traded below it since the start of 2025.
In addition, the daily RSI momentum indicator has continued to exhibit bearish elements where it printed series of lower highs below the 50 level and has not reached its oversold region.
These observations suggest that bearish momentum is still intact. Key medium-term pivotal resistance at 19,700/20,130 and a break below 18,430/17,990 (also the 200-day moving average) may trigger a deeper corrective decline sequence to expose the next medium-term support at 16,610 in the first step (see Fig 3).
On the other hand, a clearance above 20,130 negates the bearish tone to revisit the next medium-term resistances at 21,420 and 22,690.
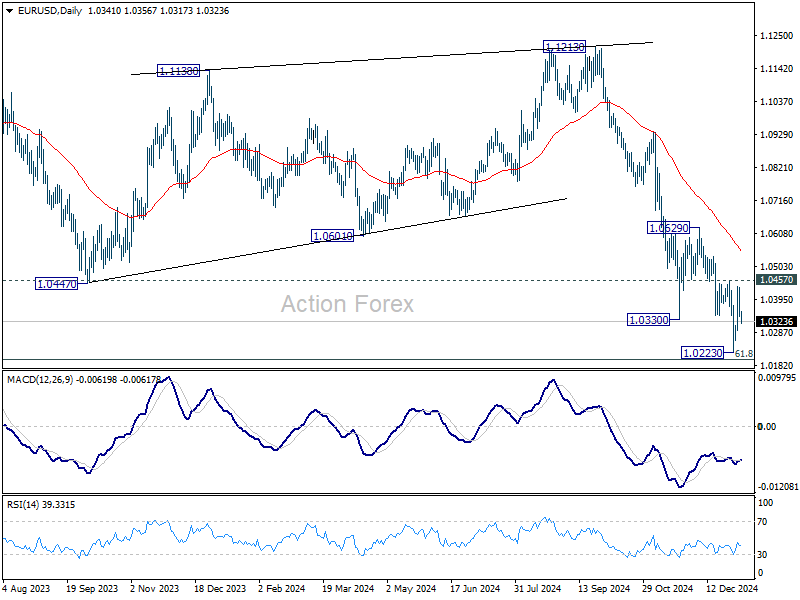
EUR/USD Daily Outlook
Daily Pivots: (S1) 1.0309; (P) 1.0371; (R1) 1.0403; More...
EUR/USD is staying in consolidation above 1.0223 and intraday bias stays neutral. Further decline remains in favor as long as 1.0457 resistance holds. Firm break of 1.0223 will resume the fall from 1.1213. However, sustained break of 1.0457 will confirm short term bottoming, and turn bias to the upside for 55 D EMA (now at 1.0551).
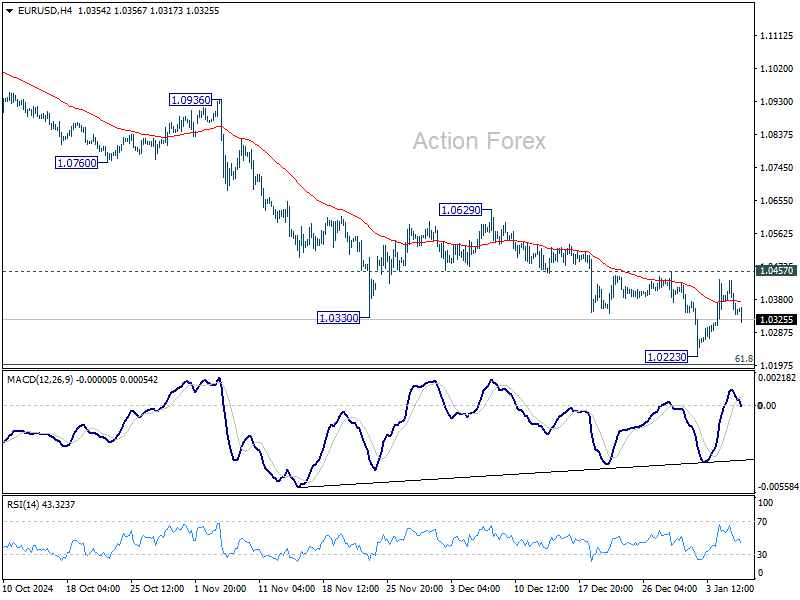
In the bigger picture, fall from 1.1274 (2023 high) should either be the second leg of the corrective pattern from 0.9534 (2022 low), or another down leg of the long term down trend. In both cases, sustained break of 61.8 retracement of 0.9534 to 1.1274 at 1.0199 will pave the way back to 0.9534. For now, outlook will stay bearish as long as 1.0629 resistance holds, even in case of strong rebound.
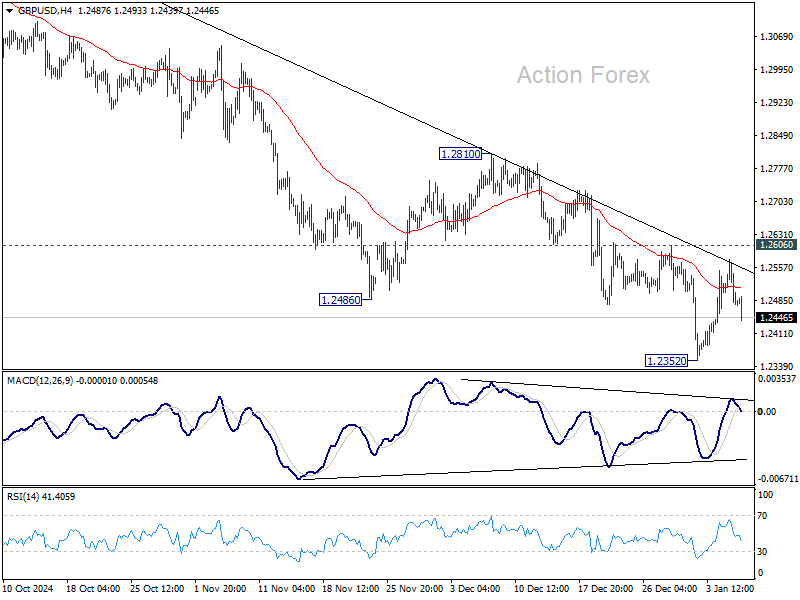
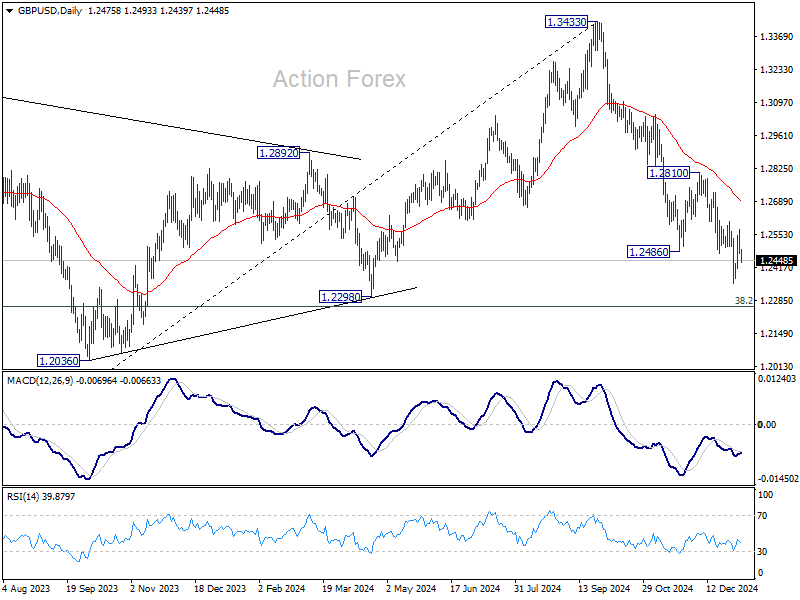
GBP/USD Daily Outlook
Daily Pivots: (S1) 1.2445; (P) 1.2510; (R1) 1.2544; More...
GBP/USD is staying in consolidation above 1.2352 and intraday bias stays neutral. Further decline remains in favor as long as 1.2606 resistance holds. Break of 1.2352 will resume the fall from 1.3433 to 1.2256/98 cluster support zone. Nevertheless, considering bullish convergence condition in 4H MACD, firm break of 1.2606 will confirm short term bottoming, and turn bias back to the upside to 55 D EMA (now at 1.2699).
In the bigger picture, price actions from 1.3433 medium term are seen as correcting whole up trend from 1.0351 (2022 low). Deeper decline could be seen to 38.2% retracement of 1.0351 to 1.3433 at 1.2256, which is close to 1.2298 structural support. But strong support is expected there to bring rebound to extend the corrective pattern. However, firm break of 1.2256 will argue that the trend has reversed and target 61.8% retracement at 1.1528.
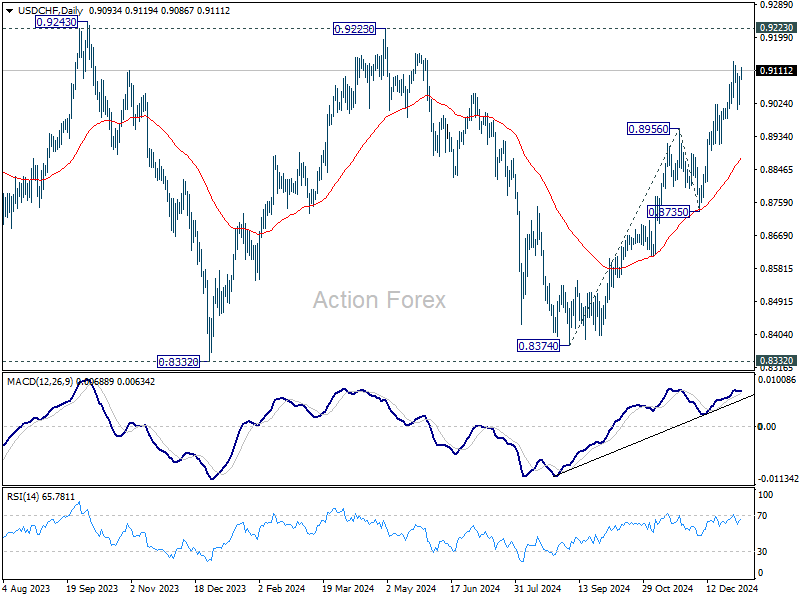
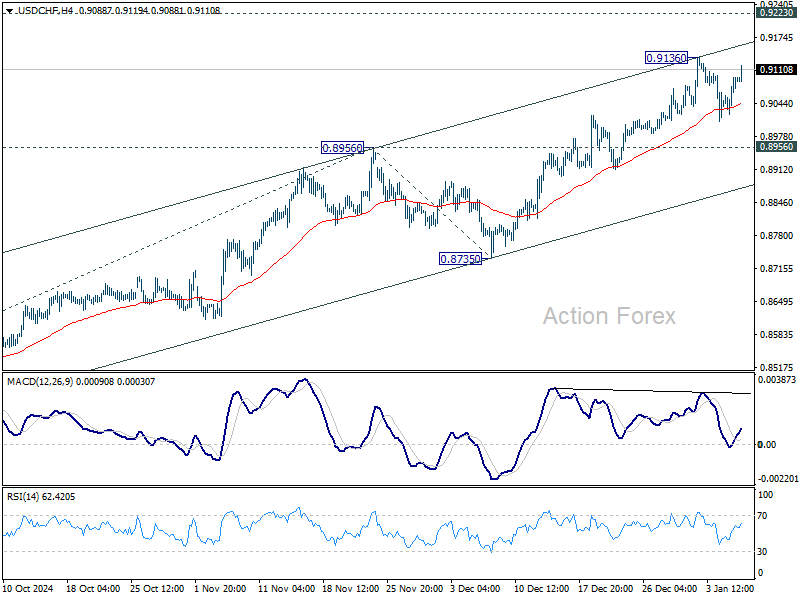
USD/CHF Daily Outlook
Daily Pivots: (S1) 0.9047; (P) 0.9073; (R1) 0.9122; More…
Intraday bias in USD/CHF stays neutral for the moment, and more consolidations could be seen below 0.9136 resistance. But further rally is expected as long as 0.8956 resistance turned support holds. Above 0.9136 will resume the rally from 0.8374 to 0.9223 key resistance next. However, firm break of 0.8956 will turn bias back to the downside for 55 D EMA (now at 0.8879).
In the bigger picture, price actions from 0.8332 (2023 low) are currently seen as a medium term corrective pattern, with rise from 0.8374 as the third leg. Overall outlook will continue to stay bearish as long as 0.9223 resistance holds. Break of 0.8332 low is in favor at a later stage when the consolidation completes. However, decisive break of 0.9223 will be an important sign of bullish trend reversal.