Sample Category Title
Technical Outlook: EURUSD – Bulls May Take A Breather On Overbought Studies But Bias Remains Bullish
The Euro holds firm and consolidating under fresh high t 1.1779 (the highest since Jan 2015 and near the upper boundary of bull-channel) in early Monday's trading.
Strong bullish signal has been generated on weekly close above pivotal barrier at 1.1735 (Fibo 38.2% of 1.3992/1.0340 descend), as the pair ended the third consecutive week positively and is on track for the fifth straight bullish month on steep recovery rally from 1.0500 zone higher base.
The rally approached another strong barrier at 1.1786 (weekly 200SMA), break of which is needed to confirm bullish continuation.
The pair is currently riding on the third wave of five-wave cycle from 1.0820) which could extend to its Fibo expansion levels at 1.1877 (FE 161.8%) and 1.1945 (FE 176.4%), on the way towards target at psychological 1.2000 barrier, also monthly Ichimoku cloud base.
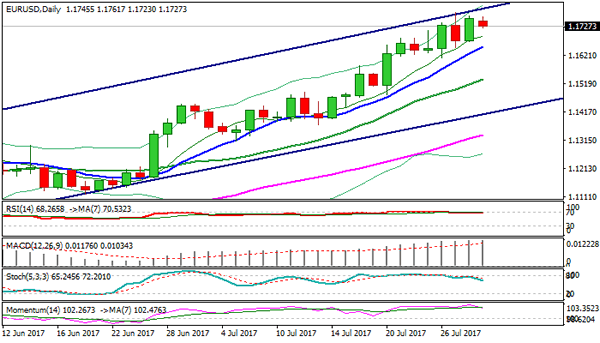
Meantime, corrective pullback on overbought studies is seen as likely near-term scenario. Daily RSI and slow stochastic emerged from overbought territory and support the notion.
Rising 10SMA offers support at 1.1653, followed by daily Tenkan-sen/4-hr cloud base at 1.1630, where dips should find footstep. Extended pullback should be contained at 1.1530 zone (Fibo 38.2% of 1.1188/1.1776, reinforced by rising 20SMA) to keep bulls intact.
Res: 1.1776, 1.1800, 1.1877, 1.1945
Sup: 1.1700, 1.1653, 1.1630, 1.1612
EUR/USD Daily Outlook
Daily Pivots: (S1) 1.1690; (P) 1.1726 (R1) 1.1783; More...
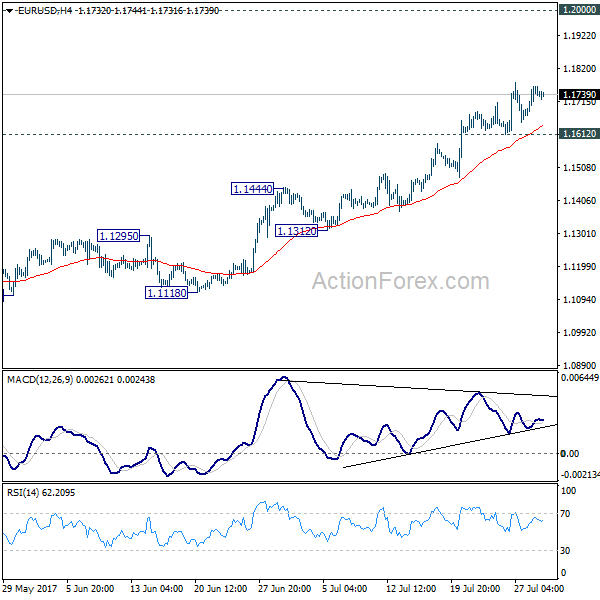
With 11.612 minor support intact, further rise is expected in EUR/USD at this point. Whole rise from 1.0339 low is still in progress and should target 1.2 handle next. Nonetheless, considering bearish divergence condition in 4 hour MACD, break of 1.1612 will indicate short term topping and bring lengthier consolidation first.
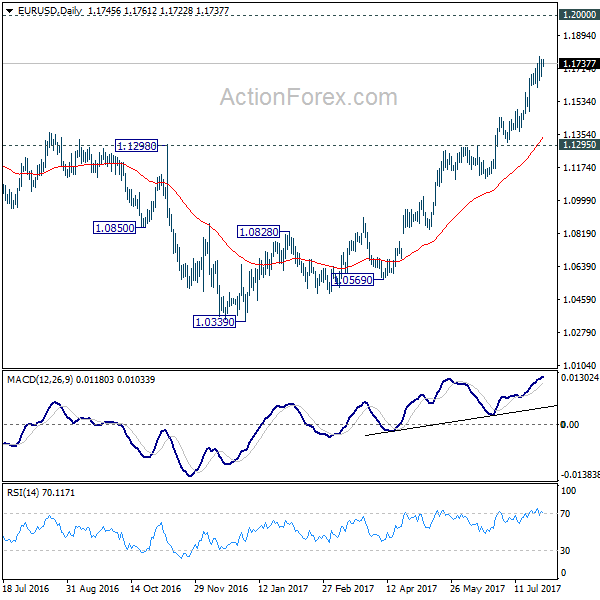
In the bigger picture, an important bottom was formed at 1.0339 on bullish convergence condition in weekly MACD. Sustained break of 55 month EMA (now at 1.1760) will pave the way to key fibonacci level at 38.2% retracement of 1.6039 (2008 high) to 1.0339 (2017 low) at 1.2516. While rise from 1.0339 is strong, there is no confirmation that it's developing into a long term up trend yet. Hence, we'll be cautious on strong resistance from 1.2516 to limit upside. But for now, medium term outlook will remain bullish as long as 1.1295 support holds, in case of pull back.
Trade Idea: GBP/JPY – Stand aside
GBP/JPY - 145.10
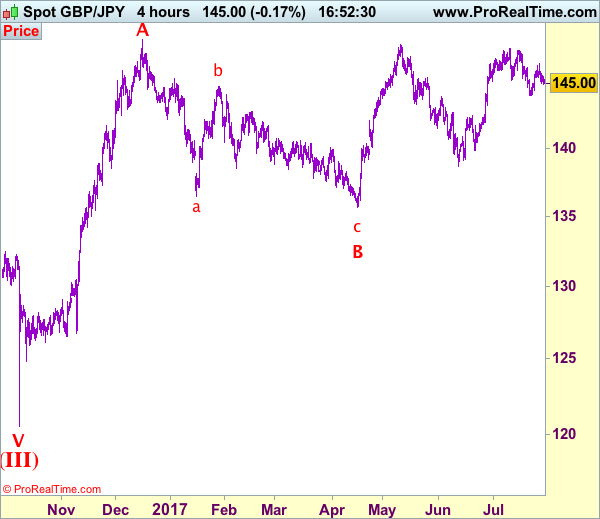
Recent wave: Medium term low formed at 120.50 and (A)-(B)-(C) major correction has commenced with (A) leg ended at 148.45, hence wave (B) is unfolding for retreat to 131.00-10.
Trend: Near term up
New strategy :
Stand aside
Position: -
Target: -
Stop:-
Sterling’s retreat after last week’s rise to 146.55 has retained our view that further consolidation would be seen and weakness to 144.80-85 cannot be ruled out, however, below support at 144.45-50 is needed to signal the rebound from 144.00-05 has ended, bring test of this level, break there would add credence to our view that a temporary top has been formed at 147.75 earlier this month, bring retracement of recent upmove to 143.50, then towards support at 143.30.
On the upside, above 145.80 would bring another test of said resistance at 146.55, break there would signal low has been formed at 144.05 and bring a stronger rebound to 146.90-00 and possibly towards 147.30. As near term outlook is still mixed, would be prudent to stand aside in the meantime.
Our preferred count is that larger degree wave V with circle is unfolding from 251.12 with wave (I) 219.34, (II): 241.38 and wave (III) is subdivided into 1: 192.60, 2: 215.89 (23 Jul 2008) and wave 3 ended at 118.87 earlier in 2009. The correction from there to 162.60 is wave 4 which itself is a double three and is labeled as first a-b-c ended at 151.53, followed by wave x at 139.03, 2nd a ended at 162.60, 2nd b at 146.75 and 2nd c leg of wave 4 ended at 163.00. Therefore, the decline from 163.00 to 116.85 is now treated as wave 5 which also marked the end of larger degree wave (III), hence wave (IV) major correction has commenced for retracement of the wave (III) from 241.38 and upside target at 183.95-00 (50% Fibonacci retracement of the wave (II) from 241.38) had been met, a drop below 160.00 would suggest wave (IV) has ended at 195.85, bring decline in wave (V) for initial weakness to 130 (already met) and 120.
GBP/USD Daily Outlook
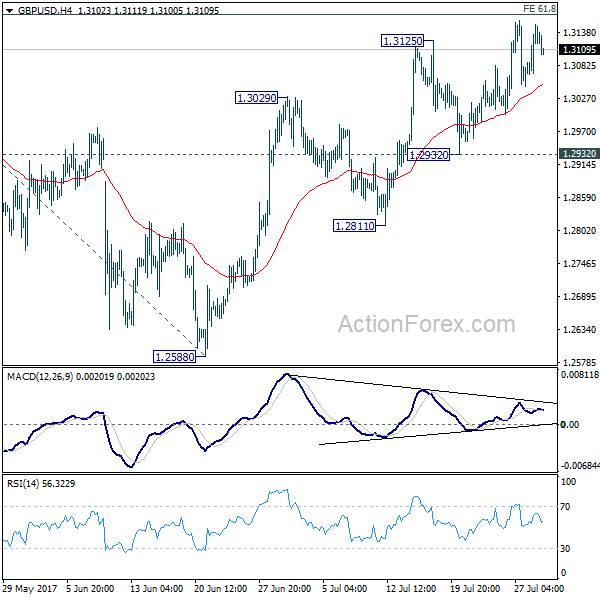
Daily Pivots: (S1) 1.3077; (P) 1.3115; (R1) 1.3168; More...
No change in GBP/USD's outlook. Price actions from 1.1946 are seen as a corrective pattern. Considering bearish divergence condition in 4 hour MACD, we'd stay cautious on strong resistance from 61.8% projection of 1.2108 to 1.3047 from 1.2588 at 1.3168 to limit upside. Break of 1.2932 support will be the first sign of reversal and will turn bias to the downside to target 1.2588 key support next. Though, sustained break of 1.3168 will bring further rise towards 1.3444 before completing the correction.
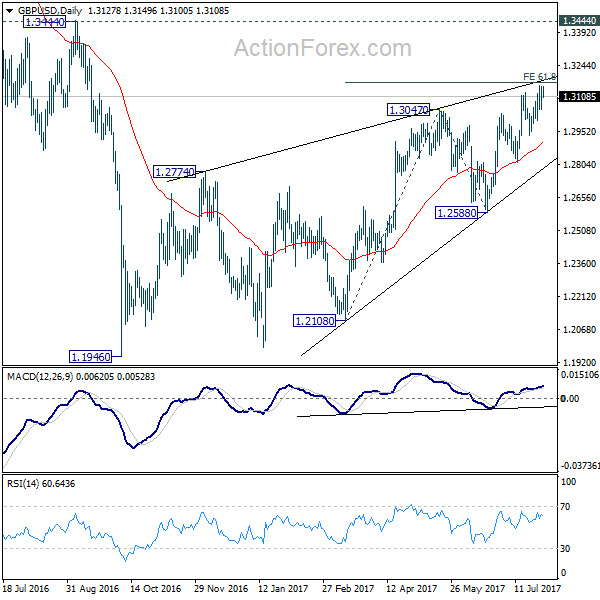
In the bigger picture, overall, price actions from 1.1946 medium term low are seen as a corrective pattern that is still in progress. While further upside is expected, larger outlook remains bearish as long as 1.3444 key resistance holds. Down trend from 1.7190 (2014 high) is expected to resume later after the correction completes. And break of 1.2588 will indicate that such down trend is resuming.
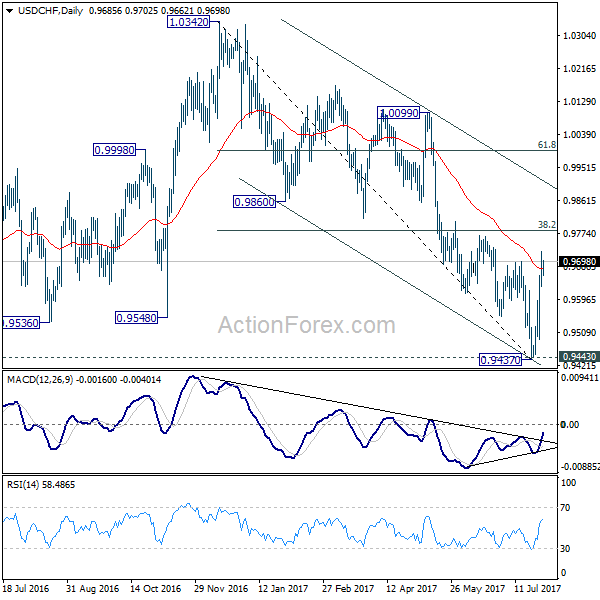
USD/CHF Daily Outlook
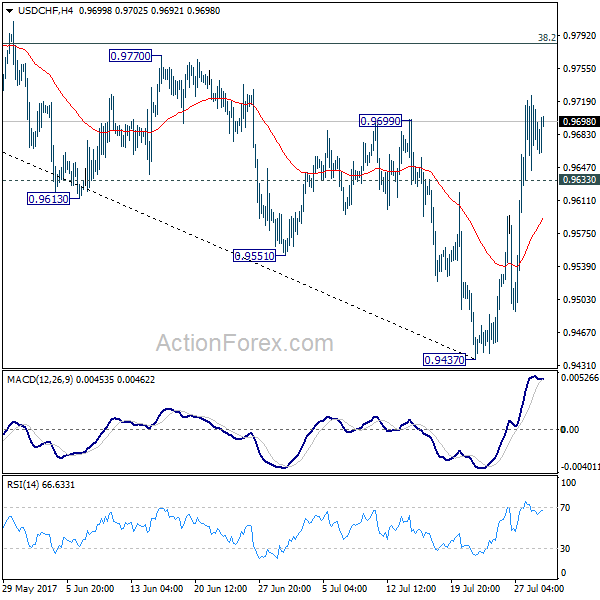
Daily Pivots: (S1) 0.9637; (P) 0.9682; (R1) 0.9730; More...
With 0.9633 minor support intact, intraday bias in USD/CHF remains on the upside for further rise. Prior break of 0.9699 resistance suggests near term reversal after defending 0.9443 key support. Further rally should be seen to 38.2% retracement of 1.0342 to 0.9437 at 0.9783 first. Break will target channel resistance (now at 0.9899). On the downside, below 0.9633 minor support will turn intraday bias neutral and bring consolidations first.
In the bigger picture, current development argues that USD/CHF has successfully defended 0.9443 key support level. And long term range trading in 0.9443/1.0342 is extending with another rise. At this point, there is no sign of an up trend yet. Hence, while further rise is expected in USD/CHF, we'll start to be cautious on loss of momentum above 61.8% retracement of 1.0342 to 0.9437 at 0.9996.
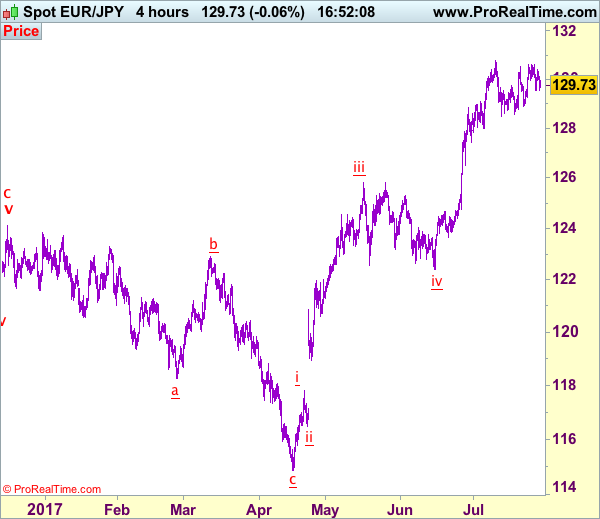
Trade Idea: EUR/JPY – Stand aside
EUR/JPY - 129.91
Recent wave: wave v of (C) ended at 94.12 and major correction in wave A has ended at 149.79
Trend: Near term up
New strategy :
Stand aside
Position: -
Target: -
Stop:-
As the single currency has retreated after faltering below indicated resistance at 130.61 late last week, retaining our view that further consolidation below recent high at 130.77 would be seen and pullback to 129.45-50 is likely, however, reckon downside would be limited to 129.20-25 and 128.49-57 support should hold, bring another rise later.
On the upside, above 130.61 would bring retest of said resistance at 130.77 but break there is needed to confirm recent upmove has resumed and bring further gain to 131.00-10, above there would encourage for headway to 131.50, however, loss of upward momentum should prevent sharp move beyond latter level and reckon 132.00 would hold from here, risk from there is seen for a retreat later.
Our latest preferred count is that wave (ii) is ABC-X-ABC which ended at 123.33 and wave (iii) is unfolding with wave iii ended at 100.77, followed by wave iv at 111.57 and wave v as well as the wave (iii) has ended at 97.04, followed by wave (iv) at 111.43 and wave (v) has ended at 94.12 which is also the end of the larger degree v, this also implied the major wave (C) has also ended there, hence major correction has commenced from there with (A) leg unfolding in its lower degree wave c which has possibly ended at 145.69. Under this count, A-B-C wave (B) has commenced with A leg ended at 136.23, wave B at 143.79 and wave C has possibly ended at 149.79.
Our larger degree count is that the decline from 139.26 is wave (C) and is sub-divided into a diagonal triangle i-ii-iii-iv-v with wave i - 105.44, wave ii- 123.33, wave iii - 97.03, wave iv - 111.43, followed by the final wave v as well as the end of wave (C) at 94.12, this also mark the bottom of larger degree wave B. Under this count, major rise in wave C has commenced as an impulsive wave with minor wave III ended at 145.69, wave V is still in progress for further gain to 150.00. Having said that, this so-called wave V could well be the first leg of larger degree 5-waver wave C and this wave C should bring at least a retest of wave A top at 169.97 (July 2008).
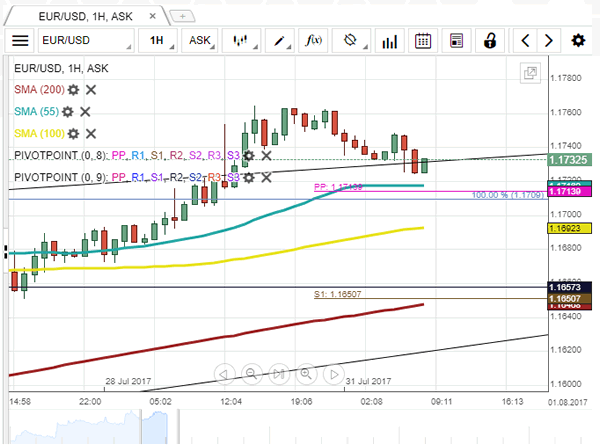
EUR/USD Analysis: Trades Around 1.1731
Beginning of new trading week the currency rate started above multiple technical indicators, such as the 100% Fibonacci retracement level, the updated weekly PP and the 55-hour SMA at 1.1716. To certain extent, this is a result of announcement of the US Federal Funds Rate and Advance GDP last week. Due to the fact that the road downstairs is blocked by the above combined support level, the pair has no other choice that continue to climb towards the updated weekly R1 located at the 1.1815 level. Such scenario falls in line with the rising wedge theory, whose lower support line moves along the 55- and 100-hour SMAs. If the rate reaches the above resistance level, it might give an impulse strong enough to exit the existing formation and approach the bottom boundary of the channel.
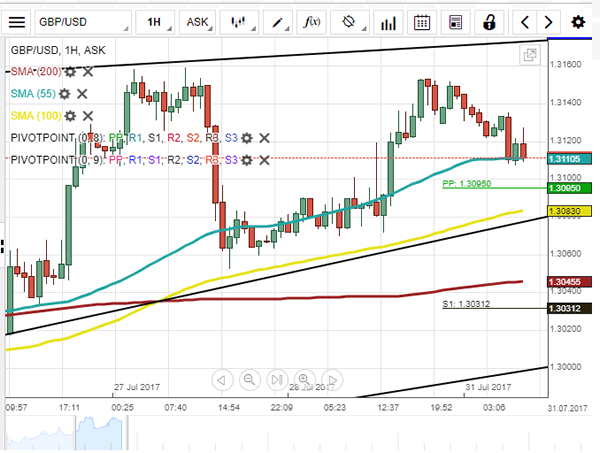
GBP/USD Analysis: Tends To Reach Monthly R1
The currency exchange rate continues to gradually climb upstairs in a rising wedge pattern. More specifically, the first week of August the pair started in a limbo between the upper trend-line from the top and a combination of the 20- and 55-hour SMAs as well as the weekly PP from the bottom. In the upcoming hours this barrier should become additionally strengthened by the approaching 100-hour SMA. For this reason, the rate is expected not to fall below the 1.3095 level. Since there are also no important data releases today, the pair should continue to move towards the pattern's northern boundary. William's fractals suggest that the surge might be stopped already near the 1.3160 mark, which, in turn, would lead to formation of a short-term ascending triangle.
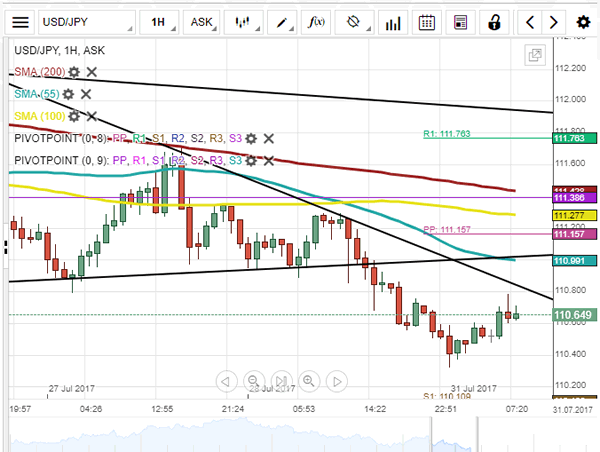
USD/JPY Analysis: Leaves Symmetrical Triangle
In accordance with expectations, boundaries of a symmetrical triangle proved to be not strong enough to confine the falling Greenback shortly after announcement of the US Advance GDP. However, the fact that the drop was neutralized already by closest support level set up by the weekly S1 at 110.48 indicates that it was not severe. That, in turn, allows assuming that the pair might successfully reach the combined resistance level formed by the 55-hour SMA and the updated weekly PP at 111.16. Given that the further road upstairs is blocked by the 100- and 200-hour SMAs as well as the monthly PP at 111.38, suggests the currency rate is going to make a rebound and begin to move to the south in line with the general downtrend.
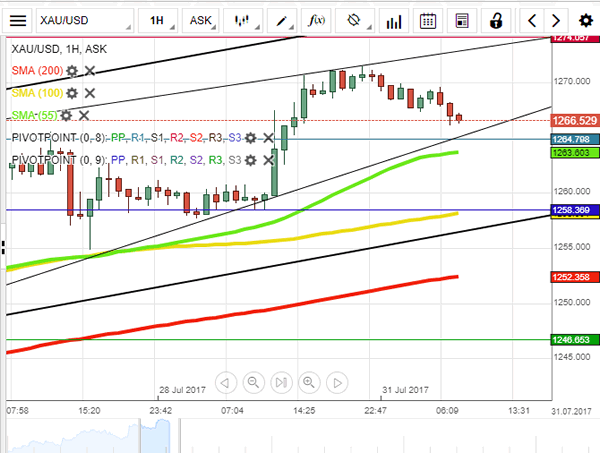
XAU/USD Analysis: Surges To 1,270.93
An announcement of the US Advance GDP last Friday resulted in a 0.76% increase of the yellow metal price. Nevertheless, the impulse given by this fundamental event in conjunction with the monthly PP at 1,258.37 was not enough to allow the rate to reach the upper trend-line of an ascending channel. In the beginning of Monday's trading session it made a rebound near the 1,270.93 level and started to move towards the updated weekly PP at 1,281.80, which is additionally secured by the 55-hour SMA. In order to stay in the channel, the pair needs to reach its southern boundary. If it fails to do so and rebounds from the above support level, this might be a sign of a formation of a rising wedge.