Sample Category Title
Canadian Economic Growth Accelerated In May
For the 24 hours to 23:00 GMT, the USD declined 0.88% against the CAD and closed at 1.2440 on Friday.
The Canadian Dollar gained ground, following robust Canadian GDP figures.
Data indicated that Canada's GDP sharply expanded by 0.6% on a monthly basis in May, highlighting that the nation is on a robust growth path and boosting expectations that the Bank of Canada will raise interest rates again. The nation's GDP had risen 0.2% in the previous month, while investors had envisaged it to climb 0.2%. Also, on an annual basis, the GDP recorded a more-than-expected rise of 4.6% in May, after recording an expansion of 3.3% in the previous month.
In the Asian session, at GMT0300, the pair is trading at 1.2470, with the USD trading 0.24% higher against the CAD from Friday's close.
The pair is expected to find support at 1.2404, and a fall through could take it to the next support level of 1.2338. The pair is expected to find its first resistance at 1.2552, and a rise through could take it to the next resistance level of 1.2634.
The currency pair is showing convergence with its 20 Hr moving average and trading below its 50 Hr moving average.

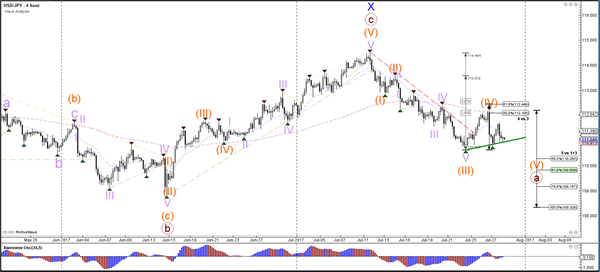
Daily Technical Analysis: USD/JPY Downtrend Breaks Support Line And Challenges 110
Currency pair USD/JPY
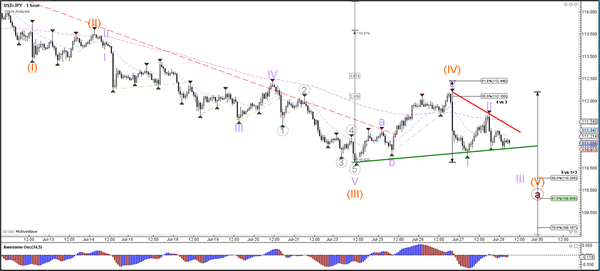
The USD/JPY downtrend broke below the support trend line (dotted green) and could continue towards the Fibonacci targets of wave 5 (orange). The 110 round level is also a potential support level where price could build a bullish retracement.
The USD/JPY bearish breakout could be extending the wave 5 (orange) as long as price stays below resistance (red/orange). A break above the bottom of wave 1 (orange line) invalidates wave 4 after wave 3 (grey) is completed.
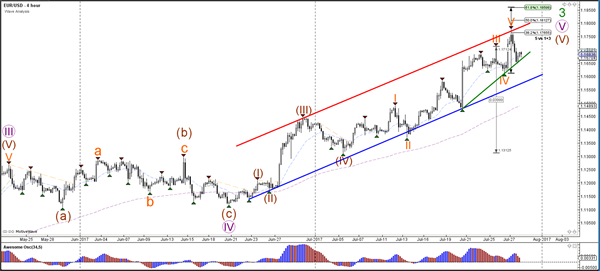
Currency pair EUR/USD
The EUR/USD remains in a bullish trend as long as price stays above the support trend lines which are indicated by green and blue. A break below the support could indicate the completion of wave 3 (green) and the start of wave 4 whereas a break above resistance (red) could see price challenge the Fibonacci targets of wave 5 (orange).
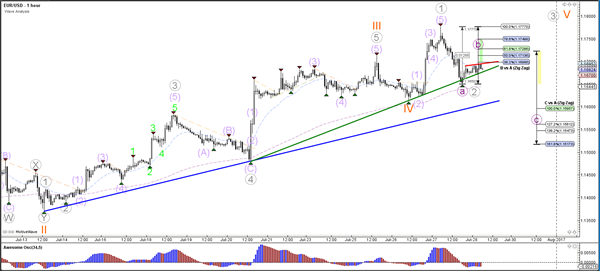
The EUR/USD could be building a larger 5 wave (grey) extension within wave 5 (orange). At the moment, price is building a potential correction via an ABC (purple) within wave 2 (grey).
Currency pair GBP/USD
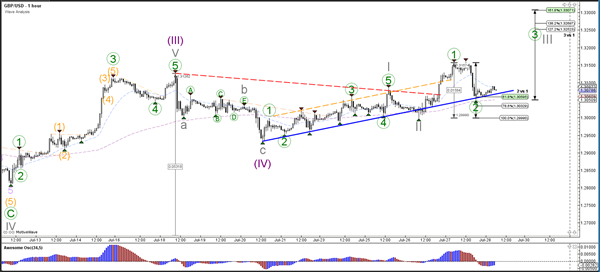
The GBP/USD is making a bearish pullback that is testing the support trend line (blue) within a wave 5 (purple) of wave 3 (blue).
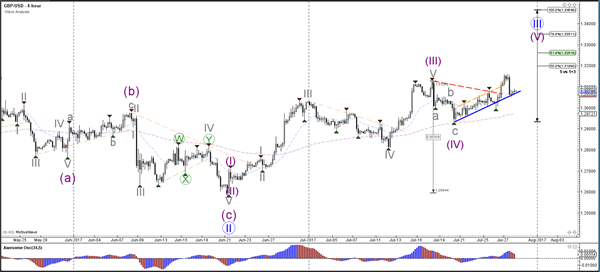
The GBP/USD could be expanding the retracement within wave 2 (green). A break above the resistance trend line (red) could see a continuation of wave 3 (grey) whereas a break below the 100% Fibonacci level of wave 2 vs 1 invalidates the bullish wave pattern.
European Open Briefing: The US Dollar Remains Under Pressure
Global Markets:
- Asian stock markets: Nikkei down 0.10 %, Shanghai Composite gained 0.45 %, Hang Seng rallied 0.60 %, ASX 200 rose 0.40 %
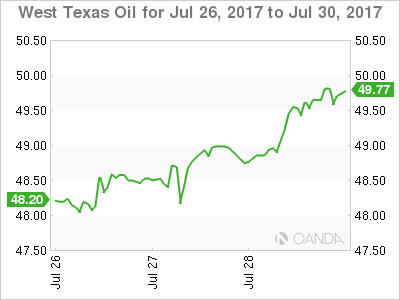
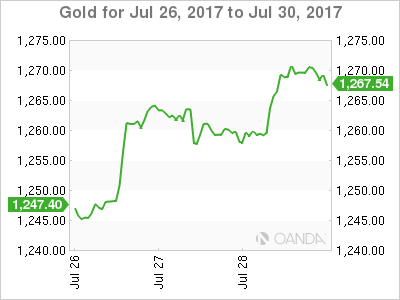
- Commodities: Gold at $1267 (-0.05 %), Silver at $16.70 (+0.05 %), WTI Oil at $49.90 (+0.40 %), Brent Oil at $52.40 (+0.35 %)
- Rates: US 10 year yield at 2.28, UK 10 year yield at 1.21, German 10 year yield at 0.54
News & Data:
- China Manufacturing PMI 51.4 vs 51.6 expected
- China Non-Manufacturing PMI 54.5 vs 54.9 previous
- New Zealand ANZ Business Confidence 19.4 vs 24.8 previous
- Australia Private Sector Credit 0.6 % vs 0.4 % expected
- Australia HIA New Home Sales -6.9 % vs 1.1 % previous
- Japan Industrial Production 1.6 % vs 1.7 % expected
- PBoC Fixes USDCNY Reference Rate At 6.7283 (Prev 6.7373)
- Asia stocks reverse losses on China's solid purchasing managers' indexes – RTRS
- Dollar struggles on policy uncertainty, political woes – RTRS
CFTC Positioning Data:
- EUR long 91K vs 91K long last week. No change in position.
- GBP short 26K vs 16K short last week. Shorts increased by 10K.
- JPY short 121K vs 127K short last week. Shorts trimmed by 6K
- CHF short 2K vs 4K short last week. Shorts trimmed by 2K
- CAD long 27K vs 8K short. CAD longs increased by 19K.
- AUD long 56k vs 51k last week. Longs increased by 5K.
- NZD long 35K vs 36K long last week. Longs trimmed by 1K
Markets Update:
The US Dollar remains under pressure. While the charts suggest that the currency is oversold in the short-term, it is getting no rest. EUR/USD and GBP/USD are back above 1.17 and 1.31 respectively, and USD/JPY is approaching a key support level at 110. In the Euro, there is little resistance until 1.20, while in Cable, a break above 1.32 would signal a rally to at least 1.35. The Yen is likely to struggle as the BoJ plans to maintain its QE programme for a long time, but a break of 110 in USD/JPY could trigger fresh momentum selling.
Upcoming Events:
- 07:00 BST – German Retail Sales
- 10:00 BST – Euro Zone CPI
- 15:00 BST – US Pending Home Sales
The Week Ahead:
Tuesday, August 1st
- 00:30 BST – Australia AIG Manufacturing Index
- 02:45 BST – China Caixin Manufacturing Index
- 05:30 BST – RBA Rate Decision
- 08:45 BST – Italian Manufacturing PMI
- 08:50 BST – French Manufacturing PMI
- 08:55 BST – German Manufacturing PMI
- 09:00 BST – Euro Zone Manufacturing PMI
- 09:30 BST – UK Manufacturing PMI
- 10:00 BST – Euro Zone GDP
- 15:00 BST – US ISM Manufacturing PMI
Wednesday, August 2nd
- 09:30 BST – UK Construction PMI
- 13:15 BST – US ADP Nonfarm Employment Change
- 15:30 BST – US Crude Oil Inventories
Thursday, August 3rd
- 08:45 BST – Italian Services PMI
- 08:50 BST – French
- 08:55 BST – German
- 09:00 BST – Euro Zone
- 09:30 BST – UK
- 10:00 BST – Euro Zone Retail Sales
- 12:00 BST – Bank of England Rate Decision
- 15:00 BST – US ISM
Friday, August 4th
- 02:30 BST – Australian Retail Sales
- 13:30 BST – US NFP
- 13:30 BST – US Unemployment Rate
- 13:30 BST – Canadian Unemployment Rate
- 13:30 BST – Canadian Employment Change
- 15:00 BST – Canadian Ivey PMI
Venezuela To Prop Up Oil And Gold
Venezuela and Washington D.C.'s appetite for destruction seems set to boost the background fundamentals of the Oil and Gold rallies.
Oil
Oil enjoyed a very bullish close to the week with both Brent and WTI climbing some two percent, with both closings comfortably above their respective 100-day moving averages. A combination of factors seems to be driving the newly found optimism. U.S. Inventories are showing massive drawdowns, Saudi Arabia seems intent on playing its role as the world's swing producer ahead of the Aramco IPO, impending sanctions on Venezuela by the U.S. will almost certainly be oil price supportive with a weaker U.S. dollar and conflict within Washington D.C. all lending a hand. There also appears to be less urgency by shale producers to hedge forward production for now which has snuffed out previous rallies.
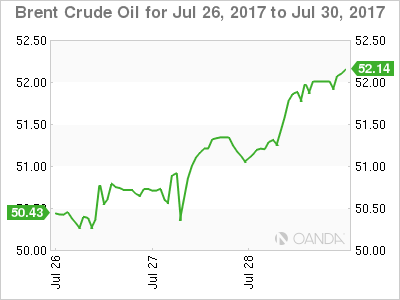
Brent crude, in particular, bears watching. Having closed at 52.00 on Friday, the spot price is just below its 61.80% retracement of the drop from the 2017 high to lows which lie just above at 52.15. A close above here could imply a test of 52.70, with a break here opening a possible run at the May highs around 54.00 a barrel. Support today will appear at 51.40, the 100-day moving average.
WTI spot trades at 49.65, the high and closing level from Friday. Resistance will clearly be at the 50.00 level initially, with a daily close above suggesting a continuation of the rally to the May highs around 51.65. Support will appear at the 100-day moving average at 49.10 followed by the Friday low at 48.70.
Event wise Venezuela looms large today with only 12% of the population voting in an election marred by violence over the weekend and deemed illegal by the United States. The latter's response will be critical to the short term direction of oil as the international community starts to circle the corpse of the Venezuelan economy.
Gold
Gold raced higher by 12 dollars on Friday to close near its highs at 1269.00 to cap an excellent week for the yellow metal. A weaker U.S. dollar is the main driver if gold's price action. However, deepening political turmoil in Washington D.C., and impending collapse in Venezuela and North Korea's progress on ballistic missiles will all ensure the uncertainty premium continues to support gold's price.
Gold is trading at 1269.00 in early Asia, just above its Friday close with the way clear on a technical basis, for a run at the early June highs just above 1280.00. Near term, support sits at 1265.00 and then 1257.00.
The only cloud on gold's horizon could be a slightly overbought RSI, but technical traders are unlikely to break into a cold sweat unless we see a break of the 200-day moving average. It lies today at the 1250.50 level.
Again, Venezuela is the main event risk over the next 24 hours, as somewhat dubious and violence marred election over the weekend appears to be hastening the march to the bankruptcy of the country with the world's largest proven oil reserves.
Weekly Technical Outlook And Review: EUR/USD, GBP/USD, AUD/USD, USD/JPY, USD/CAD, USD/CHF, DOW 30, GOLD
A note on lower timeframe confirming price action...
Waiting for lower timeframe confirmation is our main tool to confirm strength within higher timeframe zones, and has really been the key to our trading success. It takes a little time to understand the subtle nuances, however, as each trade is never the same, but once you master the rhythm so to speak, you will be saved from countless unnecessary losing trades. The following is a list of what we look for:
- A break/retest of supply or demand dependent on which way you're trading.
- A trendline break/retest.
- Buying/selling tails ... essentially we look for a cluster of very obvious spikes off of lower timeframe support and resistance levels within the higher timeframe zone.
- Candlestick patterns. We tend to only stick with pin bars and engulfing bars as these have proven to be the most effective.
We typically search for lower-timeframe confirmation between the M15 and H1 timeframes, since most of our higher-timeframe areas begin with the H4. Stops are usually placed 1-3 pips beyond confirming structures.
EUR/USD
Weekly gain/loss: + 86 pips
Weekly closing price: 1.1749
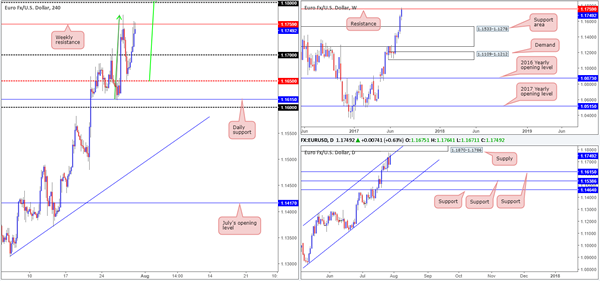
The EUR/USD market enjoyed another relatively successful week, chalking in its third consecutive weekly bullish candle. In order for the bulls to continue pushing higher this week, however, weekly resistance at 1.1759 will need to be taken out. A decisive close above this line will likely see the major approach a weekly resistance planted at 1.2044.
Turning our attention to the daily timeframe, we can see that price spent the majority of the week clinging to the underside of a channel resistance extended from the high 1.1268. Also noteworthy is the fresh (strong-looking) supply lurking a few pips ahead of current price at 1.1870-1.1786.
A quick recap of Friday's action on the H4 chart shows the unit extended Thursday's bounce from the mid-level support at 1.1650 on Friday. The 1.17 handle was all but ignored, allowing price to end the week shaking hands with weekly resistance at 1.1759 going into the close.
Our suggestions: Upside momentum is, we agree, incredibly strong at the moment. Nevertheless, is it about time for the single currency to reverse? The reason we ask this is due to the following technical elements:
Weekly resistance at 1.1759.
Daily channel resistance, followed closely by daily supply at 1.1870-1.1786.
H4 round number 1.1800, H4 resistance at 1.1812 and a nice-looking H4 AB=CD approach in the making (see green arrows) that terminates around the 127.2% Fib ext. at 1.1823.
Personally speaking, we feel a bounce is likely to be seen from the 1.1823/1.1800 H4 area sometime this week. Not only is it packed full of H4 confluence, it is also located just above weekly resistance and seen positioned within the walls of a daily supply!
Data points to consider: No high-impacting news events scheduled on the docket today.
Levels to watch/live orders:
- Buys: Flat (stop loss: N/A).
- Sells: 1.1823/1.1800 region (stop loss: aggressive –1.1825, conservative –1.1872).
GBP/USD:
Weekly gain/loss: + 138 pips
Weekly closing price: 1.3131
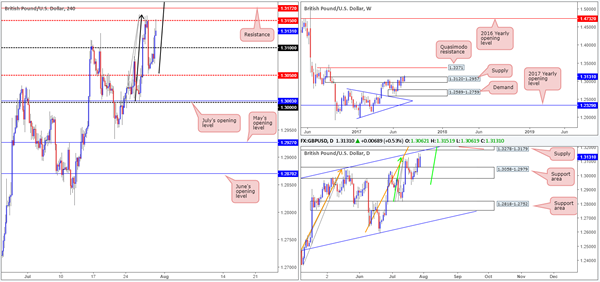
Weekly supply at 1.3120-1.2957 is, once again, trading under pressure. A near-full-bodied weekly bull candle was printed during last week's segment, forcing the market to a fresh high of 1.3158. Assuming that the buyers continue to govern direction here, this could eventually lead to a move being seen up to a weekly Quasimodo resistance planted at 1.3371.
Although the bulls look set to lift the unit higher on the weekly chart, the candles are painting an entirely different landscape on the daily chart right now! Directly ahead of price is a supply seen at 1.3278-1.3179 that is overflowing with confluence to sell. We have a channel resistance line drawn from the high1.2774, a trendline resistance taken from the high 1.3477 and two converging AB=CD (green/orange arrows) 127.2 Fib extensions at 1.3222/1.3223 (taken from the lows 1.2811/1.2365).
Looking across to the H4 timeframe, the 1.31 handle, although it did manage to hold price lower for a couple of hours, was engulfed on Friday, consequently opening up the path north for the market to challenge the mid-level resistance at 1.3150. Interestingly, this has seen price begin forming a D-Leg to a potential AB=CD bearish pattern (black arrows) that completes a few pips above the 1.32 handle at 1.3207 (the 127.2% Fib ext.).
Our suggestions: Given that it is not yet clear whether the weekly bears have given up the fight at the current weekly supply, there's a strong possibility that this market may turn lower from the aforementioned daily supply in the coming week. We say this simply due to the amount of confluence we've been able to note.
An ideal selling spot for us is between 1.3223 and 1.32. The harmonics in play here is just mouthwatering: two daily AB=CD bearish formations coupled with another H4 AB=CD bearish pattern! Bundle this together with the daily channel resistance, the daily trendline resistance and the daily supply, and we have ourselves a strong sell zone!
Data points to consider: No high-impacting news events scheduled on the docket today.
Levels to watch/live orders:
- Buys: Flat (stop loss: N/A).
- Sells: 1.3223/1.32 region (stop loss: aggressive – 1.3225, conservative –1.3280).
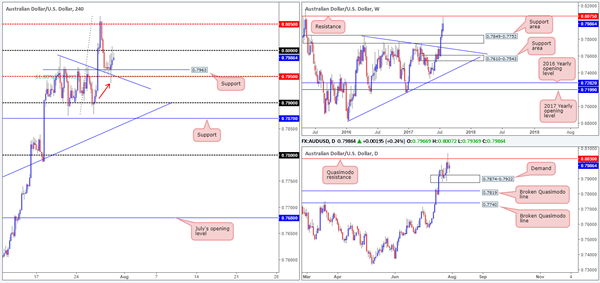
AUD/USD:
Weekly gain/loss: + 74 pips
Weekly closing price: 0.7986
Although buyers printed a third consecutive weekly bull candle last week, a moderate end-of-week correction was seen after the commodity currency came within touching distance of a weekly resistance pegged at 0.8075. Should this encourage sellers into the market, we could see price trade as low as the weekly support area marked at 0.7849-0.7752.
In conjunction with the weekly timeframe, the daily Quasimodo resistance at 0.8030 managed to cap upside on Thursday, which could lead to a move being seen down to daily demand located nearby at 0.7874-0.7922. A break below this area, nonetheless, would almost immediately bring one into close contact with the top edge of the said weekly support area, which, as you can see, also holds a daily broken Quasimodo line at 0.7819 within.
Given how close weekly price came to testing resistance, and the recent interaction with the daily Quasimodo resistance, we are a tad surprised to see how well the H4 support at 0.7963 (converges with a H4 trendline support taken from the high 0.7987, a nearby H4 mid-level support at 0.7950 and also a H4 61.8% Fib support at 0.7950 drawn from the low 0.7877) held on Friday.
Our suggestions: The low seen marked with a red arrow on the H4 chart at 0.7936 likely triggered a truckload of stop-loss orders, and thus weakened the 0.7950/0.7963 area .So, with that said, what about shorting from the 0.80 handle? This could be something to consider, but do bear in mind that beyond the 0.7950 neighborhood price may struggle to reach 0.79 seeing as how the top edge of the current daily demand is sited at 0.7922.
For us, we have decided to remain flat for the time being and will look to reassess price action going into Tuesday's open…
Data points to consider: No high-impacting news events scheduled on the docket today
Levels to watch/live orders:
- Buys: Flat (stop loss: N/A).
- Sells: Flat (stop loss: N/A).
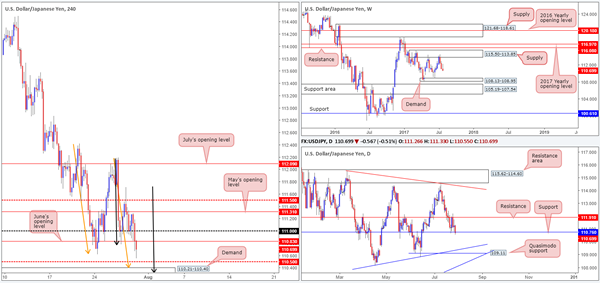
USD/JPY:
Weekly gain/loss: – 43 pips
Weekly closing price: 110.69
From the weekly timeframe it's clear to see that the pair sustained further losses last week, registering its third weekly bearish close. Technically speaking, the market looks as though it could continue to press lower until we reach the small demand base seen at 108.13-108.95.
Zooming in and looking at the daily picture shows us that price concluded the week marginally closing beyond support at 110.76. In theory, this move could have potentially cleared the river south down to a Quasimodo support logged at 109.11, which happens to unite closely with a trendline support etched from the low 108.13.
A brief look at recent dealings on the H4 chart reveals that the bulls eventually threw in the towel around the 111 handle, allowing the unit to test, and ultimately engulf, June's opening level at 110.83. What's also notable from a technical perspective here is the two AB=CD bullish patterns in the making (black/orange arrows). Both terminating around the top edge of a small demand base at 110.21-110.40, this area is, in our opinion, stable enough to bounce price this week since it was formed on the break of a Quasimodo left shoulder at 110.27. In addition to the Harmonics, we also like the fact that the mid-level number 110.50 is positioned directly above. A great deal of traders look to buy these levels and place stops a few pips below. By driving through this level, sell stops will be filled from both buyers looking to long and sellers looking to play the breakout, and therefore provide liquidity for the big boys to buy.
Understandably, the only grumble we have buying from the small H4 demand is the higher-timeframe picture, which suggests further selling may be on the horizon (see above).
Our suggestions: Watch for H4 price to test demand at 110.21-110.40 and, depending on the time of day, look to buy at market with stops positioned just below the said demand at 110.19. Ideally, we'd be looking to target June's opening level at 110.83 to take partial profits. We would also adivse moving stops to breakeven as soon as a H4 close is registered above 110.50, since let's not forget that we would effectively be going against higher-timeframe flow here!
Data points to consider: No high-impacting news events scheduled on the docket today.
Levels to watch/live orders:
- Buys: 110.21-110.40 (stop loss: 110.19).
- Sells: Flat (stop loss: N/A).
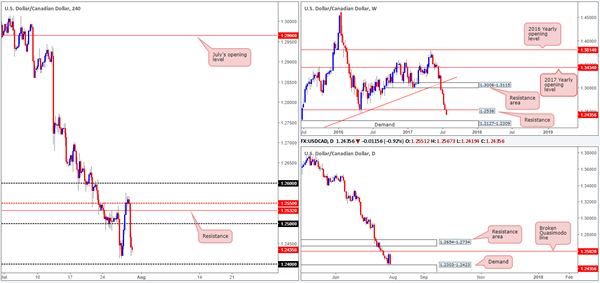
USD/CAD:
Weekly gain/loss: – 105 pips
Weekly closing price: 1.2435
For approximately three months now, the USD/CAD has been entrenched within a rather strong down move. Of late, we saw the unit cross below a major weekly support level coming in at 1.2538. Should further selling be seen as a result of this, the next target on the hit list can be seen around weekly demand pegged at 1.2127-1.2309.
Stepping down to the daily timeframe, nevertheless, price is seen supported by demand coming in at 1.2303-1.2423, which happens to be glued to the top edge of the weekly demand mentioned above. Also of note here are Thursday and Friday's candles, as combined they form a strong selling wick i.e. a bearish pin-bar candle.
Influenced by a robust Canadian growth report on Friday, the H4 candles aggressively drove lower. The move took out the 1.25 handle and eventually pushed to lows of 1.2419 on the day. As should be obvious from looking at the H4 chart, the next support level on tap is the psychological band 1.24. Additionally, we can see that directly below this number is a support level marked at 1.2362.
Our suggestions: At the time of writing, we do not see much to hang our hat on. Buying from 1.24 or even the H4 support below it at 1.2362 is tempting, given that they're both positioned within the walls of the current daily demand. However, judging by the strength of the sellers over the past few months, it is likely that weekly price will want to connect with the aforesaid weekly demand before any serious buyers get involved.
Therefore, we have decided to hold fire for the time being and remain on the sidelines.
Data points to consider: No high-impacting news events scheduled on the docket today.
Levels to watch/live orders:
- Buys: Flat (Stop loss: N/A).
- Sells: Flat (Stop loss: N/A).
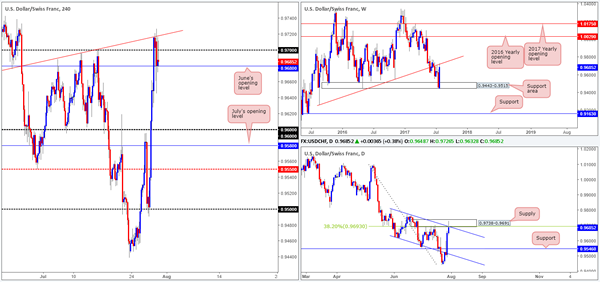
USD/CHF:
Weekly gain/loss: + 229 pips
Weekly closing price: 0.9685
A stronger-than-expected bounce was seen from the weekly support area at 0.9443-0.9515 last week, consequently lifting the market to a high of 0.9726. As you can see, the move erased all of the prior week's losses and engulfed two additional weekly candles in the process. What's also interesting is price reacted nicely to a trendline resistance extended from the low 0.9257, which is something we failed to see before.
Turning over a page to the daily timeframe, price recently connected with supply logged at 0.9738-0.9691. This area also happens to converge with a channel resistance extended from the high 0.9808 and a 38.2% Fib resistance at 0.9693 taken from the high 1.0099.
For those who read Friday's report you will likely remember that our desk took a short from 0.9694 and placed a stop above the current daily supply at 0.9740. From the H4 chart, you'll notice that the unit also reacted from a nice-looking minor trendline resistance extended from the low 0.9675 seen positioned just above 0.97. Once our position hit one times our risk following US growth data, we moved the stop-loss order to breakeven since we were not keen (unless price was over two times the risk) on leaving the trade open over the weekend. Unfortunately, shortly after moving to breakeven we were stopped out!
Our suggestions: With H4 price currently seen bolstered by June's opening level at 0.9680, we would not advise selling this market right now. A decisive H4 close below this number on the other hand would, in our humble opinion, be a valid sell signal. Be that as it may, before we'd consider selling we would need to see the pair retest 0.9680 as resistance and hold firm in the shape of a full or near-full-bodied bear candle. The initial take-profit target on this scale would be the 0.96 handle, followed closely by July's opening level at 0.9580 and then daily support positioned at 0.9546.
Data points to consider: No high-impacting news events scheduled on the docket today.
Levels to watch/live orders:
- Buys: Flat (stop loss: N/A).
- Sells: Watch for H4 price to engulf 0.9680 and then look to trade any retest seen thereafter ([waiting for a full or near-full-bodied bearish candle to emerge following the retest is advised] stop loss: ideally beyond the candle wick).
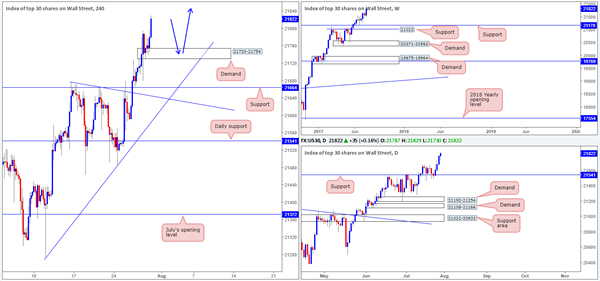
DOW 30:
Weekly gain/loss: + 263 points
Weekly closing price: 21822
US equities put in a dominant performance last week, printing a sold full-bodied weekly bullish candle at record highs of 21829. From the weekly timeframe, it is clear to see that this market's underlying trend remains strong. However, should the index pullback, the support level drawn from 21170 is likely the area where we'll see the bulls recover from.
On the daily timeframe, the candles show that the index gravitated higher since Tuesday after finding a pocket of strong bids from the 21541 neighborhood. Since the unit is trading at all-time highs, we feel that there's not much else to report on this scale.
With both the weekly and daily charts showing room for further buying, we are now watching for H4 price to pullback and test the newly formed H4 demand base at 21730-21754 for a possible long trade (blue arrows). While we expect a bounce to be seen from the aforesaid demand zone, we would not feel comfortable placing pending orders here as there's absolutely no H4 confluence surrounding the area.
Our suggestions: Wait for a H4 bull candle to form (preferably a full-bodied candle) from the current H4 demand and prepare to enter long. The idea behind the additional candle confirmation is that it shows buyer intent, and therefore adds weight to the zone before committing.
Data points to consider: No high-impacting news events scheduled on the docket today.
Levels to watch/live orders:
- Buys: 21730-21754 ([waiting for a full, or near-full-bodied H4 bull candle to form is advised] stop loss: ideally beyond the candle's tail).
- Sells: Flat (stop loss: N/A).
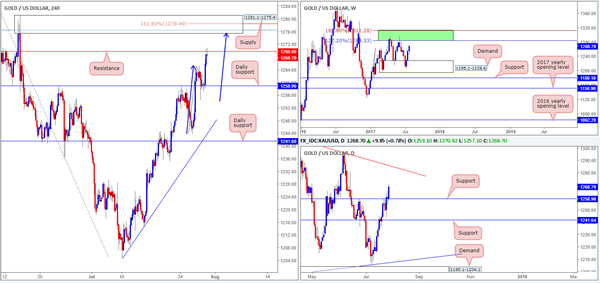
GOLD:
Weekly gain/loss: + $13.8
Weekly closing price: 1268.7
As can be seen from the weekly timeframe the gold market remained strongly bid last week, placing the metal within striking distance of an area comprised of two Fibonacci extensions 161.8/127.2% at 1312.2/1284.3 taken from the low 1188.1 (green zone). Already capping upside on two occasions, will we see history repeat itself from the green area this week?
A closer look at price action on the daily timeframe shows price used support at 1258.9 to trade higher on Friday. Should the bulls remain in position, the next upside hurdle in the firing range will likely be the trendline resistance extended from the high 1337.3.
Moving across to the H4 timeframe, we can see that price stalled at resistance drawn from 1269.8 going into the closing bell. The H4 supply at 1281.1-1275.4 seen above this line, however, is interesting. Encased within the area is a H4 AB=CD (blue arrows) 161.8% Fib ext. at 1278.4 drawn from the low 1243.6, and a H4 78.6% Fib resistance (blue line) at 1276.5 taken from the high 1296.0. The question is, will this H4 supply be enough to halt further buying, as both the weekly and daily timeframes show room to trade beyond this zone?
Our suggestions: Despite the confluence, we would strongly recommend waiting for additional candle confirmation to form from the current H4 supply, before pulling the trigger. Should one short the current H4 supply, you are effectively trading against higher-timeframe flow here and by doing so you are putting yourself at extra risk, in our opinion.
Personally speaking, we are going to refrain from taking shorts here. The feeling of going against higher-timeframe buyers from the H4 area just doesn't sit right with us.
Levels to watch/live orders:
- Buys: Flat (stop loss: N/A).
- Sells: Flat (stop loss: N/A).
Market Morning Briefing: Aussie Hit A High Of 0.8065 Last Week
STOCKS
Dow (21830.31, +0.15%) continues to rise and looks potentially bullish for the near term. Immediate target is 22000 for the next few sessions.
Dax (12162.70, -0.40%) is testing support near current levels and while that holds, the index has fair chances of moving up towards 12750-13000 levels in the coming sessions. Only a break of the support, if seen could force us to look at lower levels.
Shanghai (3262.86, +0.30%) has resumed its rally and is heading towards 3280 in the next few sessions before facing slight rejection from there. Near term looks bullish.
Nikkei (19946.32, -0.07%) could possibly be ranged or move down in the near term while Dollar Yen is headed towards 110-109. Although the index itself looks potentially bullish the strength in Yen is preventing an immediate rise in Nikkei. Near term trade expected in the 19800-20200 region.
Nifty (10014.50, -0.06%) is trading within the near term up channel and could remain in the 10200-9900 region for the next few sessions. Immediate trend is up but we could expect some interim corrections while the index rises gradually.
COMMODITIES
Gold (1268) moved higher and hovering around our target of 1270. Now it is trading within the range of 1258-70.Gold is overbought in near term time frame, thus we are not confident about the sustainability beyond 1270 regions. There is a possibility of a correction towards 1245 in short term time frame, but we will remain bullish on Gold while it is trading above 1245 regions. Silver (16.72) is also out of its recent bearish zone and trading within the range of 16.50- 17. Recent strength in copper has supported Silver to trade above 16.50 levels.
Copper (2.90) moved higher in line with our expectation and looks on a firm footing while it is trading above 2.78 levels. Midterm resistance comes at 3.12 regions from where we may see some correction due to profit taking.
Brent (52.34) is out of its midterm bearish channel as it is trading above 51.30 regions. Immediate resistance comes at 53 levels and a close above that could open up 56 as well. WTI (49.87) is also moved higher and a close above 51 could be the end of midterm bearish trend in WTI too. We are bullish on oil since 10th of July onward and there is no reason to change our bullish stance while Brent and WTI are trading above 51 and 48 levels on a weekly closing basis.
FOREX
US GDP is back to its steady growth but no sign of any exciting acceleration keeps the chances of Fed taking any further hawkish steps low. Dollar remains weak and the majors keep their upside momentum intact.
Dollar Index (93.41) has lost of the most of the gains made from the low of 93.15 and the chances of retesting 93.00 or even 92.00 look stronger now, in line with our expectations. Euro (1.1734) is stalling near the high of 1.1777 registered last week but the target of 1.1800 and 1.2000 remain unchanged.
Repeat - Euro is in the most overbought condition since 2008 and Dollar in the most oversold condition since 2011, which warrants a consolidation phase at least if not an outright sharp correction. So follow the trend without underestimating the possibility of a sharp reversal in the coming sessions.
Dollar-Yen (110.55) is testing our support zone of 110.50-30 but no strong recovery has been seen yet. If 110.30 fails to contain the decline, it may fall further towards 109.50. On the other hand, a bounce from the current levels can take it higher to the resistance of 111.40-112.00. The price action at the current levels may determine the near term path. Bias neutral.
Pound (1.3126) has not managed a break above the major resistance of 1.32 so far which keeps the possibility of a break below 1.30 open. In case 1.30 breaks down, the trend may reverse to the downside in the near term with targets of 1.28 and lower.
Aussie (0.7973) hit a high of 0.8065 last week, close to our initial target of 0.8100. With the current consolidation expected to be over by the end of the week, the larger uptrend may resume for higher targets of 0.8100-70. Repeat - only a break below 0.7925 may signal a consolidation phase in the range of 0.7870-0.8050 for a few days to be followed by a fresh rise.
Closing below 64.25 has weakened Dollar Rupee (64.15) technical structure and increased the chances of a break below 64.09 considerably. This week may see 63.90 on a break below 64.09 and even lower levels if 63.90 fails to hold.
INTEREST RATES
Sideways move had been seen in across all The US yields . As mentioned earlier, yield s could remain stable in the coming sessions before we see another down leg. The 30Yr (2.88%) is targeting 3% while the 10YR (2.28%) and the 5Yr (1.82%) are targeting levels near 2.40% and 2% respectively.If these resistances hold then We might see some fresh buying in U.S Bonds in coming weeks.
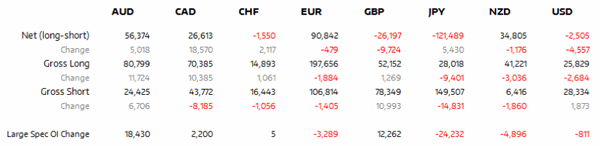
Back To The Futures: 31st July 2017
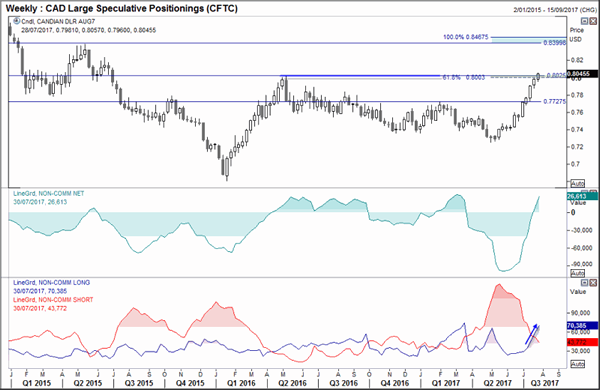
A snapshot of large speculator's poitioning from the weekly CFTC report and analysis of related futures markets.
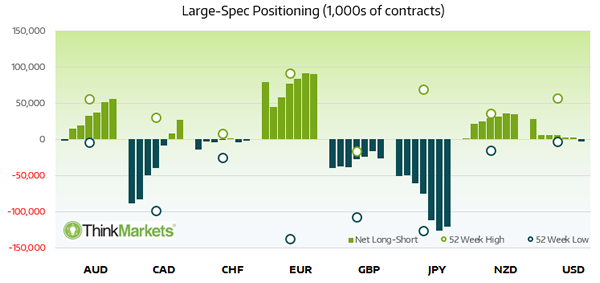
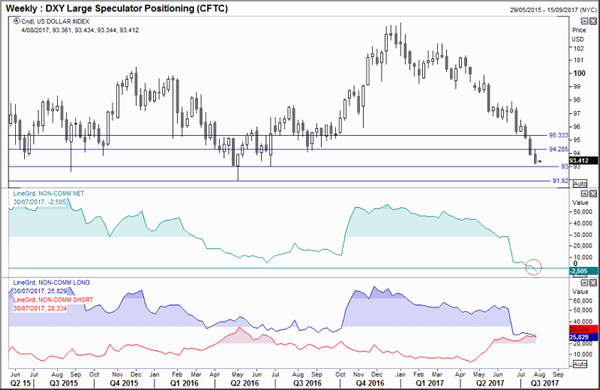
US Dollar index is now net short for the first time since June 2014
- The Canadian Dollar saw the largest week change of net positioning (+18.6k) which saw an increase of 10.4k long contracts and -8.2k short contracts.
- Overall it was minor adjustments to net positioning last week. With the exception of CAD, all other majors saw weekly net change below 10k
DXY: The US Dollar Index is now net short for the first time since June 2014. Momentum suggests we could be in for a break of 93 this week and head for the 91.92 low. This would be a significant event if this were to break, although we doubt it would do so upon first attempt. For now the near-term bias is for losses, although we are also aware of the potential for this to correct. Euro (below) made a suspiciously small bullish close last week to warn of sideways trading, and commodity currencies remain our preferred long bets this week.
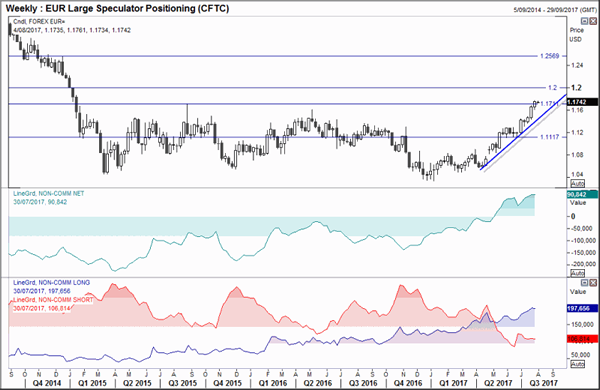
EUR: The close above the 2015 finally saw Euro break out of the 2.5yr range and likely has further to go from here. However, as last week’s range was relatively low and we have seen a slight reduction of hope interest, we suspect a pause in the rally may be due with potential for a correction. Even if we were to see sideways trading it would allow for rice to retest the bullish trendline where it could then make a run for 1.20.
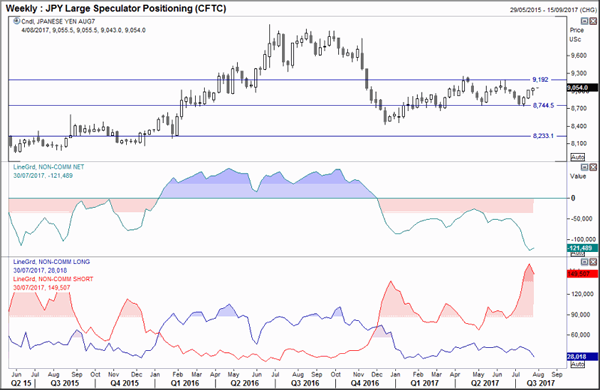
JPY: The third consecutive bullish week presented a hanging man candle to warn of potential weakness. However, we have seen a drop of short interest and long interest which also brings into question the strength of the past three weeks. As long interest is on the decline we doubt it will break above 9,192, although if we are to see this break to the upside we would want to see an increase in long positioning to confirm it.
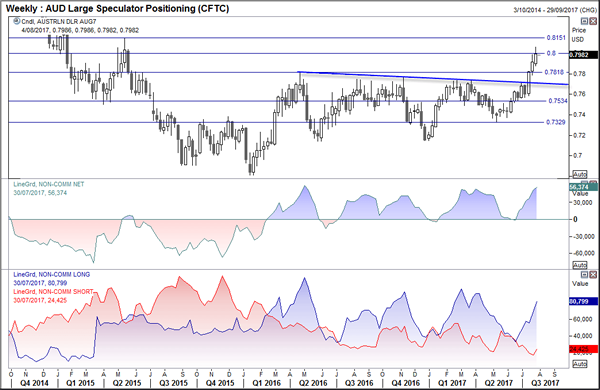
AUD: Net positioning is the most bullish since May 2016, although we also note a minor uptick in short interest. RBA are likely to verbally intervene as a rising currency creates issues for exports and growth, and this week’s RBA meeting may be the time to expect it. Technically it looks like it wants to push for the 0.8150 high, which is a likely outcome if the US Dollar continues to fall. As it is the Dollar’s weakness, not what RBA say that is the key driver here, so whilst US remains weak then AUD is on our bullish watchlist and RBS intervention is more likely to create a minor pullback over a reversal.
CAD: The close above the 2016 high last week puts the Canadian Dollar at its highest level since July 2015. The rally has been seen on rising bullish and falling bearish interest, making it a healthy trend with further upside potential. As BoC are less likely to verbally intervene, this makes CAD longs preferred over AUD, although both have potential to rise.
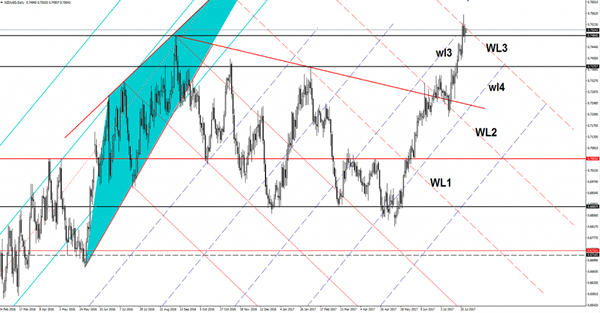
NZD/USD Another Breakout Attempt
Price has managed to stay above the 0.7484 major broken static resistance and now is pressuring the warning line (WL3) again, a valid breakout will bring us a very good buying opportunity. However a rejection followed by a drop below the 0.7484 will confirm a drop towards the 0.7375 and towards the fourth warning line (wl4).
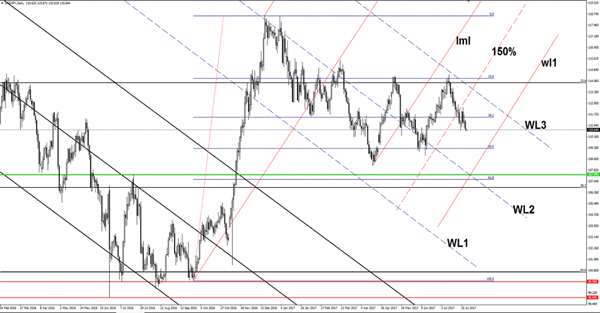
USD/JPY Bears In Control
The USD/JPY is trading in the red and looks determined to resume the corrective phase, is trading right above the 110.50 level, but should touch the 109.50 very soon.
Personaly, I believe that the Yen will dominate the currency market in the upcoming weeks as the Nikkei could drop much deeper after several false breakouts above the 20058 major static resistance. JP225 is expected to approach and reach the 19700 level, a valid breakdown below this obstacle will open the door for more declines.
USD/JPY should reach the 50% retracement level and the warning line (wl1) of the former ascending pitchfork.
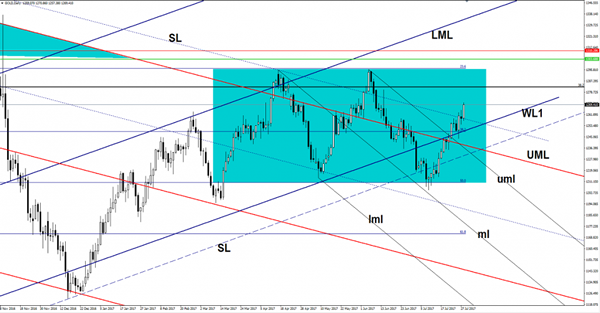
Gold Strongly Bullish
Price edges higher on the Daily chart and should reach fresh new highs in the upcoming period, is strongly bullish as the USDX has plunged again. The yellow metal move sideways, but with a bullish perspective, is located in the buyer’s territory after a valid breakout above some major resistance levels.
Gold has taken advantage of the weak dollar, the USDX should drop much deeper on the Daily chart because looks too heavy to be stopped. USDX is still expected to reach the 92.49 static support, where he could find support again, right now we don’t have any reversal sign because the United States data continues to come in mixed.
The Gold could climb much higher in the fresh start of the week if the Australian data will come in better, the HIA New Home sales and the MI Inflation will be released first, while the Private Sector Credit could increase by 0.4% and could match the 0.4% growth in the former reading period.
The Chinese Manufacturing PMI may increase from 51.7 to 51.5 signalling a further expansion, the Non-Manufacturing PMI will be released as well, a positive data will boost the Aussie, which will increase versus the greenback.
Price rallied on Friday and touched the 1270 level, should climb much higher in the upcoming days, the next upside target will be at the 38.2% retracement level. Most likely will ignore the mentioned obstacle if the USDX will slide further and could reach the 23.6% retracement level, which also represents the sideways movement resistance.
You can notice that the rate continues to move in range, but most likely will escape from this pattern after the breakout above the sliding line (descending dotted line).