Sample Category Title
Summary 7/31 – 8/4
Monday, Jul 31, 2017
[php_everywhere] [/php_everywhere]
Tuesday, Aug 1, 2017
[php_everywhere] [/php_everywhere]
Wednesday, Aug 2, 2017
[php_everywhere] [/php_everywhere]
Thursday, Aug 3, 2017
[php_everywhere] [/php_everywhere]
Friday, Aug 4, 2017
[php_everywhere] [/php_everywhere].
Weekly Economic and Financial Commentary
U.S. Review
The U.S. Economy Rose 2.6 Percent in Q2
- The first look at economic growth in the second quarter came in at 2.6 percent, boosted by strong performances in personal consumption, nonresidential investment and trade.
- Earlier in the week, new data on the housing market, new and existing home sales and home prices, all came in close to expectations and pointed to healthy demand running into supply constraints. Consumer confidence surprised to the upside for July as did the durable goods report for June.
GDP Growth Comes Back in Q2
As we expected, economic growth bounced back in the second quarter, up 2.6 percent after a downwardly revised 1.2 percent growth in Q1. There were few surprises; personal consumption, nonresidential investment, government and trade were all supportive of second quarter growth. Residential investment declined after an outsized Q1 gain, and change in inventories had very little effect.
Residential fixed investment fell 6.8 percent in Q2 following its impressive 11.1 percent increase in the first quarter. Mild weather was a boost to construction in the winter months, which was partially at play in the Q1 jump. With more normal weather in the spring, the housing market in Q2 reflected two competing economic pressures; strong income and job growth is pushing up demand while the supply of available homes remains stubbornly lean. Home sales data for June underscored this imbalance. Existing home sales declined more than expected, falling 1.8 percent to a 5.52M-unit annual pace. Much of the crowding out has been on the lower end of the price range. Homes priced less than $250,000 account for the smallest share of sales in four years, when the National Association of Realtors began tracking the distribution. The resulting pressure on home prices continues to build; both median and average prices of resales were at record highs in June. We looked closely at home price measures in our publication Western Markets Drive Home Prices Higher this week, which is available on our website or by request. New home sales rose slightly in June, but downward revisions to previous months brought the Q2 sales level below that of Q1, which was reflected in the GDP print this morning. On a positive note, the median price for a new home declined in June as sales shifted toward lower priced homes—a welcome development for firsttime buyers.
The Conference Board's Consumer Confidence index surprised to the upside in July. The University of Michigan's consumer sentiment survey indicated election euphoria was wearing off, though the confidence measure disputed that notion. Mixed messages from the two measures of the mood of the consumer, the most important source of economic growth, bear watching. Confidence about the present situation is the highest it has been since the early 2000s, as consumers are increasingly finding jobs plentiful. Consumer sentiment about the current situation has also skyrocketed in recent years, echoing the idea that the U.S. economy is on solid footing and more consumers are benefitting from it. The two surveys also show diminished expectations, though the confidence survey reversed in July, which suggests the unease over Washington gridlock may have a smaller impact on the consumer than initially thought.
A strong jump in aircraft orders boosted durable goods orders by 6.5 percent in June, though orders excluding transportation, a proxy for future activity, eased from May's stronger-than-firstreported showing. Core shipments, a proxy for current business investment, also eased somewhat. The three month annualized rate softened to its lowest pace this year for both orders and shipments of core capital goods.
U.S. Outlook
Personal Income • Tuesday
Personal income growth accelerated in April and May, rising 0.3 and 0.4 percent, respectively. The continued pace of job growth has helped to maintain momentum behind income growth since the beginning of the year. More importantly, in our view, for the prospects for real consumer spending growth is real disposable income, which rose 0.6 percent in May. The low inflation environment that has persisted over the last few months has helped to lift discretionary income for consumers. The headline PCE deflator has declined in two of the last three months. On a yearover- year basis the headline deflator is up just 1.4 percent. We expect another soft inflation print in June with a flat reading. We also expect personal income growth remained steady at 0.3 percent in June, which supports our case for continued gains in real consumer spending in the second half of the year.
Previous: 0.4% Wells Fargo: 0.3% Consensus: 0.4%
ISM Manufacturing • Tuesday
The Institute for Supply Management's manufacturing survey jumped 2.9 points in June to 57.8, the highest reading since August 2014. The forward-looking new orders component also rose sharply from 59.5 in May to 63.5 in June. While the optimism among the manufacturing sector is welcome news, we are skeptical that such a robust trend can continue for a couple of reasons. First, we saw a surge in business investment in Q1 which downshifted in the second quarter. With only modest improvement in global demand, we do not see business investment accelerating much in the second half of the year. Second, the surge in optimism coincided with expectations for a large corporate tax cut. While we still assume some tax cuts will take place, we are skeptical that they will be large. Looking ahead to July's reading, we expect the ISM manufacturing reading pulled back to 56.1 for the month.
Previous: 57.8 Wells Fargo: 56.1 Consensus: 56.4
Employment • Friday
Nonfarm payrolls rose by 222,000 in June while the unemployment rate edged higher to 4.4 percent. One of the more disappointing aspects of the report was the very modest rise in average hourly earnings. While there have been minor month to month fluctuations in the headline nonfarm number, as can be seen in the graph to the right, the 12-month average has remained relatively steady over the past several months at 187,000. Looking ahead to next Friday's employment situation release for July, we estimate that nonfarm payrolls increased by 195,000 in July and the unemployment rate fell back to 4.3 percent. As the year progresses, we continue to estimate average monthly job growth in the 150,000 range and expect the unemployment rate to fall to 4.2 percent by the fourth quarter of this year.
Previous: 222,000 Wells Fargo: 195,000 Consensus: 180,000
Global Review
Lack of Inflation in Japan Buys BoJ More Time
- The year-over-year rate of CPI inflation in Japan came in at just 0.4 percent in June. The Bank of Japan (BoJ) is the only major foreign central bank not even discussing normalization of accommodative monetary policy. Given these inflation numbers, there is no hurry.
- In this week's Global Review on page 4 we also discuss the latest GDP figures for the U.K. and Korea as well as the latest signals of business activity in Europe.
Eurozone PMIs: Less "Robust"
After ECB President Draghi's reference last week to the "robust recovery" going on in the Eurozone, financial markets started this week with news that the July business activity in Europe was weaker than expected. While the PMIs have been in expansion territory for the past four years, only recently have they broken north of 55. Although this gauge of business sentiment slipped in July, the current level for both the manufacturing and the service sector remains above 55; still consistent with steady expansion. As we discuss on the next page in the International Outlook, next week brings the first look at GDP data for Q2.
Soft U.K. GDP Means Less Urgency for Bank of England
Recent meetings of the Bank of England's (BoE) Monetary Policy Committee have shown growing dissent over keeping rates unchanged with some members calling for rate increases. The shift to a more hawkish bias was one of a number of factors driving British pound sterling higher over the past few months.
The momentum toward an eventual rate hike has been dealt with a series of modest setbacks beginning with a June CPI report released last week which showed virtually no inflation in the month-over-month rate for June. Then earlier this week, we learned that second quarter GDP growth in the United Kingdom remained modest. After a 0.2 percent increase in the first quarter, the economy there grew 0.3 percent (1.2 percent annualized) in the second.
Given the soft inflation backdrop, we expect the BoE will refrain from raising rates through at least the end of 2017. Our forecast looks for real GDP growth in the United Kingdom to strengthen modestly in 2018, although uncertainty related to Brexit continues to lurk in the background as a major downside risk to the economy.
Korean Economy Poised for Growth Despite Tepid GDP
The Korean economy downshifted in Q2 partly due to a slowdown in trade. But a newly announced economic plan and indications of détente in the trade spat with China suggest upside potential in the second half.
Additionally, the Korean government announced a new 5-year economic plan which aims to maintain expansionary fiscal policy to support what it reckons will be 3.0 percent growth this year, up from 2.6 percent previously. The Bank of Korea also revised its own forecast, lifting the full-year growth figure to 2.8 percent.
Lack of CPI Inflation Justifies Dovish Stance at BoJ
At its policy meeting last week, the Bank of Japan maintained its comprehensive program of policy easing with no clear end in sight, even as other central banks are at least talking about the eventual normalization of monetary policy.
Japanese CPI came in this week at just 0.4 percent year over year, which justifies the BoJ's accommodative stance. Aside from a brief spurt after the 2014 consumption tax, sustained inflation north of 2.0 percent has not been achieved since the early 1990s.
Global Outlook
Mexican GDP • Monday
Much like the colossus sitting on its northern border, the Mexican economy has been growing at an uninspired pace over the past few years. In recent quarters, real GDP growth has been driven by the primary sector (agriculture) and the tertiary second (services). In contrast, growth in the secondary sector (manufacturing, mining and construction) has generally been weak, although manufacturing output has accelerated in recent months. The pickup in manufacturing production in Mexico is due, at least in part, to strength in auto exports.
The consensus forecast looks for some payback in the year-overyear real GDP growth rate in Q2 from the relative strength that was registered in Q1. That said, most analysts, ourselves included, look for the Mexican economy to slowly pick up steam in coming quarters as global GDP growth continues to firm.
Previous: 2.8% (Year-over-Year) Consensus: 1.9%
Eurozone GDP • Tuesday
Real GDP in the Eurozone grew 0.6 percent (not annualized) in Q1-2017, the strongest rate of sequential growth in two years. Moreover, the expansion is becoming increasingly self-sustaining as the drivers of growth are broad based and not concentrated in one sector or one spending category. We and the consensus look for another solid growth performance in Q2.
Nevertheless, inflationary pressures in the euro area are benign at present. In that regard, the "flash" estimate of CPI inflation in July will be on the docket on Monday. Unless inflation should rise suddenly, which we think is unlikely, the ECB likely will continue to maintain an accommodative policy stance for the foreseeable future. The July PMIs for the manufacturing and service sectors will also print next week, although they likely will not be materially different from the preliminary estimates that were released last week.
Previous: 0.6% (Quarter-on-Quarter) Wells Fargo: 0.5% Consensus: 0.6%
Bank of England Policy Meeting • Thursday
Following its 25 bps rate cut last August in the immediate aftermath of the Brexit referendum, the Monetary Policy Committee (MPC) has maintained its main policy rate at 0.25 percent. In our view, there is a high probability that the MPC will keep the Bank Rate unchanged at its August 3 policy meeting as well as for the foreseeable future. As noted on page 4, real GDP grew only 1.2 percent at an annualized rate in Q2-2017. Although CPI inflation is currently running above the MPC's target of two percent, slow economic growth in conjunction with the recent stability in the value of sterling should cause inflation to recede in coming months.
There are very few data points from the third quarter yet, although next week's release of the manufacturing PMI (Tuesday) and the service sector PMI (Thursday) will give analysts some insights into the present state of the British economy.
Previous: 0.25% Wells Fargo: 0.25% Consensus: 0.25%
Point of View
Interest Rate Watch
Defining Normalization
Since the 2008-2009 recession, the PCE deflator has consistently averaged less that the two percent target that the FOMC has identified. In fact, in only one year, 2011, did the pace of the PCE deflator exceed two percent and that one year result reflected a coincidence of transitory factors. The year 2011 was characterized by a jump in oil prices, dollar weakness which boosted import prices for energy and food and then finally the earthquake in Japan which lifted auto prices.
Late Cycle Pressures
As the economic cycle matures, increases in economic growth typically are associated with a reduction in the remaining economic resources that are idle and therefore the price for these resources is bid up. This provides the basis for the expectation at the FOMC that inflation rises as the cycle matures.
Yet, as illustrated in the middle graph, the PCE projections for 2017 did not reflect an acceleration of the PCE measure of inflation and in fact the projections dropped even as the unemployment rate declined.
If resource constraints matter, why not an acceleration of inflation in 2017 as the unemployment rate declined?
Over the Long Run, Real interest Rates to Rise?
Long-run unemployment rate projections, bottom graph, illustrate the FOMC expectations that the unemployment rate would decline and, given a Phillips model, the expectation for inflation to rise.
With the Phillips model projection of higher inflation, the FOMC would be expected to raise the nominal FFR over the next year at a pace in excess of the expected increase in the rate of inflation implied by the FOMC projections. Moreover, reduction in the Fed balance sheet would put added upside pressure on benchmark U.S. Treasury rates.
Net, real interest rates would be expected to rise with an anticipated negative impact on economic growth.
Credit Market Insights
Confidence Suggesting Loan Growth?
The Conference Board's Consumer Confidence Index revealed continued widespread optimism in June. The present situation index as well as the future expectations index increased over the month, while the difference between the jobs plentiful and jobs hard to get indices indicates that expectations are for the unemployment rate to continue its descent. This most recent reading was the second highest in 16 years, reflecting the significance and scope of optimism.
Interestingly, plans to buy in the June report were mixed despite this level of confidence. Plans to buy a home jumped to 6.7 percent over the month from 6 percent the month prior, while plans to buy an automobile creeped up slightly to 12.7 percent, up from 12.6 percent. While survey responses do not necessarily translate into action, the increased plans and desire of consumers to purchase large items, such as homes and automobiles, could signal a spike in demand in mortgage and consumer loans. Auto loans in particular have shown growth, up 9.0 percent over the year, but have not quite reached pre-recession levels, while mortgage debt has grown at a slower pace. However, putting a damper on these encouraging plans to buy, consumers planning to buy major appliances dropped broadly on the month. This drop raises questions, as overall consumer confidence is soaring while actual consumer plans to buy major appliances has declined. However, we expect that consumer demand will catch up to confidence, and that consumer loans could experience a jump as well.
Topic of the Week
Something for Optimists and Pessimists Alike
The International Monetary Fund's (IMF) July World Economic Outlook report portrayed the global economy as steadily improving. Although the IMF's headline global growth forecast was unchanged, the forecast revisions diverged for two of the world's largest economies.
The United States and the United Kingdom both saw downward revisions to economic growth projections for 2017, and the IMF shaved a sizable 0.4 percentage points off of its 2018 forecast for the United States. The IMF cited less expansionary fiscal policy assumptions as the key driver of its lower forecast. Outside of these two countries, most of the world's advanced economies saw upward revisions in light of improved economic activity, including Canada, Japan and the euro area, particularly Spain and Italy.
China also received a small boost to its growth forecast, with the IMF now expecting real GDP to rise 6.7 percent in 2017 and 6.4 percent in 2018. The IMF sees the medium-term risks for China as tilted to the downside, however, as Chinese policymakers try to balance the competing demands of deleveraging while also keeping the economy's deceleration to a minimum.
The rebound in global trade from 2015-2016 levels has helped to spur faster growth in the global economy. Our own outlook calls for real global growth to rebound to 3.4 percent this year and hold at that pace through 2018. Although some central banks have either embarked on tightening policy (the Fed, Bank of Canada) or hinted at tighter policy in the future (European Central Bank), on balance monetary policy in many of the world's major economies remains relative easy. That said, a return to the supercharged growth of the past two expansions seems unlikely. Many of the world's advanced economies are grappling with aging populations and sluggish productivity growth, while emerging market economies face still-low commodity prices and must innovate as the low-hanging economic fruit disappears.
The Weekly Bottom Line
U.S. Highlights
- It was a good start to the week for U.S. equities, with stock prices boosted by another round of strong earnings reports and a weakening in the US dollar to its lowest level in over a year. However, these gains were offset by dips in health care and tech stocks by Friday afternoon.
- As expected, the FOMC voted unanimously to leave its benchmark rate unchanged, while signalling that the balance sheet normalization process will likely begin in October.
- The American economy accelerated in Q2, returning to a slack-absorbing pace of 2.6% growth, led by strength in consumption and private fixed investment.
Canadian Highlights
- The Canadian dollar hit a 2-year high of 80 US cents this week, marking a 10% gain since May. Gains were driven by robust economic data, expectations for further Bank of Canada rate hikes and rising oil prices.
- The Canadian economy expanded by 0.6% in May, with growth fairly broad-based across industries. This puts tracking for the second quarter at 3.8%.
- The WTI oil benchmark rose 7.5% from last week's close, to over US$49 per barrel, driven by another decline in US inventory levels and a pledge from Saudi Arabia to reduce exports.
U.S. - Growth Accelerates in Q2
It was a good start to the week for U.S. equities, with stock prices boosted by another round of strong earnings reports. Consumer discretionary and staples led the sectors in performance, a reflection of the increasingly important role that consumer spending is having in lifting growth. Energy stocks also posted large gains, helped by a rebound in the price of oil amid Saudi Arabia's commitment to restrict oil exports in August and another bullish U.S. inventory report (Chart 1). By the end of the week, the weighty tech and health care sectors offset these gains. A weakening in the USD provided support for equities, notably early in the week, while European indices were weighed down by an appreciation in the sterling and the euro vis-à-vis the greenback – which fell to its lowest level in over a year.
The dollar did not get much support from the FOMC. As expected, the Committee voted unanimously to leave its benchmark rate unchanged, but the policy statement highlighted a dovish turn, with the Committee appearing more concerned about the tepid inflation data. This led markets to push out Fed hike expectations. Despite this, the Committee expressed their intention to begin the process of balance sheet normalization "relatively soon". This is likely to be announced at the FOMC meeting in September, with run-off to begin in October. However, another rate hike is unlikely until at least the end of the year. We expect that a December hike may yet happen, but such an outcome depends on inflation firming in the coming months. Many of the disinflationary pressures appear to be transitory in nature, with cell phone discounts, lower commodity prices, and falling prices of imported goods related to past US dollar strength. But these pressures should ease in the second half of the year, while the USD upside potential remains limited for three reasons. For one, the Fed's rate hike trajectory looks to be more gradual than previously communicated. Secondly, the balance sheet normalization will have a smaller currency impact than an equivalent rate increase, and lastly, strengthening global economies should allow central banks such as the ECB and BoE to pare back supportive monetary policy measures. Second quarter data supports this view, with both French and Spanish economies having expanded at a healthy pace in Q2.
The American economy also accelerated in the second quarter, largely as expected, returning to a slack-absorbing pace of growth (Chart 2). Led by strength in consumption and private fixed investment, the second quarter saw the economy expand by 2.6%. The consumer's role in Q2 growth was highlighted by strength in spending on goods after a weak showing at the start of the year. And with job and income growth remaining strong, there is room for further advancement on this front over the remainder of the year.
Remaining top-tier domestic data releases this week telegraphed a mixed picture of the housing market. Existing home sales pulled back to a still healthy 5.52 million (annualized) as lack of inventory and eroding affordability prevented purchases. At the same time, new home sales ticked up 9.1% from a year ago, suggesting that demand remains intact. We look forward to next week's bevy of reports that should clarify how the economy has done in the first month of the third quarter, with the employment, income & spending, and ISM survey reports being top of mind, as we seek confirmation that economic momentum remains robust during the third quarter.
Canada - The Loonie Continues To Soar
It was a quiet week in terms of Canadian economic data, with this morning's GDP report the only key release. But that didn't stop the Canadian dollar from soaring to a two-year high of over 80 US cents. The loonie has generally been on the rise over the last couple of months, up 10% from a low of just under 73 US cents in May. The recent appreciation has been driven by a few key factors, including strong economic growth, some convergence in the direction of monetary policy – and thus a narrowing in bond yield spreads – with the U.S., and higher oil prices.
The Canadian economy has been outperforming since mid-2016, and it looks like growth in the second quarter of this year will continue the trend. Following a 0.2% advance in April, the Canadian economy expanded by an eye-popping 0.6% in May, with the growth fairly broad based across industries. This puts the second quarter on track for robust growth of 3.8%. The steady string of strong economic data, particularly relative to other G7 countries including the U.S., has certainly been supportive for the Canadian dollar.
It has also helped underpin the about-face by the Bank of Canada with respect to its stance on monetary policy, with a six-week period of hawkish rhetoric leading the central bank to hike rates for the first time in seven years in July. Indeed, the Bank indicated that despite a soft inflation backdrop, the economy is on a stronger footing and the emergency level of interest rates that were needed during the oil price collapse are no longer warranted. This follows the lead of the Federal Reserve that began a slow rate hiking cycle at the tail end of 2015. This change in direction of monetary policy – putting it more in line with that in the U.S. – has helped drive the loonie higher.
Meanwhile, crude oil prices have also picked up, reaching a two-month high of US$49 per barrel this week. This marked a 7.5% increase over last Friday's close. Gains were largely prompted by a third consecutive decline in weekly U.S. inventories and a pledge from Saudi Arabia to reduce exports, particularly to the U.S. where stock levels are heavily scrutinized. Indeed, the Saudi rhetoric was the only constructive development that came out of the meeting of the OPEC-Non-OPEC group at the start of the week, as the deal was essentially left unchanged. The group did however indicate that Nigeria and Libya – which are currently exempt from output restrictions and have been ramping up production in recent months – could become part of the deal once they reach a specific level of production on a sustainable basis.
Given the relatively quick ascent of the loonie in recent weeks, the upside is likely limited going forward. While we expect oil prices to gradually creep higher, they will remain vulnerable to any bearish indicators, with the risks largely tilted to the downside. Meanwhile, the economy is unlikely to maintain the stellar pace of growth seen in recent quarters. Still, it should remain healthy, allowing the Bank of Canada to hike rates again in the fall of this year and twice more in 2018. With much of these expectations already priced in, we expect the Canadian dollar to hold at around 79 US cents through 2018.
U.S.: Upcoming Key Economic Releases
U.S. ISM Manufacturing Index - July
Release Date: August 1, 2017
Previous Result: 57.8
TD Forecast: 56.9
Consensus: 56.2
TD looks for ISM Manufacturing to post a modest pullback to 56.9 from 57.8. The dip partly reflects a correction from the June pickup and would be in line with the slips registered in both ISM-adjusted Empire and Philly Fed indexes. Hard data such as manufacturing production is supportive of only a partial reversal.
U.S. ISM Non-Manufacturing Index - July
Release Date: August 3, 2017
Previous Result: 57.4
TD Forecast: 57.0
Consensus: 56.8
The ISM non-manufacturing index released later in the week should show a similar story of sustained strength as its manufacturing counterpart, albeit at a slightly softer pace (57.0 vs 57.4). Both releases would be supportive of above-trend GDP growth in the third quarter.
U.S. Employment - June
Release Date: August 4, 2017
Previous Result: 222k, unemployment rate 4.4%
TD Forecast: 190k, unemployment rate 4.3%
Consensus: 180k, unemployment rate 4.3%
We expect July nonfarm payroll employment to moderate to a 190k pace after registering a better than expected 222kk gain in June. Labor market indicators on balance point to another gain in the vicinity of 200k. However, we see risk for a sharp pullback in government jobs from their outsized 35k gain in June, thereby dampening headline growth.
We expect the unemployment rate to slip back to 4.3% on the back of robust employment growth. On wages, calendar effects point to a 0.3% m/m increase in average hourly earnings, but base effects may leave a year-on-year pace lower at 2.4% vs 2.5%. A pickup in wage growth will help strengthen the Fed's, and the markets', conviction on raising rates this year, and thus we expect this indicator to drive the market response.
U.S. Personal Income & Spending - June
Release Date: August 1, 2017
Previous Result: Income 0.4% m/m, spending 0.1% m/m
TD Forecast: Income 0.4% m/m, spending 0.1% m/m
Consensus: Income 0.4% m/m, spending 0.1% m/m
Headline PCE inflation is expected to advance 1.4% in June, which we believe is consistent with a 1.6% pace for Q2 as a whole as reported in the advance GDP release. That would reflect unchanged prices on the month, including a drag from energy prices. We look for the June core PCE index to rise 0.1% m/m, consistent with the core CPI release. On a year-ago basis, the advance Q2 GDP release suggests that core PCE inflation likely rose 1.5% y/y in June, which is slightly above pre-GDP consensus expectations for a 1.4% y/y increase. The June report itself should show continued weakness in "transitory" factors, including cellphone services, with risk for further softness in healthcare services prices.
Nominal PCE (personal spending) is expected to post a relatively soft 0.1% rise in June, though past revisions point to risk for a slightly stronger gain. The quarterly gain is already reported and came in at a solid 2.8%, but the June figure is important for gauging the handoff to Q3. We also expect a solid 0.4% increase in June personal income, though past revisions also suggest scope for surprise.
Canada: Upcoming Key Economic Releases
Canadian International Trade - June
Release Date: August 4, 2017
Previous Result: -$1.10b
TD Forecast: -$1.40b
Consensus: -$0.90b
The international trade deficit is forecast to widen further to $1.4bn in June. The appreciation of the Canadian dollar following the Bank of Canada's hawkish pivot should lead to softer exports and imports while another decline in energy prices will weigh on the nominal print. Crude oil prices fell by roughly 6% in June but we think there is scope for export volumes to increase after a surge in production during May. Meanwhile, non-energy exports should see a more modest decline due primarily to a drag from weaker motor vehicle shipments. On the other side of the ledger, imports should see a modest decline to offset the pullback in export activity. Aircraft imports, which contributed over half of the 2.4% gain last month, could see a minor pullback but should retain most of their strength on deliveries to Air Canada.
Canadian Employment - July
Release Date: August 4, 2017
Previous Result: 45k, unemployment rate: 6.5%
TD Forecast: 0k, unemployment rate: 6.5%
Consensus: 19k, unemployment rate: 6.5%
Employment growth is forecast to pause in July following two months of robust gains. Small business sentiment and hiring intentions have cooled since peaking in May and survey data has pointed towards more subdued hiring conditions in manufacturing. The details of the report will likely show a relative outperformance in goods-sector hiring owing primarily to a pullback in professional services, which is coming off its strongest two-month gain on record with 53k added jobs in May and June. We also expect a continuation of last month's rotation towards part time employment. Seasonal patterns tend to support part time hiring in July and part time employment remains well below its peak level from January, despite full time payrolls adding 175k employees since.
The unemployment rate should hold steady at 6.5% so long as labour force growth does not exceed 20k, which is unlikely following the 0.3pp increase in the participation rate over the last two months. Wage growth could see a pickup on the lagged impact of reduced slack but any improvement should be marginal.
Week Ahead Falling Dollar Awaits US Employment Data
US economic fundamentals to drive dollar this week
The US dollar is lower against the major pairs after the political uncertainty in Washington and mixed economic fundamentals took their toll on the greenback. The first week of August will be full of economic releases with major central banks on the agenda as well as the week wrapping up with the biggest economic indicator in the market, the United States Non-farm payrolls report.
The Reserve Bank of Australia (RBA) will release their August rate statement on Tuesday, August 1 at 12:30 am EDT. The cash rate is not expected to change despite the AUD trading at two year highs versus the USD and RBA policy makers arguing for a lower Aussie. The Bank of England will host another Super Thursday on August 3 at 7:00 am EDT with the release of the Quarterly Inflation Report, the Monetary Policy Summary, and Minutes of the meeting. The rate is expected to remain unchanged despite the narrow vote in June. The rate setting committee is mixed on when to hike rates but the exit of a prominent hawk has pushed back the timing.
US employment has been the biggest driver in the economic recovery narrative and could be called once again to spark USD strength. Jobs week kicks off on Wednesday, August 2 with the publication of the ADP non-farm employment report at 8:15 am EDT. Unemployment claims will be released on Thursday, August 3 at 8:30 am EDT and the week will close with the Non Farm Payrolls report on Friday, August 4 at 8:30 am EDT. Job gains are forecasted to be above 180,000 and wages could gain 0.3 percent pushing the unemployment rate down to 4.3 percent.
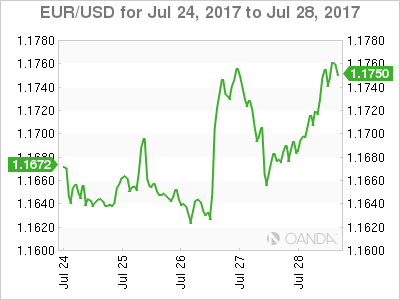
The EUR/USD gained 0.716 percent in the last five days. The single currency is trading at 1.1761 as the US dollar has weakened following a period of political uncertainty in Washington as well as economic growth meeting but not exceeding expectations after the release of the first estimate of gross domestic product (GDP) for the second quarter.
The highlights of the week were the Federal Open Market Committee (FOMC) rate statement and the US GDP first estimate for the second quarter. Both were more dovish than expected. The Fed did as expected by not raising rates and keeping the balance sheet timing in plain view without talking about actual dates but the downgrade on inflation could mean a more patient approach to rate hikes going forward. That decision to remove the "somewhat" language is the Fed admitting inflation is running below its 2 percent target.
The GDP release met expectations with a 2.6 percent gain. The first estimate will be followed by two more revisions, but this one is the one that has the most impact as it sets the basis for Fed forecasts. The euro gained more from the softness of the dollar rather than by improving conditions in the EU. This week the mix of political and fundamental releases did not make the case for a strong dollar. The USD will look ahead to employment data, where once again inflationary data in the form of wage growth will be heavily anticipated.
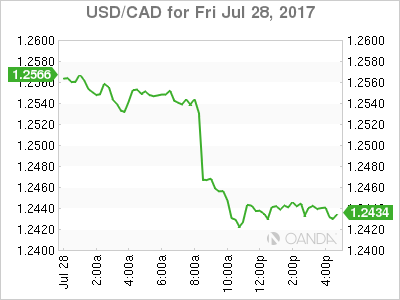
The USD/CAD lost 0.734 percent in the last 24 hours. The currency is trading at 1.2446 after a strong monthly GDP figure in Canada boosting the loony ahead of the dollar. The US GDP released at the same time met the forecast but the lack of wage growth is putting more pressure on the Fed to rethink its third interest rate hike of the year. The Federal Reserve has already raised interest rates twice in 2017 and is expected to begin shrinking the balance sheet it accumulated from its QE program in the fall.
Political uncertainty has sapped the momentum out of the USD. The rally at the beginning of the year is gone after the debacle that has been the attempts to pass healthcare reform. The Trump administration is now focusing on tax reform, but it remains to be seen if they have the political capital left after a very contentious period to repeal Obamacare. Pro-growth policies were also one of the factors behind the dollar rally earlier in the year, but as they got reprioritized that shift also hurt the greenback against majors. A back to basics approach with tax reform learning the lessons from the failure to pass healthcare policies could end up boosting the dollar before the end of the year.
The loonie continues to gain versus the dollar in a rally that started when the Bank of Canada policy makers made hawkish comments back in June and compounding rhetoric changed market expectations on Canadian monetary policy. The BoC hiked interest rates in July and given the pace of growth could do so again in October. Another 25 basis points would bring the Canadian interest rate to 1 percent, where it sat prior to the 2015 cuts and a significant drop in oil prices.
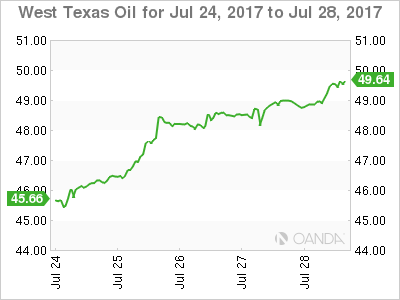
The price of energy gained 1.242 percent on Friday. West Texas Intermediate is trading at $49.48 as the price of crude continues to rise. Bigger than expected drawdowns for the past three weeks and comments from US producers hinting at less output has driven prices higher. The OPEC and other major producers had so far limited output but with the US, Brazil and Canada out of the agreement the global supply glut was not being drained fast enough.
Citing a cutback in capital expenditure US operations will take a step back. At the same time Saudi Arabia has said that it will cut its production further and warned members of the production cut agreement that compliance will be more stringent to make sure stability returns to oil prices.
Oil has gained 8.41 percent in the last five days as the US dollar retreat has also made crude more expensive. Large financial institutions have cut forecasts for this year to a range around $60 per barrel. The two month high that WTI is currently sitting in is a good start, but not enough to convince investors the levels are sustainable. The biggest risk to oil prices remains the continued support from OPEC and other major producers. Infighting inside the OPEC could escalate and tear the organization apart as Saudi Arabia and Iran could take their ideological disputes a step further.
Market events to watch this week:
Tuesday, August 1
- 12:30 am AUD Cash Rate
- 12:30 am AUD RBA Rate Statement
- 4:30 am GBP Manufacturing PMI
- 10:00 am USD ISM Manufacturing PMI
- 6:45 pm NZD Employment Change q/q
Wednesday, August 2
- 4:30 am GBP Construction PMI
- 8:15 am USD ADP Non-Farm Employment Change
- 10:30 am USD Crude Oil Inventories
- 9:30pm AUD Trade Balance
Thursday, August 3
- 4:30 am GBP Services PMI
- 7:00 am GBP BOE Inflation Report
- 7:00 am GBP MPC Official Bank Rate Votes
- 7:00 am GBP Monetary Policy Summary
- 7:00 am GBP Official Bank Rate
- 7:30 am GBP BOE Gov Carney Speaks
- 8:30 am USD Unemployment Claims
- 10:00 am USD ISM Non-Manufacturing PMI
- 9:30 pm AUD RBA Monetary Policy Statement
- 9:30 pm AUD Retail Sales m/m
Friday, August 4
- 8:30 am CAD Employment Change
- 8:30 am CAD Trade Balance
- 8:30 am USD Average Hourly Earnings m/m
- 8:30 am USD Non-Farm Employment Change
BoE & RBA Policy Meetings, US Employment Report, Other Key Data in Focus
Next week's market movers
- In the UK, the BoE's "Super Thursday" policy meeting will probably keep investors on the edge of their seats, amid speculation that the Bank could raise rates as early as this year.
- In Australia, the RBA is anticipated to remain on hold. We think the focus will be on whether policymakers are comfortable with the latest surge in Australian yields as well as AUD appreciation.
- The US jobs data for July are expected to show the labor market continues to tighten. Although that could support expectations for another Fed hike this year, we believe inflation data may be the main determinant of the Fed's next move.
- We also get key economic data from the UK, the US, New Zealand, and Canada.
On Monday, Eurozone's preliminary CPI data for July will be in focus. Without a forecast available yet, we see the case for both the headline and core CPI rates to have held steady, with risks skewed to the upside. The bloc's preliminary Markit composite PMI showed that prices charged rose only modestly in July. We also have to note that the July 2016 monthly CPI prints, which will be dropping out of the yearly calculation now, were -0.6% mom and -0.7% mom for the headline and core rates respectively. Therefore, all these imply that even in case we get soft monthly prints now, as long as they are better than the dreadful prints of July 2016, they could still drag the yearly rates higher.
On Tuesday, during the Asian day, the RBA will announce its policy decision and the forecast is for the Bank to keep rates unchanged once again. July has been anything but boring for AUD traders. The fuss began after the minutes of the latest meeting showed a discussion among policymakers regarding the level of the neutral policy rate in Australia, which was enough to raise speculation that the Bank may be preparing for lift-off soon. However, a few days later, both Governor Lowe and Deputy Governor Debelle poured cold water on such expectations, signaling that markets shouldn't read too much into that conversation. Lowe made it clear that the Bank is likely to stay on hold for the foreseeable future.
Nonetheless, we think that this meeting will be closely watched for any updated signals on policy, and in particular, whether the Bank is comfortable with the latest rise in Australian yields as well as AUD appreciation. Indeed, both Lowe and Debelle noted that a lower AUD would be desirable, implying there is a modest risk that the statement accompanying the decision communicates a similar discomfort with regards to the recent surge in AUD. Looking further ahead though, we believe that the main determinant of whether the RBA will turn hawkish anytime soon may be the wage data for Q2, due out in mid-August, given the latest concerns of RBA officials with regards to wage growth.
In the UK, the manufacturing PMI for July will be in focus. Then on Wednesday, we get the construction index for the same month and subsequently on Thursday, the all-important services print is due out. Even though no forecast is available for any of these figures, we think they will be closely tracked by the market for an indication of how the economy entered the third quarter, following a relatively uninspiring GDP print for Q2.
From the US, we get a raft of economic data. The core PCE price index for June, personal income and spending data also for June, as well as the ISM manufacturing PMI for July, are all due out. Kicking off with the core PCE index for June, without a forecast available, we see the case for the yearly rate to have remained unchanged. Even though the Markit composite PMI for the month showed that average prices charged by firms increased at the fastest pace so far this year, the month's core CPI rate remained unchanged, supporting a similar reaction in the core PCE rate too.
Turning to personal income and spending, expectations are for income to have slowed somewhat from the previous month, while spending is expected to have accelerated somewhat. We view the risks surrounding the income forecast as skewed to the upside, perhaps for an unchanged rate, given that average hourly earnings accelerated slightly during the month. Meanwhile, we view the risks surrounding the spending forecast as tilted to the downside, bearing in mind that retail sales declined in June.
Last but not least, we get the ISM manufacturing PMI for July and then on Thursday, we get the non-manufacturing index for the same month. Both of these figures are expected to have declined. Even though these may be discouraging news for FOMC policymakers, given that both of these indices are still expected to remain at healthy levels, we doubt that such declines are going to materially affect market expectations regarding the timing of the next rate hike.
On Wednesday, during the Asian morning, we get New Zealand's employment report for Q2. Without a forecast available, we see the case for the unemployment rate to have remained near the current low level of 4.9%, while the labor force participation rate may have risen again, for the 6th consecutive quarter. We base our view on the ANZ job ads figure, which continued to rise throughout Q2, suggesting that the labor market may have continued to tighten. Another quarter of strong employment growth would probably be pleasant news for RBNZ policymakers, but coming on top of the notable slowdown in the CPI for Q2, we doubt that these data will be enough to make the Bank shift away from its neutral bias anytime soon.
From the US, we get the ADP employment report for July, two days ahead of nonfarm payrolls. The forecast is for the private sector to have added 185k jobs, notably more than the 158k in June. Such a solid print could heighten speculation that Friday's NFP will also meet its forecast of 180k. Having said this though, we have to sound a note of caution. Even though the ADP print is the only major gauge of the NFP, the correlation between the two figures has fallen notably in recent months.
Thursday is "Super Thursday" in the UK. Besides the BoE rate decision and the meeting minutes, we also get the quarterly Inflation Report, which will be presented by Governor Carney at a press conference after the meeting. At its June meeting, the Bank kept its policy unchanged, but the vote to remain on hold was 5-3, much tighter than the forecast of 7-1.
In the aftermath of the meeting, Governor Carney and Chief Economist Haldane, both hinted that a rate hike may be in the works soon, which raised speculation that the vote may get even tighter and that we may get a hike as early as at this meeting. Nevertheless, soon thereafter, data showed that UK inflation slowed notably, raising doubts as to whether the Bank will indeed proceed with a hike in the foreseeable future. According to the UK overnight index swaps, the market fully prices in a 25bps rate increase in December 2018.
Our own view is that the effect of the weak sterling may start filtering out of the inflation equation in a few months, which combined with the softer energy prices may bring the inflation rate closer to the BoE's target. What's more, even though GDP growth accelerated slightly in Q2, its pace remains lackluster. Soft economic growth and potentially easing inflationary pressures may keep policymakers' hands away from the hiking button, at least for this year. Even if the BoE decides to hike earlier, we expect this to be a one-off move and not the beginning of a normalization period.
We also get the US ISM non-manufacturing PMI for July, as we already outlined above.
Finally on Friday, the US employment report for July will take center stage. The forecast is for nonfarm payrolls to have risen by 180k, less than the 222k in June. The unemployment rate is forecast to have ticked back down to 4.3%, while average hourly earnings are forecast to have accelerated on monthly terms. However, this would still cause the yearly rate to tick down.
Overall this would be another employment report consistent with further tightening in the labor market, which will be pleasant news for Fed officials, and may bring somewhat forth market expectations with regards to the timing of the next rate increase. While the June "dot plot" points to another rate increase this year, according to the fed funds futures, the market is only pricing in roughly a 50% probability for such action.
As for the bigger picture, we believe that the main determinants of whether the Fed will indeed proceed with another rate increase this year are inflation data. The latest prints showed that headline inflation slowed for the 4th consecutive month, while the core rate remained unchanged after falling for four months in a row as well. In our view, a strong rebound in inflation is needed before rate-hike expectations rise materially and help the dollar reverse its latest downtrend.
We also get employment data for July from Canada, though no forecast is available yet. Neither the Markit nor the Ivey PMIs for the month have been released yet ether, so we do not have any gauges of how the labor market fared in July. In any case, these data will be closely watched amid heightened speculation for another BoC rate hike this year. At the time of writing, market pricing suggests that another hike by year-end is fully priced, according to Canada's overnight index swaps. As such, we think that the risks surrounding the Loonie moving forward are likely tilted to the downside. If economic data and developments are encouraging over the next months, they would only confirm current market pricing for a hike and may thus have little effect on CAD. On the other hand, however, in case economic indicators deteriorate, expectations for a hike could come down, possibly dragging the Loonie down with them.

What’s Driving CHF Weakness?
- What's Driving CHF Weakness - Peter Rosenstreich
- The Future Of Bitcoin - Buy Fear, Sell Greed - Yann Quelenn
- USD In The Doldrums. Will It Last? - Arnaud Masset
- Video Game Industry
Economics - What's Driving CHF Weakness?
The aggressive move higher in EURCHF has FX traders buzzing. Despite rumours of M&A flows and mixed Swiss economic data there was really no fundamentals event trigger driving the move. While the timing is headscratching the mounting headwinds was eventually going to catch up with the CHF. Placing the blame on SNB Jordon calling the CHF overvalued would be completely off base as he and other Swiss central banker have held the "overvalued" corporate for years. The Swiss economic outlook remains cloudy while Europe continues to improve. Monetary policy shift have been the defining driver for FX price in the last 10 years. Weak inflation forecast will keep the SNB accommodative while the ECB is clearly shifting toward "normalization." There has been a clear trend for G10 central banks to consider balance sheet consolidation (primary driver of recent FX moves), at the same time the SNB remains focused on balance sheet expansion. This monetary policy strategy divergence makes selling CHF an obvious trade. The SNB remains dedicated to balance sheet expansion, as long as they don't get hurt.
In addition as political uncertainty in Europe has all but disappears the primary driver of risk aversion CHF inflows have diminished. The negative carry of the CHF will make holding the franc a difficult position to justify. The CHF remains the most overvalued G10 currency regardless of what model you chose indicated that further depreciation is likely. In addition, the SNB stand ready to either support further weakness by actually intervention or just spread rumors of activity. We have received countless questions this week inquiring if the SNB was in the markets (we dont think so but only site deposits will prove antidotal evidence). With the "normalizations" theme retrenching, global economic cycle expanding and the SNB expected to hold accommodating policy for some time,.
Cryptocurrencies - The Future Of Bitcoin - Buy Fear, Sell Greed
The 1st of August is a key date for Bitcoin. Indeed there is a material risk that the most famous cryptocurrency could be split into two different digital currencies. A new algorithm needs only to be activated and simply validated by a majority of miners, the people who approve transactions, for bitcoin to be broken in half.
The Bitcoin network's transactions is only able to process less than 7 transactions per second, which in this nanosecond algo-trading world, would prevent its expanded use. In order to increase the settlement speed, a new transaction process, must be implemented. If users do not accepted this change, the split will occur. Then there would be then two different bitcoins (names have not been assigned) for which owners would need to choose which one they want.
However, it seems that a small community of Bitcoins users is trying to organize a hard fork from Bitcoin to a new protocol called "Bitcoin Cash". For the time being, it is going to be a minor change. But this change may have deep consequences if other users decide to switch towards this new "altcoin" cryptocurrency.
There may be one thing to take care of there. Indeed, surprises may still happen and the new version can still be successful in the future. Yet in case of a now very likely hard fork scenario - The Bitcoin Cash creation -, the thing to do should be to leave your own bitcoin in a wallet and waiting to see which exchanges support both versions. Investors will anyway own bitcoin on both forks. On the contrary Bitcoin stored at exchanges depend on the fact that the marketplace may not fully support both assets.
Cryptocurrencies The Future Of Bitcoin - Buy Fear, Sell Greed Yet while certainly intriguing, the story is not new. Last year, the cryptocurrency Ethereum had to be split after a hack and it would have been wise to keep its Ether in a wallet. Delaying the decision, would have allowed the holder to choose the ETH version which had been up to almost $400 while the classic version ETC is stalling below $23.
Regarding the market, volatility in all cryptocurrencies have been massive on normal days. Bitcoin fork fears are definitely driving the whole crypto market at the moment. Earlier last week, the bitcoin reached again almost $3000 before bouncing lower. This has consequences as all other coins prices are also suffering at the moment. This may be a good moment to stack a few more altcoins.
Bitcoin's future looks definitely unclear at the moment and despite its innovative technology, the oldest cryptocurrency does not compete anymore with newcomers (altcoins). Bitcoin's first mover quality provides it with a strategic advantage for potential massive usage. However, in this new virtual reality it is not always the best technology that wins, it is the best experience.
Economics - USD In The Doldrums. Will It Last?
Dovish statement
Last week was another week to forget for the greenback as the USD extended losses against most of its peers amid dovish FOMC statement and lacklustre economic data. As broadly expected, FOMC members decided to leave monetary policy unchanged, maintaining the target range for the federal funds rate to 1% to 1.25% and not providing a clear timing about its balance sheet reduction plan. Little changes were made to the statement compared to the June version. The Federal Reserve acknowledged that inflation measures have declined and are now running below the 2% target. However minor - but meaningful - changes were made regarding the expected starting date of the balance sheet normalization program. The June statement says the Fed expects the program to be launched this year, while in the latest version it writes it should be implemented "relatively soon".
From our standpoint, we think this is definitely a dovish change as it removes clarity regarding the timing, giving more room to the Fed regarding the starting date of the balance sheet run off. Given the recent disappointing economic data, the Fed wants the greatest flexibility possible should this negative trend persist.
Lacklustre data
The latest batch of data were rather disappointing and were of bad omen for the future. Durable goods orders printed well above median forecast suggesting a solid recovery in June after two months of contraction. The headline gauge increased 6.5%m/m versus 3.9% expected and an upwardly revised figure of -0.1% in May. The upside surprise was essentially due to a sharp bounce in new orders for aircraft, thanks to the Paris Air Show (23-25 June). Excluding the volatile transportation components, core durable goods orders came in below estimates, printing at 0.2%m/m versus 0.4% expected and 0.6% previous reading.
Overall, the report suggests that the manufacturing activity continues to expand at a moderate pace, while the anaemic demand for consumer goods such as vehicles and electronic products signals households' consumption is not ready to take of yet, which is of bad omen for inflation.
On the growth side, second quarter GDP figures failed to impress. According to preliminary estimates, the US economy grew 2.6%q/q annualised in Q2 versus 2.7% expected. First quarter figures was downwardly revised to 1.2% from 1.4%. Finally, the core PCE gauge surprised slightly to the upside, printing at 0.9%q/q annualised versus 0.7% expected. However, previous quarter reading was downwardly revised to 1.8% from 2.0%. Let's just call it square then.
Investors have a real need to see some solid and uninterrupted flow of encouraging data from the US. This only under these conditions that we'll see a bounce back of the US dollar and the pursuit of recovery in US yields. On a side note, we think the USD sell-off is complete and that further weakness is unlikely. Investors will be eager to jump back in long USD position as soon as data improves slightly.
Themes Trading - Video Game Industry
Much ground has been covered since the first video game consoles of the early 70s, which offered only 2D games in black and white and with no sound. Since then, the video game industry has been growing exponentially as computer technology has advanced. Nowadays, blockbuster video games enjoy massive budgets, easily surpassing those of Hollywood movies: budgets in excess of $100 million are not uncommon. According to the ESAF, computer and video game sales in the US alone reached $15.4 billion in 2014, more than double the 2007 figure of $7.3 billion. However, the fastest growth is coming from social network gaming, mobile apps and online gaming, which represent more than 65% of the total revenue.
The video game industry is evolving faster than any other, constantly adapting to the latest technological breakthrough. The industry has already embarked on its latest mutation. However, it's not too late to be a part of it. We built this theme with the aim of offering exposure to the whole video game market, from traditional physical media distribution and console builders to new market entrants. We have overweighted the fast-growing part of the industry, meaning companies active in digital distribution, mobile app development and online gaming-related companies.
Elliott Wave Analysis: NZDUSD In A Temporary Correction
NZDUSD can be making a three wave correction within wave 4), which means more slow and overlapping price activity may follow on the pair. As we can see wave A looks already completed, which means only waves B and C are missing. Ideally once the following wave B unfolds, a new drop into wave C may follow with a potential projection zone near the former wave 4 near the 0.7404 level. From there a new bullish recovery may come in play.
NZDUSD, 1H
Week Ahead – All Eyes on NFP after Dovish FOMC; RBA and BoE to Hold Rates
Key data out of the United States next week may provide the struggling dollar some boost after the Fed struck a less hawkish tone at the July policy meeting. The latest non-farm payrolls numbers will be the most keenly watched indicators of the week but central bank meetings in Australia and the UK will also be in focus. In other data, the preliminary flash GDP estimates for the Eurozone will be eyed too.
RBA meets as aussie soars above $0.80
The Reserve Bank of Australia's Governor, Philip Lowe, has made it clear he isn't too happy about the recent upsurge of the Australian dollar, which hit a more than two-year high of $0.8065 this week. He has also said he is "very comfortable" with the current low interest rate policy. This hasn't stopped traders however from increasing their long positions on the aussie as risk sentiment rebounds and commodities rally. The RBA is expected to hold rates at 1.5% on Tuesday but may decide to use stronger language to warn against further appreciation of the currency. It's latest quarterly monetary policy statement, which assesses economic conditions and the outlook, will follow on Friday.
In terms of data, there are several major data releases for June which should also be watched. These are building approvals on Wednesday, trade figures on Thursday and retail sales on Friday.
Across the pond in New Zealand, second quarter jobs data on Wednesday may go some way in making up for the softer-than-expected inflation figures for the same period, giving the kiwi an extra helping hand.
Looking at other Asian markets, Japan will publish preliminary industrial output numbers for June on Monday, while over in China, PMI data will be in focus. The official manufacturing and non-manufacturing PMIs are due on Monday, followed by the Caixin manufacturing and services PMIs on Tuesday and Thursday respectively.
Eurozone to see flash estimates for inflation and GDP
Second quarter annual growth in the euro area likely accelerated to the fastest since the final quarter of 2015, data out on Tuesday is expected to show. Quarter-on-quarter growth is forecast at 0.6%, unchanged from the prior quarter, while the year-on-year rate is expected to edge up to 2.1% in the flash preliminary reading. Flash estimates of inflation are due one day earlier on Monday. Annual CPI is forecast to remain unchanged at 1.3% in July but excluding food and energy prices, the index is expected to ease slightly to 1.1%.
Other Eurozone data includes the unemployment rate on Monday, retail sales on Thursday and German industrial orders on Friday, all for June, as well as the final July PMI readings on Tuesday and Thursday. The data is unlikely to alter much the existing outlook of the European Central Bank on growth and inflation, while the euro could find fresh momentum to challenge its recent 2½-week high of $1.1776.
Bank of England under spotlight amid split MPC
The Bank of England meets for a two-day policy meeting on Wednesday and Thursday, with the August meeting being particularly significant for a number of reasons. Next week's meeting will mark one year since the Bank announced its 'Brexit bazooka' by cutting rates and extending its asset purchases in response to the shock vote by British voters to leave the EU. One year on, the UK economy has proved more resilient than policymakers anticipated and inflation has jumped to just under 3% from around 0.5% as the pound has plummeted in the forex markets. With several monetary policy committee (MPC) members becoming uneasy about the inflation overshoot, three members voted for a rate hike at the June meeting. The surprisingly tight vote was followed by hawkish remarks from several MPC members. However, one of the hawks, Kristin Forbes, has now left the Bank and replaced by Silvana Tenreyro, who is thought to be more on the dovish side. In addition, the MPC will return to its full 9-member board in September, when the newly appointed Dave Ramsden joins the Bank, who also is thought to be more of a dove than a hawk.
Any further signs on Thursday that the MPC is tilting towards a hawkish stance even as it keeps rates unchanged at 0.25% could lead to fresh gains for sterling. Just as important though will be the BoE's quarterly inflation report which should reveal the Bank's latest forecasts on growth and inflation. Given the notable slowdown in UK growth in the first half of the year, it will be interesting to see how confident the Bank is about the growth prospect in the second half and whether a rate hike is warranted.
Ahead of Super Thursday, UK PMI figures will come into focus. The Markit/CIPS manufacturing PMI is out on Tuesday and will be followed by the corresponding construction and services PMIs on Wednesday and Thursday, respectively.
Barrage of US data awaited
The Fed pleased financial markets this week when it signalled it is worried about the recent weakness in inflation, as this means the central bank will follow a less aggressive rate hike path. However, it would only take a couple of strong data to undo that sentiment and there will be plenty of opportunities for that next week. First up on Monday are the Chicago PMI for July and pending home sales for June.
Tuesday's data will be more crucial with the release of the personal consumption and income figures. Personal income and spending are forecast to remain unchanged at 0.4% and 0.1% month-on-month in June. The core PCE price index - the Fed's preferred measure of inflation - is released alongside these data and is expected to rise by 0.1% m/m in June. The index had fallen to 1.4% in May, raising doubts about the Fed's plans to raise rates one more time this year.
However, despite inflation not picking up as expected, growth has started to quicken and survey readings such as the ISM PMIs have been improving recently. The ISM manufacturing PMI for July is out on Tuesday and the ISM's non-manufacturing PMI is due on Thursday. June factory orders are also released on Thursday and trade numbers are out the next day. The big headline grabber though will be July's jobs report on Friday. Non-farm payrolls are forecast to increase by a more moderate 187k in July after a robust 222k gain in June. The unemployment rate will likely dip back to 4.3% from 4.4% and earnings growth should accelerate slightly from 0.2% to 0.3% m/m in June. A stronger reading would be positive for the greenback as it would keep the door open for further tightening by the Fed before the year end.
Another country reporting its jobs report next week is Canada. Employment data for July on Friday, along with the June trade balance and the Ivey PMI for July should give some indication as to the likelihood of another rate increase by the Bank of Canada this year.
US Q2 GDP Expands as Expected But Dollar Plummets
The dollar extended yesterday's losses on Friday after the US GDP growth initial estimates for the second quarter of the year came in as expected but employment costs and the first look on quarterly inflation based on the PCE measure disappointed analysts.
According to the Bureau of Economic Analysis, the US economy expanded substantially as expected by 2.6% on an annualized basis in the June quarter, approaching Trump's desired growth target of 3% for 2017. The figure for the first three months of the year was revised down from 1.4% to 1.2%. The upbeat increase was attributed mainly to a 2.8% rise in consumer spending which diverged significantly from the 1.9% observed in the first quarter, while business investment also contributed positively, with business spending on equipment recording its biggest improvement since 2015 (8.2%).
However, what disappointed traders was the GDP price index reading. The index, which is a broader measure of inflation, dropped sharply to 1% quarter-on-quarter from 2% (upwardly revised from 1.9%), missing the forecast of 1.3% and reaching the weakest growth in a year.
Moreover, the employment cost index, which gauges the change in wage growth, also fell short of expectations. The index rose by 0.5%, far below the 0.8% seen in the March quarter and the 0.6% anticipated. US wages dropped by 0.7% from 0.6% in the first quarter.
Despite the initial estimates of US economic growth being encouraging, wage growth remains weak even though the economy is operating under full employment conditions, a fact that could potentially restrict consumption in the coming quarters. In addition, inflation does not show any signs of approaching the Fed's target of 2%, justifying the Fed's concerns about prices trending below the target for a longer period than anticipated.
Looking at the forex markets, the dollar continued its downward path against its major rivals despite the upbeat GDP growth. The dollar index sank by 0.32% immediately after the data, touching an intra-day low of 93.20. Dollar/yen declined by 0.38% from 111.26 to 110.91, while euro/dollar jumped by 0.20%, from 1.1720 to 1.1743.
RBA to Keep Rates on Hold; Retain Upbeat Growth Forecasts
Week beginning 31 July 2017
- RBA to keep rates on hold; retain upbeat growth forecasts.
- RBA: policy announcement, Statement on Monetary Policy.
- Australia: retail trade, dwelling approvals, trade balance, credit.
- China: Official & Caixin PMIs.
- NZ: employment.
- UK: BOE policy decision.
- Euro Area: CPI, employment.
- US: nonfarm payrolls, PCE inflation & personal spending.
- Key economic & financial forecasts.
Information contained in this report was current as at 28 July 2017.
RBA to keep rates on hold; retain upbeat growth forecasts
The Reserve Bank Board next meets on August 1.
Of course, the Board will keep rates on hold as clearly signalled by important speeches from both the Governor and Deputy Governor over the last week.
Therefore the interest directly associated with the Board meeting will be with the Governor's associated Statement. No doubt the Governor will continue to "call out" the labour market and the housing markets as the key areas of interest. In that regard the sentiment in the July Board Minutes and the Governor's July Statement is likely to be repeated.
On housing, "Conditions varied considerably across the country. Housing prices have been rising briskly in some markets, although there are some signs that these conditions are starting to ease ...."
On the labour market, the commentary is likely to be along the lines of the Minutes, "Labour market conditions had improved ... forward indicators had remained positive.......The strength of recent labour market data had removed some of the downside risk to the Bank's forecast of wage growth."
However on that latter point the Governor's speech on July 26 indicated that there was limited confidence in the call that wage rates would gradually increase over the course of the forecast period.
And then, of course, there is the Australian dollar. Since the last Board meeting the AUD has increased from USD 0.76 and a TWI of 65 to USD 0.795 and TWI of 67.
Even at USD0.76 the Governor repeated his consistent call that "an appreciating exchange rate would complicate this adjustment." The language is likely to strengthen at USD 0.795. In his speech on July 21 the Deputy Governor noted: "a lower AUD would be helpful."
In mid-2015, when the AUD was adjusting, the "path" from USD 0.80 to USD 0.75 was consistently associated with: "Further depreciation is likely/necessary."
It seems likely that the "commentary" on the AUD in the Governor's Statement will be stronger than we have seen recently but we cannot be sure that a new "terminology" will be adopted.
Be clear that even though the move in the AUD is associated with higher commodity prices, the RBA is uncomfortable. The clear offset to services; manufacturing; and agricultural exports that we might expect from higher commodity prices is not materialising. Cashed up mining companies are not reinvesting and are not lifting employment in this cycle largely because they are not convinced of the sustainability of the current increases. As such the higher AUD is a "challenge" for both growth and inflation.
In that regard the second RBA report for the week will be more significant. The Statement on Monetary Policy will be released on August 4 and will contain the Bank's revised growth and inflation forecasts.
These forecasts will be provided out to end calendar 2019, extending from June 2019 currently.
Recall the convention for the assumptions behind the forecasts. The rate profile is that indicated by market pricing and the AUD profile assumes the current level of the AUD.
When the last forecasts were released in May the rate outlook was flat while the AUD was at USD 0.74 and TWI 64.
Today markets are pricing in a 0.25% rate hike by the second half of 2018 while the AUD is likely to be assessed at USD0.80 or TWI 67.
The issue is whether the Bank will change its forecasts on the basis of the new "assumptions".
The key forecasts from a policy perspective are GDP growth in 2018 and underlying inflation in 2018 and 2019.
In May, GDP growth in December 2018 was forecast at 2.75%- 3.75% and underlying inflation at 1.5-2.5% in 2018 and 2-3% in June 2019.
We are not aware of the Bank's specific modelling methodology and of course any potential "subjective" adjustments that might be applied to the modelling before the final results are released.
However we can assess some historical "form".
In November 2016, when AUD was at USD 0.77 and the TWI at 65, growth in 2018 was forecast at 3-4% and underlying inflation at 1.5-2.5%.
In May 2017, when AUD was at USD 0.74 and the TWI at 64, growth in 2018 was forecast at 2.75%-3.75% and underlying inflation at 1.5-2.5%.
You can see that between November and May there was a US 3 cents move in the AUD yet no significant changes were made in the forecasts. In fact a lower AUD was associated with a modest downward revision in the growth rate.
Elsewhere, the positive global back drop, with upgrades to world growth, and domestically the surprisingly strong employment figures, buoyant business confidence surveys and expansionary public investment would have boosted the Bank's confidence in their above trend growth forecast for 2018 (with trend growth estimated at 2.75%). Those developments would support the Bank's inclinations to keep their growth forecasts intact.
For 2019, consistent with the above, the RBA is likely to restate their 3.25% growth forecast for June 2019 and to also forecast 3.25% for December 2019, which rolls into the forecast horizon.
Certainly there seems little chance that the Bank would react to the AUD developments by lowering its underlying inflation forecast for 2018 which already sits at the bottom of the 2-3% target band.
No doubt there will be considerable angst at the Bank around the growth forecast.
For me, rigid adherence to the assumption of an AUD holding at USD0.80 over the next 3 years with a resulting change to the confident "above trend" growth story in 2018 would be an unattractive option for the Bank.
Consequently, despite the sharp short term move in the AUD, I expect the RBA to retain its "above trend" growth forecast when it releases its forecasts in the Statement on Monetary Policy on August 4.
Bill Evans, Chief Economist
Data wrap
Q2 CPI
- Headline CPI 0.2%qtr/1.9%yr. Trimmed mean 0.51%qtr/1.8%y. Weighted median 0.55qtr/1.8%yr
- The Q2 CPI printed 0.2% compared to Westpac's forecast for 0.6%. The market median was 0.5%. The annual rate is now 1.9%yr compare to 2.1% in Q1, 1.5%yr in Q4, 1.3%yr in Q3 and 1.0%yr in Q2. The June quarter 2016 was the slowest pace since Q2 1999.
- The core measures, which are seasonally adjusted and exclude extreme moves, rose as expected at 0.5%qtr. In the quarter, the trimmed mean gained 0.51% while the weighted median lifted 0.55%, highlighting just how modest the broader inflation picture is outside of housing or health. The annual pace of the average of the core measures is now 1.8%yr flat on 1.8%yr in Q1, and up on 1.5%yr in Q4 and Q3.
- With the headline measure printing below market expectations (0.2% compared to 0.5%) why did the core measure rise as expected (0.5%)? It is all due to rent and dwelling purchases, which have a large weight and tend not to get trimmed out of the core measures. We argue that housing costs are important to factor in.
- The biggest surprise in the June quarter was the fall in fresh fruit & vegetable prices. The ABS does report something of cyclone Debbie boost in some fresh fruit and vegetables but this was offset by a seasonal fall in the price of winter fruits. This added to the known drag coming from falling auto fuel even if the fall in the quarter was not as large as we had anticipated.
- However, the more significant observation was the lack of price pressure in some major retail sectors and in particular, clothing & footwear. Normally clothing & footwear prices rise in the June quarter post the New Year sales in Q1 as prices are reset before the post June 30 sales in Q3. In the June quarter 2017, clothing & footwear fell 0.3%.
- Overall the June quarter CPI again highlighted the lack of any broad inflationary pressures in the Australian economy. While core inflation has drifted up to just under the bottom of the RBA's target band, on the back on a lift in housing cost, it is hard to see how it can accelerate much further without broader price gains.
- There is some interest in the preliminary estimates for Q3 given the known significant increase in electricity bills. Our preliminary estimate is for a 0.8%qtr rise in the headline CPI and 0.3%qtr rise in the average of the core measures. This will hold the annual pace of the average of the core measures at 1.8%yr.
Q2 trade prices
- Australia's terms of trade dipped in the June quarter 2017, representing a break from the recent rebound.
- Export prices for goods fell by 5.7% in the quarter, meeting expectations (market median -5.5% and Westpac -5.5%).
- Prior to this, in the year to March, export prices rebounded by almost 32%, up from the lows of early 2016. Annual growth has now moderated to 22.5%.
- Commodity prices eased back in the June quarter (on a quarter average basis), -10.6%. The falls were led by iron ore, impacted by rising inventories in China, and by coal.
- Import prices were little changed in the quarter, inching 0.1% lower, and also little changed relative to a year ago, edging 0.3% higher. The June result was softer than anticipated (market median 0.7% and Westpac 0.7%).
- The Australian dollar weakened in the June quarter, declining by 1% against the US dollar to 75.8¢ and falling by 2.2% on a TWI basis, to 64.5.
- While the lower dollar tends to make imports more expensive this was offset by falling global energy prices and general softness in world trade prices in the period.
- The terms of trade for goods rebounded sharply in the year to March 2017, up 30%. There was a partial reversal in the June quarter, down 5.6%, trimming annual growth to 19.3%.
- The rebound in commodity prices and the terms of trade during 2016 and into early 2017 boosted national income. Company profits, particularly in mining, jumped sharply. However there has been limited pass-through to households with wages growth still weak. The terms of trade pull-back in June 2017 will dent national income and company profits.
- Going forward, particularly during 2018, we expect commodity prices to trend lower, moving towards cost curves on softer demand and rising supply. However, in recent weeks, prices have been resilient, with spot iron ore up from US$55/t to US$70/t.
New Zealand: week ahead & data wrap
Old school
Next week's labour market figures are expected to show that firms are still keen to hire, but that the unemployment rate has remained steady at 4.9%. Financial markets are probably more vulnerable to a softer than expected outcome, given the number of factors that already point to the Reserve Bank keeping interest rates on hold for a long time.
We expect the Household Labour Force Survey (HLFS) to show a 0.7% rise in employment over the June quarter. We also expect a similar result from the employer-focused Quarterly Employment Survey (QES), with a 0.9% rise in the number of full-time equivalent employees.
Growth in employment is expected to be widespread, with larger gains in service sectors (including hospitality), retail and professional services. We also expect continued employment gains in the construction sector, though difficulties in sourcing skilled labour may provide some brake on jobs growth on this front.
However, while the demand for workers is growing, the active labour force is also growing at a strong clip. The strong rise in population growth in recent years, led by trends in net migration, has been strongly motivated by job prospects. New arrivals have risen sharply, particularly for those coming on temporary work visas. At the same time, more New Zealanders are returning from Australia and fewer are leaving in the first place, which reflects the relatively subdued Australian jobs market in recent years.
As a result, we expect the unemployment rate to remain unchanged at 4.9%. That's a marked improvement on the postfinancial crisis peak of 6.7%, but it's not particularly low compared to history. The unemployment rate was consistently below 5% from 2003 to 2008, and it wasn't until unemployment fell below 4% that the labour market tightened and wage growth really ramped up.
Consequently, with unemployment lingering around 5% now, we've yet to see a broad-based lift in wage growth in the current cycle - in fact, the Labour Cost Index for the private sector rose just 1.5% in the year to March, its slowest pace in seven years. While there are pockets such as the construction sector where a shortage of skilled workers is increasingly acting as a constraint, it doesn't appear that the labour market as a whole has been in 'tight' territory up to now.
The idea of what constitutes 'tight' or 'loose' economic conditions was addressed in a speech this week by the Reserve Bank's Head of Economics. The broad theme of the speech was that monetary policy decisions depend in part on judging where the economy stands relative to its long-run equilibrium settings, which are unobservable and can change over time.
One of those unobservable factors is potential output - the level of GDP that leaves inflation neither rising nor falling. Potential output is highly uncertain, and the RBNZ uses several estimation methods that produce a range of results. But the RBNZ's central estimate suggests that the New Zealand economy has been running at around its potential for the last two years, having been below potential for several years after the financial crisis. In other words, it has not been in 'tight' territory - implying an acceleration in inflation - at any point in the last several years.
Another key unobservable that was covered in the speech is the neutral level of the Official Cash Rate (OCR). The RBNZ's estimate of the neutral OCR has come down over time, and the latest estimate puts it at around 3.5%. That implies that the current OCR of 1.75% is providing stimulus to the economy, as is appropriate in the current circumstances.
However, lowering the estimate of the neutral rate implies that the current level of the OCR has not been providing as much stimulus as previously thought - and perhaps should have been set even lower in recent times. Of course, this is with the benefit of hindsight, but it suggests that the best way forward is to keep the OCR low for even longer.
As we've noted before, the RBNZ's projections already imply that OCR hikes are a long way off. Our forecasts are not too dissimilar - we don't expect a hike before 2019. In contrast, market pricing is still consistent with an OCR hike by August next year, and has at times implied an even earlier start to rate hikes.
We think that developments since the last OCR review will give the RBNZ even less reason to contemplate the idea of rate hikes. June quarter inflation was lower than expected, and some temporary factors are likely to keep inflation below the 2% target midpoint for at least another year. In addition, the housing market is slowing much faster than the RBNZ assumed, which is likely to have knock-on effects for the strength of domestic demand.
Finally, the New Zealand dollar has strengthened significantly in recent weeks. This is largely a product of US dollar weakness and may prove to be transitory. But if sustained, it will further undermine the outlook for inflation over the coming year.
Consequently, we think that financial markets are more vulnerable to a weak outturn in next week's labour market update, which is one of the last key pieces of economic information ahead of the RBNZ's Monetary Policy Statement on 10 August. Even a stronger than expected result is unlikely to see the RBNZ contemplate an OCR hike within the next year, whereas a weak result would see markets push out the expected timing of rate hikes.
Data previews
Aus Jun private credit
Jul 31, Last: 0.4%, WBC f/c: 0.4%
Mkt f/c: 0.4%, Range: 0.3% to 0.5%
- Private credit grew by 5.0% in the year to May, moderating from 6.4% a year earlier. Housing has slowed a little over this period, to 6.6% from 6.9%, as lending conditions have tightened. Business credit has moderated, to 3.1% from 7.0%, in part due to weakness around the time of the 2016 Federal election, as well as a soft start to 2017.
- For June, credit growth is expected to be 0.4%, matching the outcomes for the three months March through May.
- Housing credit grew by 0.55% in May, reversing a dip to 0.51% in April. The are tentative signs that the housing sector is beginning to cool, including a 1.5% decline in the total value of housing finance in the four months since January.
- Business credit grew by 0.4% in April and by 0.2% in May, representing a modest improvement on a 0.4% decline in Q1. Commercial finance, while still volatile, is up off its lows.
Aus RBA policy decision
Aug 1, Last: 1.50%, WBC f/c: 1.50%
Mkt f/c: 1.50%, Range: 1.50% to 1.50%
- The RBA will leave rates unchanged at its Aug meeting.
- Following two 25bp cuts in May and August 2016, the Bank has kept policy firmly on hold. Minutes to the July meeting reaffirmed labour and housing markets as particular areas of interest - key questions around both remain unresolved.
- A discussion of 'neutral' rates in the 'Considerations for Policy' section of the July minutes was seen by some as a more hawkish signal, contributing to a firming in the AUD.
- The RBA Governor has publicly rejected this view, reinforcing the Bank's 'firmly on hold' stance. Despite this the AUD has continue to rise. How this is treated in the Governor's decision statement and its forecasts in the Aug Statement on Monetary Policy (due Friday) will be of interest (see p2 for full discussion).
Aus Jun dwelling approvals
Aug 2, Last: -5.6%, WBC f/c: 1.0%
Mkt f/c: 1.0%, Range: -4.0% to 5.0%
- Dwelling approvals slumped 5.6% in May to be down 19.7%yr. The decline over both the month and the year has mainly been driven by 'high rise' (-20%mth, -45%yr). Nationally, May saw the second lowest monthly reading on high rise approvals since June 2013 - the lowest being the weatheraffected read in March.
- Despite the weak May update, June is shaping a little more positively. In particular construction-related finance approvals continue to suggest some firming in non-high rise activity in coming months. Meanwhile high rise approvals should start to stabilise around current lower levels although the outlook for this volatile segment is more uncertain. On balance we expect monthly total approvals to show a slight 1% gain leaving the existing strong downtrend intact.
Aus Jun trade balance, AUDbn
Aug 3, Last: 2.5, WBC f/c: 1.4
Mkt f/c: 1.8, Range: 1.2 to 3.0
- Australia's trade balance was comfortably in surplus in May, after being impacted by Cyclone Debbie in April.
- For June, we expect a $1.4bn surplus, narrowing from a $2.5bn surplus in May.
- Export earnings are forecast to decline by 4%, -$1.3bn. Metal ores, coal and fuels, together accounting for close to 50% of exports, are expected to weaken, down $1.4bn. Prices fell (iron ore and fuels), so too volumes (iron ore, coal and LNG).
- Imports are forecast to decline by 0.7%, $0.2bn, on lower prices, with oil down and the Australian dollar stronger.
- Note: since January 2016, there is additional uncertainty around the import and trade forecast. The ABS no longer publishes customs goods imports ahead of the trade release.
Aus Jun retail trade
Aug 4, Last: 0.6%, WBC f/c: flat
Mkt f/c: 0.2%, Range: -0.2% to 0.8%
- Retail sales came in better than expected for April with a 0.6% gain following on from April's 1% bounce-back from a weather-affected 0.1% contraction in March. The April detail suggested a genuine lift in momentum over and above weather-related volume and price impacts.
- Despite the lift, the backdrop in terms of consumer sentiment remains shaky with signs family finances came under renewed pressure over the first half of 2017 with mortgage rate increases in March and continued concerns around housing markets. That said, labour market conditions have improved. The Q2 CPI also suggests retail prices have been flat with continued aggressive discounting in non-food segments. On balance we expect June to post a flat result for monthly sales.
Aus Q2 real retail sales
Aug 4, Last: 0.1%, WBC f/c: 1.1%
Mkt f/c: 1.2%, Range: 0.6% to 1.5%
- Real retail sales rose just 0.1% in Q1 with weather a key restraining factor - sales in cyclone-affected Qld contracted 1%qtr but rose 0.4%qtr across the rest of Aus.
- The Q2 update is shaping as a strong one. Even with a flat monthly finish, nominal sales are on track for a 1.3% rise over the quarter. The CPI detail also points to a subdued retail deflator - up about 0.2% despite a weather-related jump in some food prices. The combination gives a 1.1% rise in real retail sales, with some upside risk if the deflator comes in weaker. Note that the retail measure remains a problematic indicator for the broader spending estimates in the national accounts - although the direction for Q2 looks right, the swings in total spending are likely to be much milder than the retail moves.
NZ June business confidence
Jul 31, Last: 24.8
- Businesses' confidence in the general economic outlook rose strongly in June, with widespread gains.
- Since the June survey, we've seen mixed economic conditions. Spending has held up, boosted by the current strong tourist season. But at the same time, housing market conditions have continued to weaken (especially in Auckland). There is also some uncertainty around how September's election will affect economic conditions.
- We'll be watching the survey's inflation and price gauges closely. Despite relatively firm economic growth in recent years, we're yet to see a broad based increase in pricing pressures. We don't expect much change on this front just yet.
NZ June building consents
Jul 31, Last: 7.0%, WBC f/c: -5.0%
- Residential building consents rose 7% in May. That followed a 7.4% drop in April that looks like it was exacerbated by the timing of the Easter and Anzac Day holidays.
- After the solid May increase, we expect some pull back in consent issuance in June.
- Smoothing through month-to-month volatility, we should continue to see a trend increase in consents over the coming year, with large amounts of building work planned in coming years. However, there are questions around how fast construction will rise going forward. Capacity pressures in the building industry have already emerged, and both building costs and borrowing rates have been creeping higher. At the same time, house price growth has levelled off and reconstruction activity in Canterbury has eased back.
NZ Q2 household labour force survey
Aug 2, Employment, last: 1.2%, WBC f/c: 0.7%, Mkt f/c: +0.7%
Aug 2, Unemployment, last: 4.9%, WBC: 4.9%, Mkt f/c: 4.8%
- We expect the Household Labour Force Survey will show that employment levels increased by 0.7% in the June quarter. Increases in employment are expected to be widespread, with larger gains in service sectors (including hospitality), retail and professional services. We also expect continued employment gains in the construction sector, though difficulties sourcing skilled labour may slow jobs growth on this front.
- Labour force participation is expected to nudge higher again in June, taking it to a fresh record high of 70.7%. Jobs growth has encouraged more people to enter the labour market. This has been reinforced by strong net migration. These factors are providing a floor under the unemployment rate, which we expect to remain unchanged at 4.9%
NZ Q2 labour cost index
Aug 2, Private sector (incl. overtime), last: 0.4%, WBC f/c: 0.4%, Mkt f/c: 0.4%
- Although the labour market has been strengthening, wage inflation remains low. We're expecting the June quarter Labour Cost Index will show that base wage rates rose by only 1.6% over the past year. Similarly, the broader QES measures of average hourly earnings is expected to have risen by only 1.3% - both largely unchanged from last quarter and still low.
- But while wage growth is currently low, this won't be the case forever. We expect that strong demand for workers, as well as increasing cost of living adjustments will contribute to rising wage inflation over the coming year.
UK Mar Bank of England policy decision
Aug 3, Last: 0.25%, WBC f/c: 0.25%
- June saw a hawkish tilt from Bank of England. While the Bank Rate was left on hold, three of the eight members voted for an immediate rate hike in June, up from just one in May. Underlying this shift in stance was earlier firmness in economic activity that raised questions about how much of the recent pick-up in inflation should be looked through.
- Rate hikes are only a realistic possibility if there are convincing signs of resilience in economic activity. However, since the June meeting, inflation has softened and GDP growth has been subdued. We expect that these developments will see renewed caution among the MPC, with the Bank Rate and asset purchase program expected to remain unchanged in July.
US Jul employment report
Aug 4, nonfarm payrolls Last: 222k, WBC 190k
Aug 4, unemployment report Last: 4.4%, WBC 4.4%
- It has been an interesting six months for employment growth in the US, nonfarm payrolls reporting month-average growth of 224k in Jan/Feb; a weak 50k in Mar; then 207k in Apr; 152k in May; and 222k in June. The net result is a month-average pace of 180k, broadly in line with 2016.
- At this stage in the economic cycle, given full employment has been reached, employment growth should have slowed. But it hasn't and partial indicators remains supportive of further strong gains. In Jul, we look for a 190k rise.
- Since January, the unemployment rate has consequently fallen from 4.8% to 4.4% in June. Participation has also been a factor, edging 0.2ppts lower to 62.8%. In Jul, we expect the unemployment rate to remain unchanged, with any surprise in employment to be offset by participation.