Sample Category Title
USDCHF – Rallies Strongly, Reverses Losses
USDCHF - With the pair rallying strongly higher the past week, more weakness is likely. On the downside, support lies at the 0.9650 level. A turn below here will open the door for more weakness towards the 0.9600 level and then the 0.9550 level. On the upside, resistance resides at the 0.9750 level where a break will clear the way for more strength to occur towards the 0.9800 level. Further out, resistance comes in at the 0.9850 level. Threatening further upside pressure. All in all, USDCHF faces further strength on price rally.
EURUSD – Retains Its Upside Pressure With Eyes On 1.1800 Zone
EURUSD - With the pair retaining its upside pressure the past week, more strength is likely in the new week. Resistance comes in at 1.1800 level with a cut through here opening the door for more upside towards the 1.1850 level. Further up, resistance lies at the 1.1900 level where a break will expose the 1.1950 level. Its weekly RSI is bullish and pointing higher suggesting more strength. Conversely, support lies at the 1.1700 level where a violation will aim at the 1.1650 level. A break of here will aim at the 1.1600 level. All in all, EURUSD faces further corrective downside pressure.
AUD/USD At 80c Psychological Round Number Level
We know classic support and resistance forms where price has seen a reaction somewhere in the past, but traders want to look forward for EXPECTED support/resistance. Traders use forward looking support/resistance targets such as pivot points, average daily ranges or even fib extensions to get their fix. However, the most obvious of all is just a simple round number!
With the Aussie Dollar at a key psychological level, I thought it would be a good chance to take a look at why markets react at psychological round numbers. Anything with an 00 on the end grabs attention. It's simple human nature for us to be drawn into round numbers like this.
This is because as humans, we value simplicity. Psychological round numbers work as support/resistance because we think they work. It's a self fulfilling prophecy. Because we think they work, traders will place their stops and limit orders on either side of them, causing price to continue reacting and keeping the cycle of fulfillment alive. When order flow is altered in this way, price is going to react.
As a simple test oh the human psych effect to round numbers, ask someone how much they paid for their lunch today. If it was $4.99, then most likely they will round it up to $5.00 without even thinking.
Take a look at the Aussie Dollar today:
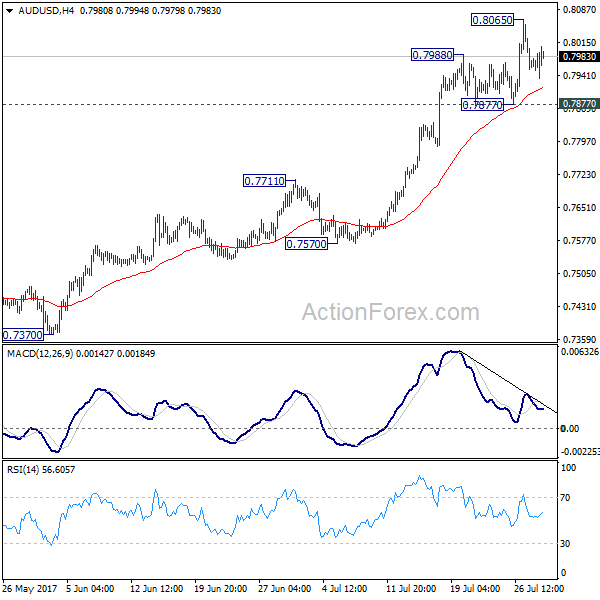
AUD/USD Daily:
The 80c resistance level has been tested, stops were cleared through it, the daily candle closed below the level and price is now heading back down. Yes, the psychological round number level has once again been respected.
Being based in Australia, the Aussie Dollar has added significance for me personally. Every finance section of news reports lead with AUD/USD and the 80c level is ALWAYS mentioned.
'The Aussie Dollar is back below the 80c US mark…'
As you can see on the AUD/USD chart above, it's all just self fulfilling.
I encourage you to watch for round numbers and how price reacts to them. You'll be surprised just how much markets are a reflection of human idiosyncrasies.
Appetite To Sell The Dollar
Appetite to Sell the Dollar
There remains real appetite to sell the USD even after the brash dollar sell off post-FOMC as it's becoming evident to all the Greenback has problems, and the can of worms is barely open.
The Dovish FOMC combined with the US political imbroglio saw little appetite for dollars heading into weeks end. But complicating the narrative this week will be month end flow, Eurozone CPI, GDP and US payrolls this week. However, on Tuesday the key US Price Consumption Expenditures index or PCE figures are released which could provide more transparency into the inflation as transitory narrative.
Inflation concerns remain in the FED spotlight, and with the market split on whether the FOMC may or may not raise interest rates again in 2017, any and all inflation metrics will be in focus. But given the PCE is Fed's preferred inflation gauge, the print could be this week's primary focal point.
Emerging from the Fed blackout traders turn to speeches by the Loretta Mester and John Williams, both scheduled for Thursday night.And while they're expected to toe the plank it's possible they may offer some fresh insight regarding the central bank's balance sheet “ relative soon” timeline
Euro
It's a huge week on the data front, but for USD bulls there's an unpalatable reality that with ECB members sounding increasingly hawkish and their FOMC counterparts ever so dovish anything to confirm this bias will be pounced on by traders.
With that in mind, it's a busy week on the EU economic diary, so a higher than expected Eurozone CPI on Monday and a strong follow up Eurozone GDP on Tuesday could see the single currency push above 1.1800 as the greenback struggles to find buyers on the dovish Fed narrative.
The current Euro strength is as much about broad USD weakness and with the plausibility that positioning is still not stretched, it not only suggests investors buying dips will cushion the downside but that the pair could accelerate much higher on sturdy EU economic data prints.
Japanese Yen
JPY had been enjoying a quiet Friday until the Japanese government reported that North Korea has test fired another missile. Yen immediately picked up the haven appeal and fell through 110.75 support on its way to 110.50
The geopolitical overhang will likely keep top side moves in check early in the week as the disorganised US and China policy towards North Korea is not helping matters
Australian Dollar
The Aussie moves have been nothing short of incredible, but we should be in for well overdue consolidation phase.But the AUDUSD at 80 cents is looking very expensive especially in the wake of Governor Lowe's speech which cut short any domestic rate hike expectation. However, the real play here is the weak USD and more specifically the dovish Fed which has encouraged the carry trade as speculators continue to pile in.
Little change expected on tomorrow's RBA decision given the recent guidance from both Debelle and Lowe. However, the domestic retail sales on Friday should be interesting as given the high level of household indebtedness, which begs the question are retail still spending?
EUR/USD Weekly Outlook
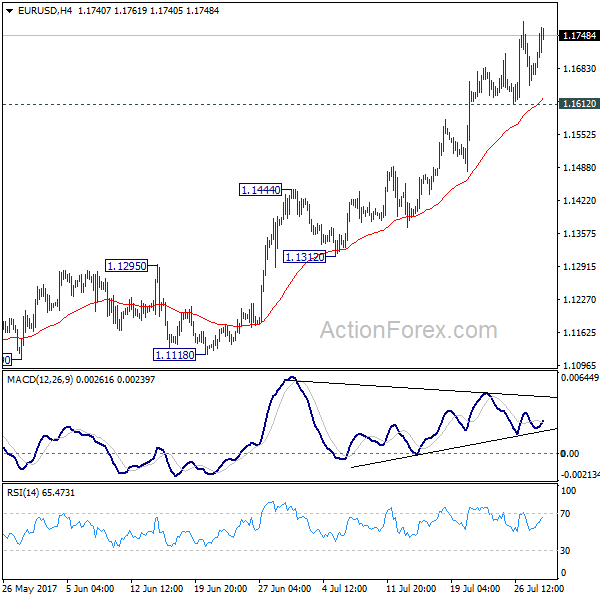
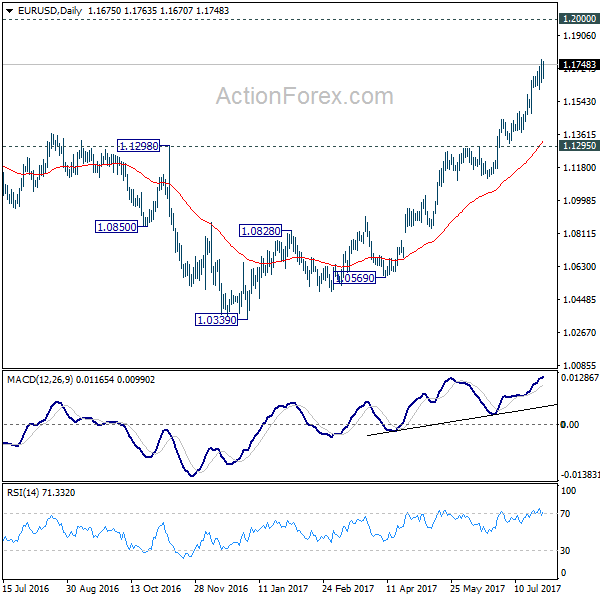
EUR/USD surged further to as high as 1.1776 last week and outlook is unchanged. Whole rise from 1.0339 low is still in progress and should target 1.2 handle next. Nonetheless, considering bearish divergence condition in 4 hour MACD, break of 1.1612 will indicate short term topping and bring lengthier consolidation first.
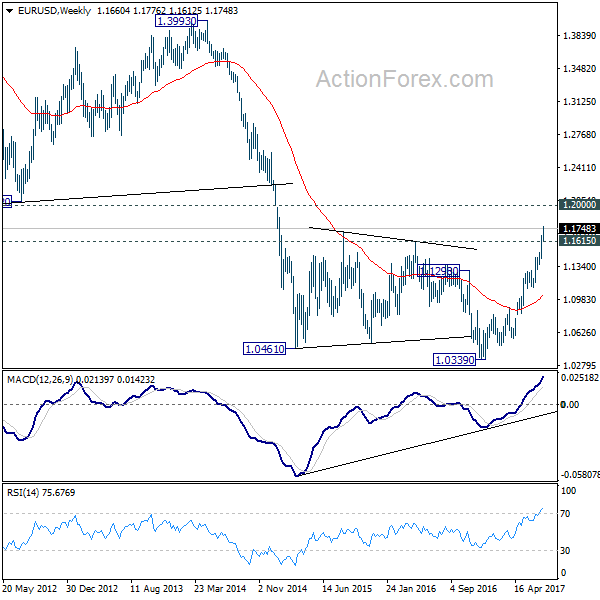
In the bigger picture, an important bottom was formed at 1.0339 on bullish convergence condition in weekly MACD. Sustained break of 55 month EMA (now at 1.1760) will pave the way to key fibonacci level at 38.2% retracement of 1.6039 (2008 high) to 1.0339 (2017 low) at 1.2516. While rise from 1.0339 is strong, there is no confirmation that it's developing into a long term up trend yet. Hence, we'll be cautious on strong resistance from 1.2516 to limit upside. But for now, medium term outlook will remain bullish as long as 1.1295 support holds, in case of pull back.
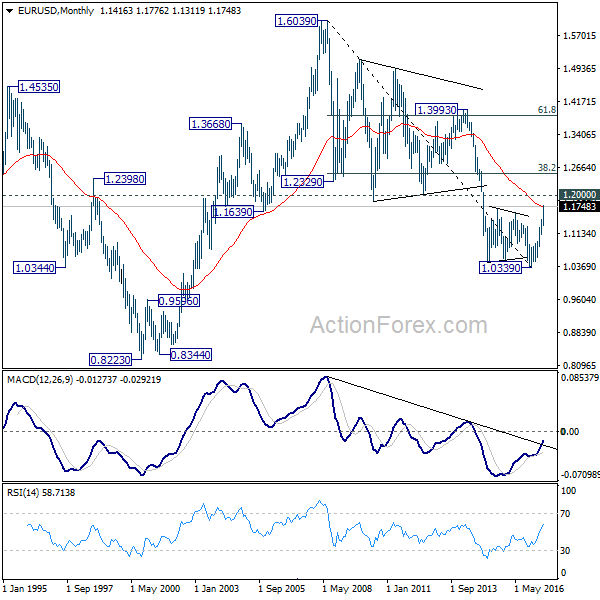
In the long term picture, 1.0339 is now seen as an important bottom as the down trend from 1.6039 (2008 high) could have completed. It's still early to decide whether price action form 1.0339 is developing into a corrective or impulsive move. But in either case, further rally would be seen to 38.2% retracement of 1.6039 to 1.0339 at 1.2516
USD/JPY Weekly Outlook
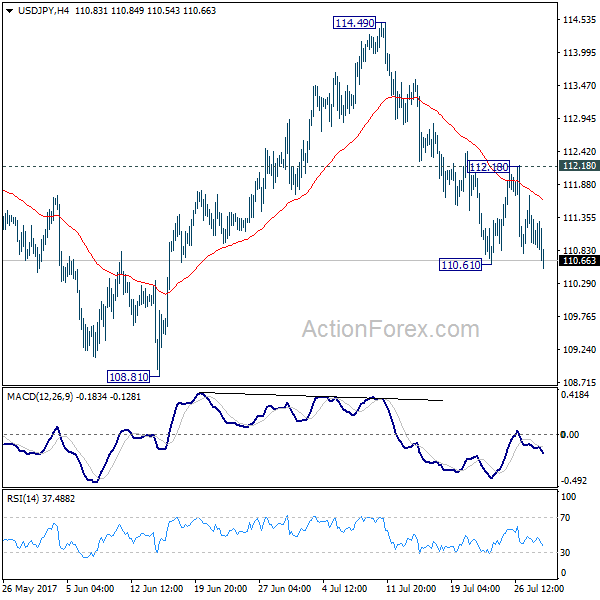
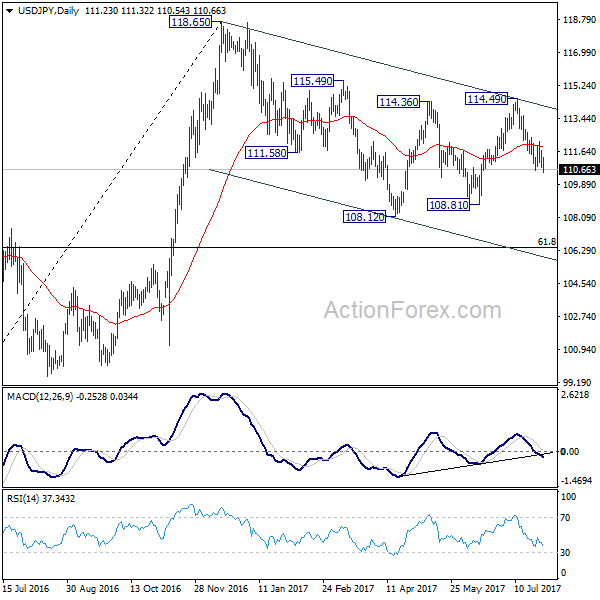
USD/JPY recovered after hitting 110.61 last week and recovered. But such recover was held at 112.1. Subsequent breach of 110.61 suggests that fall from 114.49 is resuming. Initial bias is now on the downside this week for 108.81 support first. Break there will resume whole correction from 118.65 and target 61.8% retracement of 98.97 to 118.65 at 106.48. Nonetheless, break of 112.18 resistance will dampen this bearish view and turn focus back to 114.49 resistance instead.
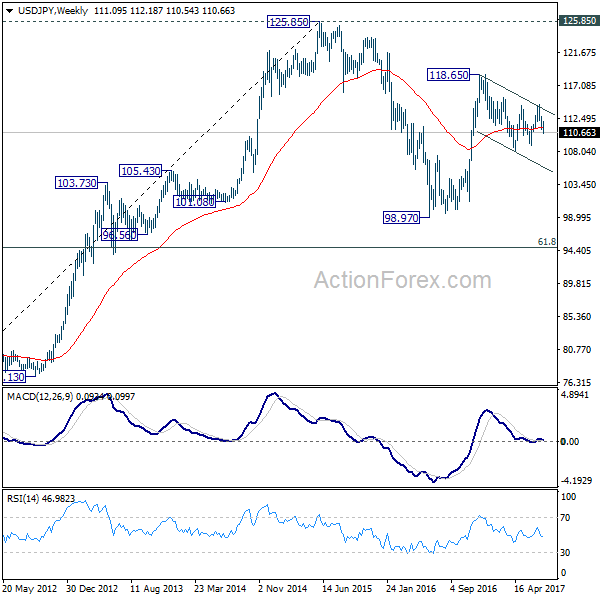
In the bigger picture, the corrective structure of the fall from 118.65 suggests that rise from 98.97 is not completed yet. Break of 118.65 will target a test on 125.85 high. At this point, it's uncertain whether rise from 98.97 is resuming the long term up trend from 75.56, or it's a leg in the consolidation from 125.85. Hence, we'll be cautious on topping as it approaches 125.85. If fall from 118.65 extends lower, down side should be contained by 61.8% retracement of 98.97 to 118.65 at 106.48 and bring rebound.
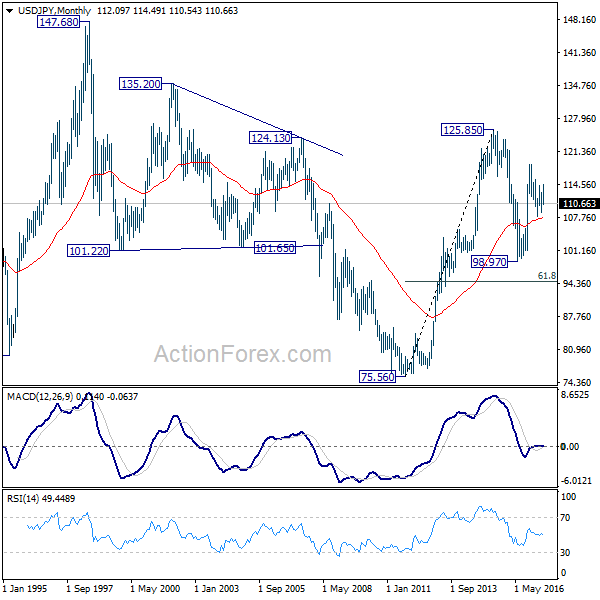
In the long term picture, the rise from 75.56 long term bottom to 125.85 top is viewed as an impulsive move. Price actions from 125.85 are seen as a corrective move which could still extend. But, up trend from 75.56 is expected to resume at a later stage for above 135.20/147.68 resistance zone.
GBP/USD Weekly Outlook
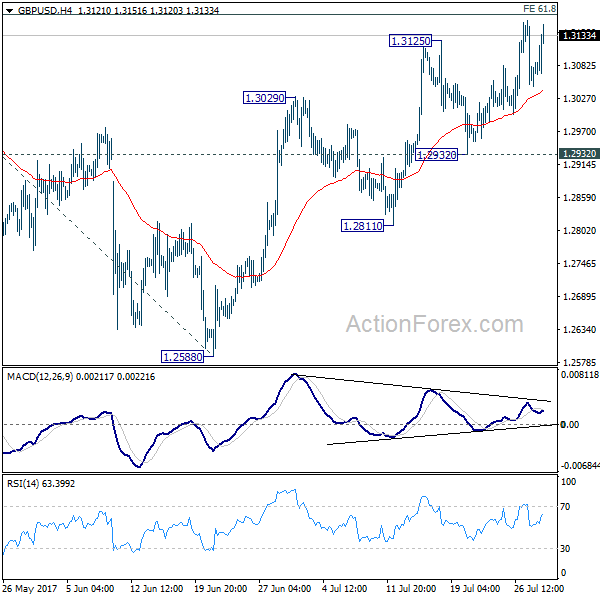
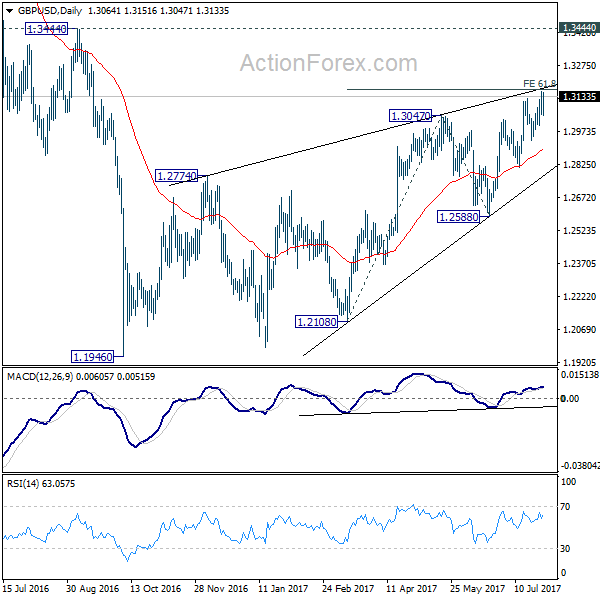
GBP/USD's rally extended last week with weak momentum. Overall outlook is unchanged. Price actions from 1.1946 are seen as a corrective pattern. Considering bearish divergence condition in 4 hour MACD, we'd stay cautious on strong resistance from 61.8% projection of 1.2108 to 1.3047 from 1.2588 at 1.3168 to limit upside. Break of 1.2932 support will be the first sign of reversal and will turn bias to the downside to target 1.2588 key support next. Though, sustained break of 1.3168 will bring further rise towards 1.3444 before completing the correction.
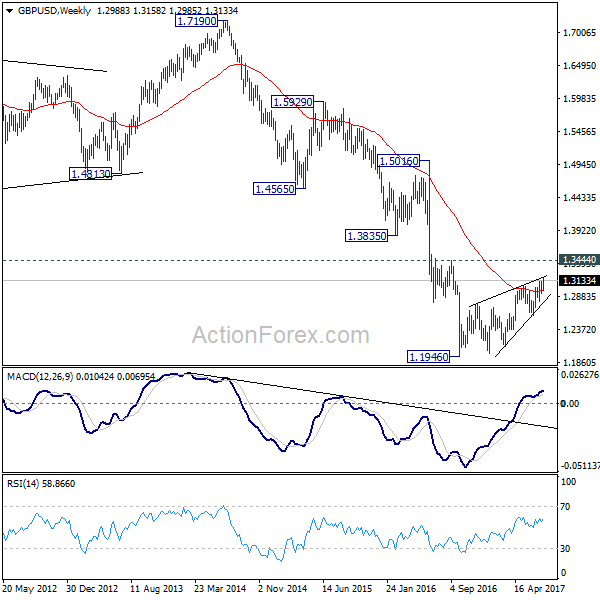
In the bigger picture, overall, price actions from 1.1946 medium term low are seen as a corrective pattern that is still in progress. While further upside is expected, larger outlook remains bearish as long as 1.3444 key resistance holds. Down trend from 1.7190 (2014 high) is expected to resume later after the correction completes. And break of 1.2588 will indicate that such down trend is resuming.
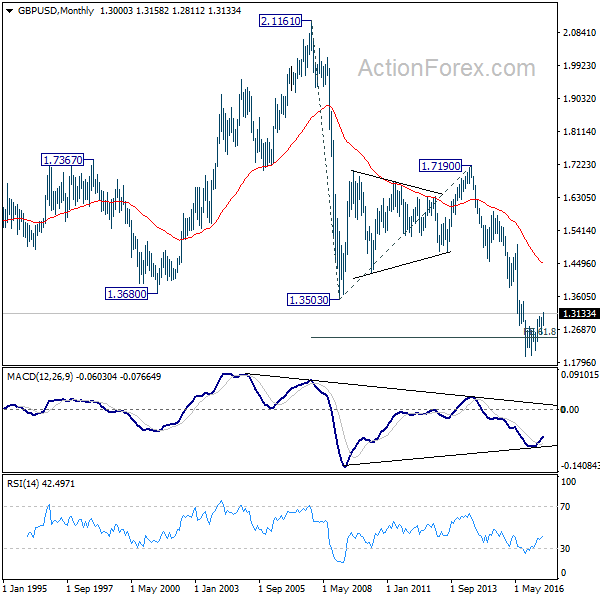
In the longer term picture, no change in the view that down trend from 2.1161 (2007 high) is still in progress. On resumption, such decline would extend deeper to 100% projection of 2.1161 to 1.3503 from 1.7190 at 0.9532. However, firm break of 1.3444 should confirm reversal and turn outlook bullish.
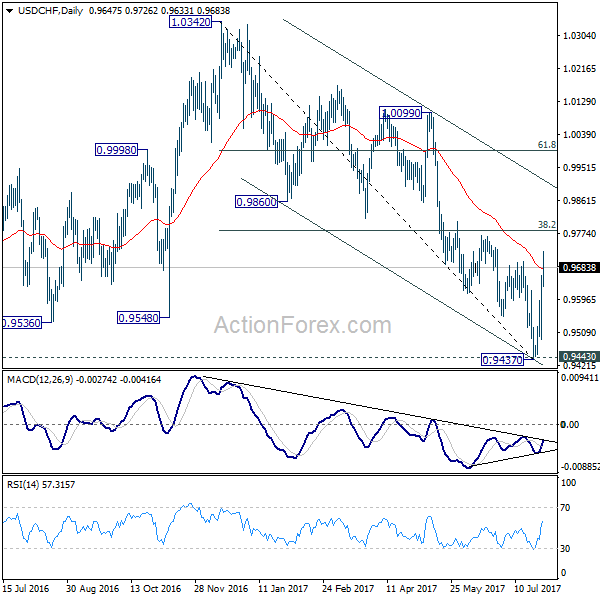
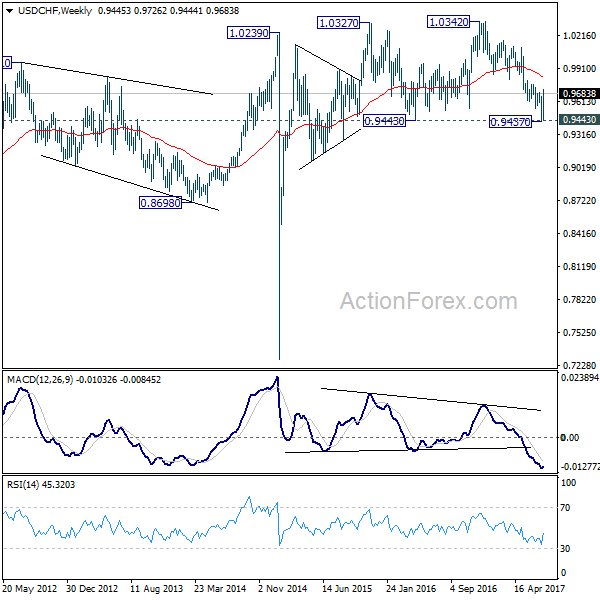
USD/CHF Weekly Outlook
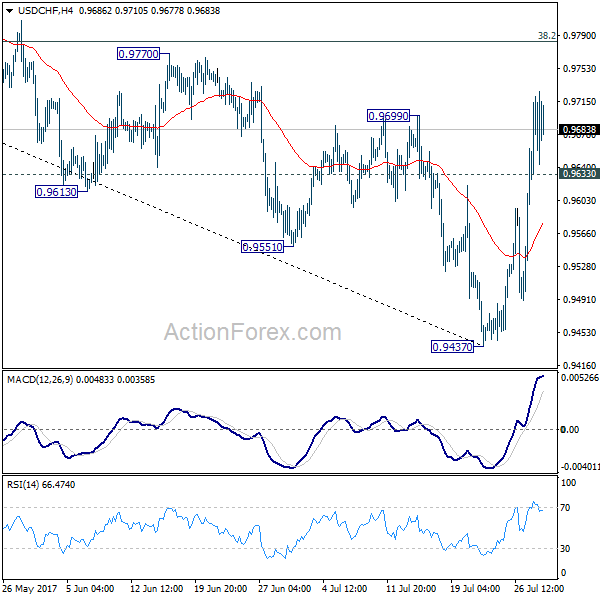
USD/CHF's rebound from 0.9437 extended to as high as 0.9726 last week. The break of 0.9699 resistance suggests near term reversal after defending 0.9443 key support. Initial bias remains on the upside this week for 38.2% retracement of 1.0342 to 0.9437 at 0.9783 first. Break will target channel resistance (now at 0.9899). On the downside, below 0.9633 minor support will turn intraday bias neutral and bring consolidations first.
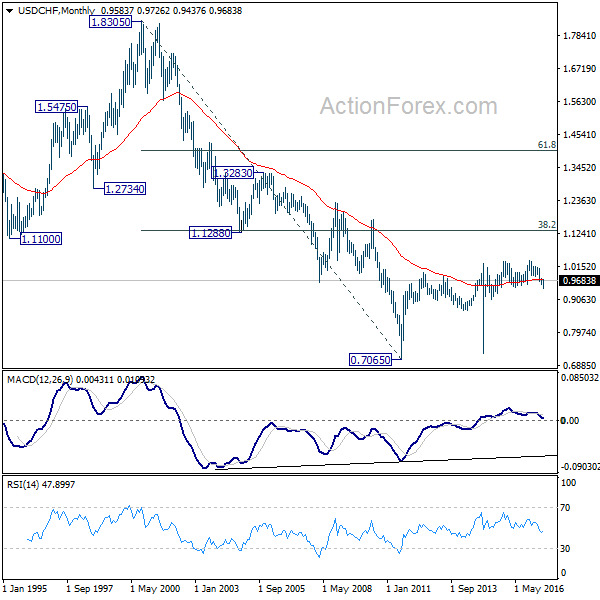
In the bigger picture, current development argues that USD/CHF has successfully defended 0.9443 key support level. And long term range trading in 0.9443/1.0342 is extending with another rise. At this point, there is no sign of an up trend yet. Hence, while further rise is expected in USD/CHF, we'll start to be cautious on loss of momentum above 61.8% retracement of 1.0342 to 0.9437 at 0.9996.
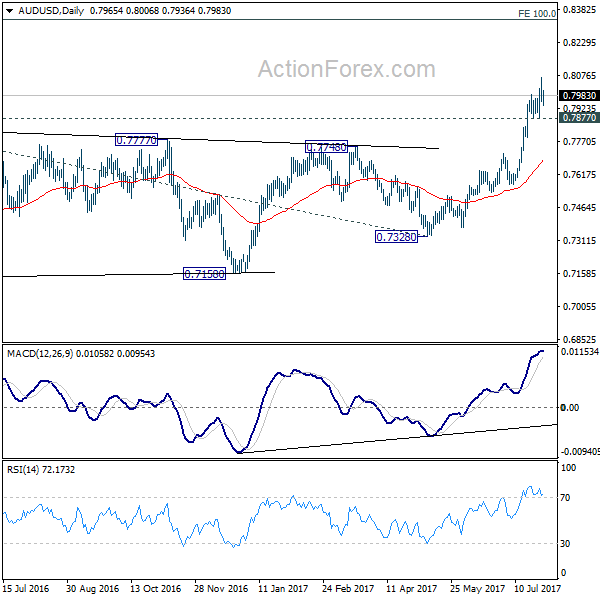
AUD/USD Weekly Outlook
AUD/USD's rally resumed last week to 0.8065 but lost momentum since then. Initial bias is neutral this week for consolidation. Another rally is expected as long as 0.7877 support holds. Break of 0.8065 will target 100% projection of 0.6826 to 0.7833 from 0.7328 at 0.8335. Nonetheless, break of 0.7877 will indicate short term topping on bearish divergence condition in 4 hour MACD. In such case, intraday bias will be turned back to the downside for 0.7711 resistance turned support.
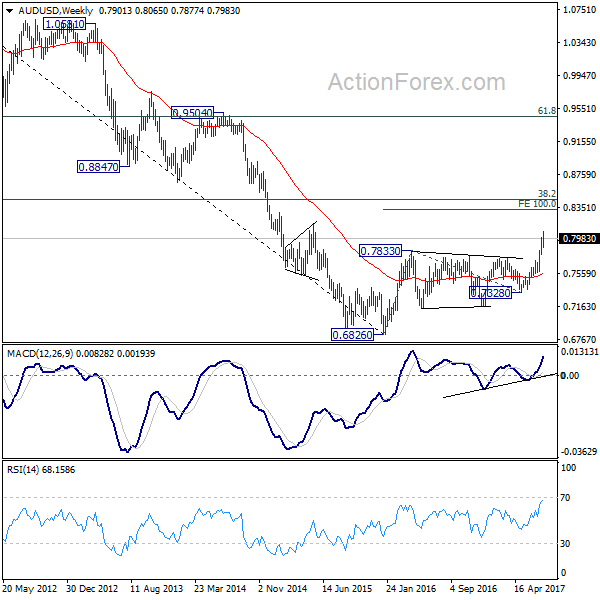
In the bigger picture, current development suggests that rebound from 0.6826 is developing into a medium term rise. There is no confirmation of trend reversal yet and we'll continue to treat such rebound as a corrective pattern. But in any case, further rise is now expected to 55 month EMA (now at 0.8100) or even further to 38.2% retracement of 1.1079 to 0.6826 at 0.8451. Break of 0.7328 support is needed to confirm completion of the rebound. Otherwise, further rise is now expected.
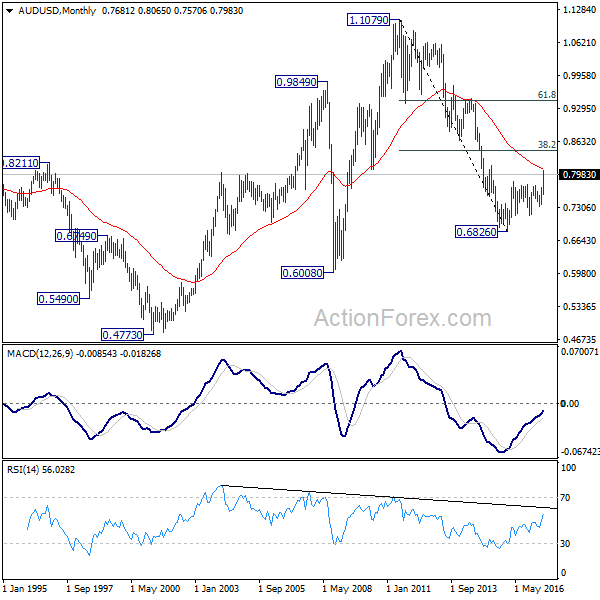
In the longer term picture, 0.6826 is seen as a long term bottom. Rise from there could either reverse the down trend from 1.1079, or just develop into a corrective pattern. At this point, we're favoring the latter. And, as long as 38.2% retracement of 1.1079 to 0.6826 at 0.8451 holds, we'd anticipate another decline through 0.6826 at a later stage.
USD/CAD Weekly Outlook
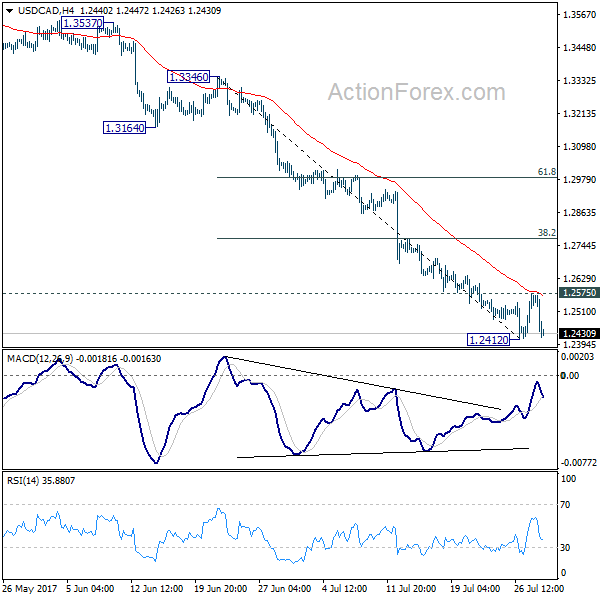
USD/CAD's decline continued last week and reached as low as 1.2412, breaking 1.2460 low. Subsequent recovery was weak and limited below 4 hour 55 EMA. Nonetheless, as 1.2412 holds, initial bias is neutral this week first. On the upside, above 1.2575 will extend the rebound from 1.2412 and target 38.2% retracement of 1.3346 to 1.2412 at 1.2769 first. On the downside, break of 1.2412 will extend recent fall from 1.3793 to next key fibonacci level at 1.2048.
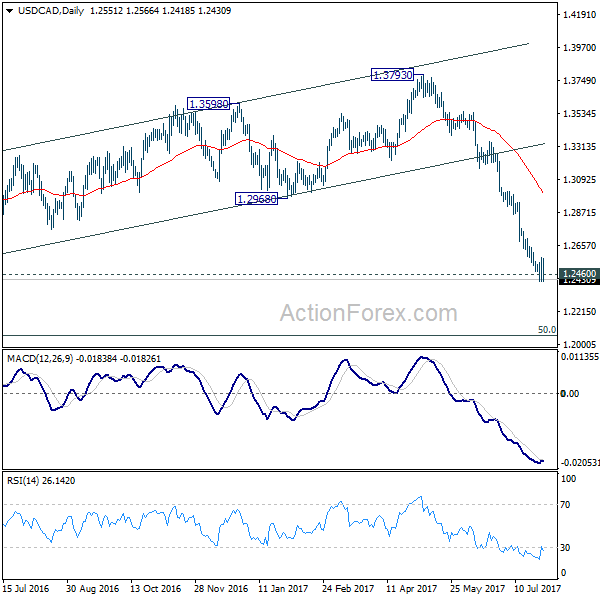
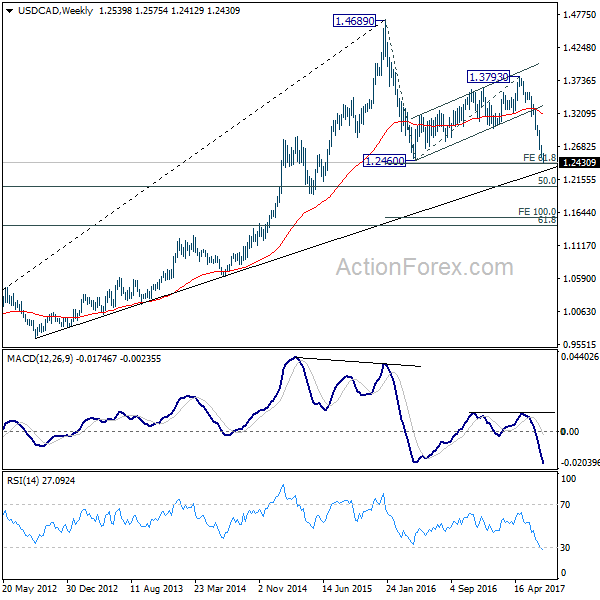
In the bigger picture, price actions from 1.4689 medium term top are seen as a correction pattern. Fall from 1.3793 is seen as the third leg and should target 50% retracement of 0.9406 to 1.4869 at 1.2048. At this point, we'd look for strong support from there to contain downside and bring rebound. However, firm break there will target 100% projection of 1.4689 to 1.2460 from 1.3793 at 1.1564.
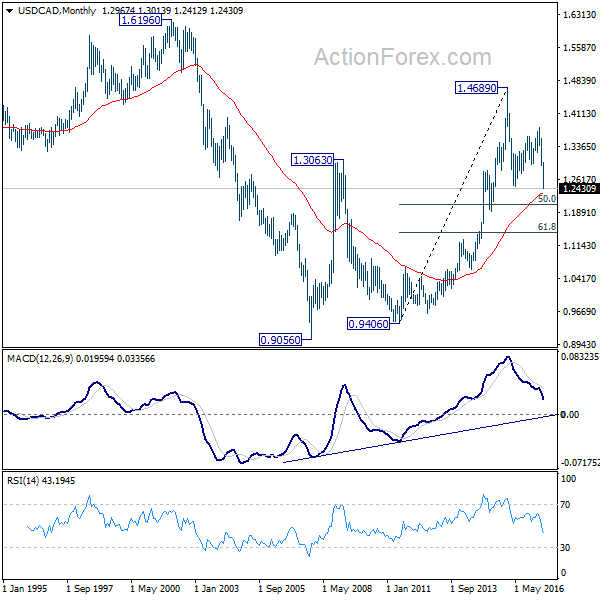
In the longer term picture, rise from 0.9056 (2007 low) is viewed as a long term up trend. It's taking a breath after hitting 1.4689. But such rise expected to resume later to test 1.6196 down the road. But firm break of 50% retracement of 0.9406 to 1.4869 at 1.2048 will raise doubt over this view.