
Sample Category Title
GBP/JPY Weekly Outlook
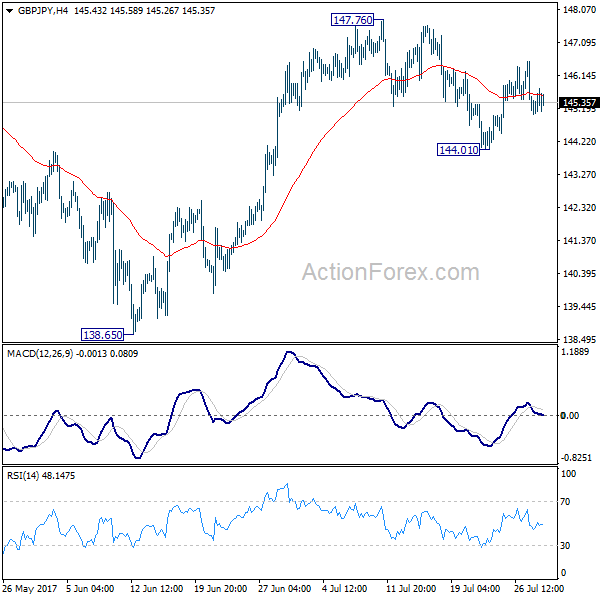
GBP/JPY drew support from both 55 day and 55 week EMA last week and recovered. Initial bias stays neutral this week first. On the upside, break of 147.76/148.42 key resistance zone will resume larger rebound from 122.36. On the downside, break of 144.01 will extend the sideway pattern from 148.20 with another fall back to 135.58/65 support zone.
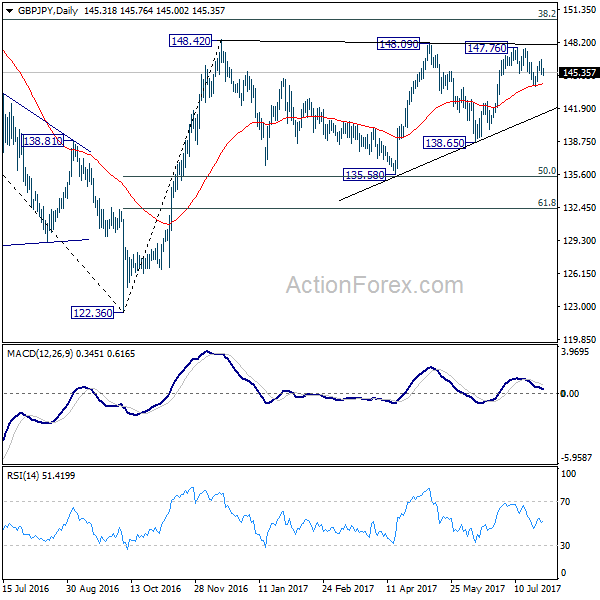
In the bigger picture, rise from medium term bottom at 122.36 is expected to continue to 38.2% retracement of 196.85 to 122.36 at 150.43. Decisive break there will carry long term bullish implications and pave the way to 61.8% retracement at 167.78. In case the sideway pattern from 148.42 extends, we'd be looking for strong support from 135.58 and 50% retracement of 122.36 to 148.42 at 135.39 to contain downside.
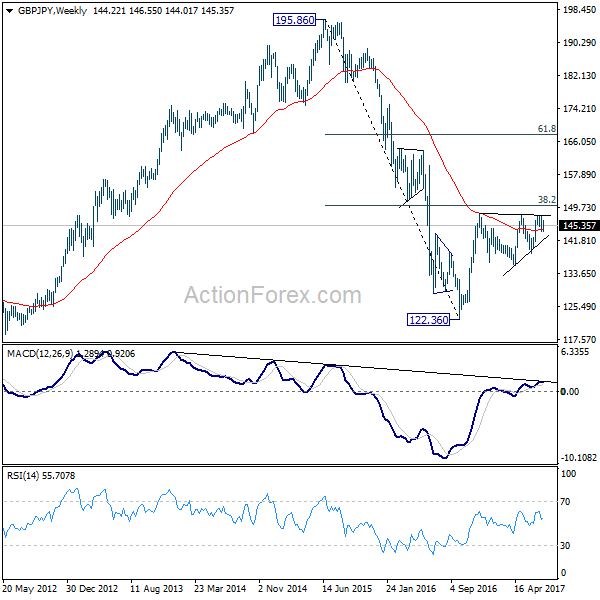
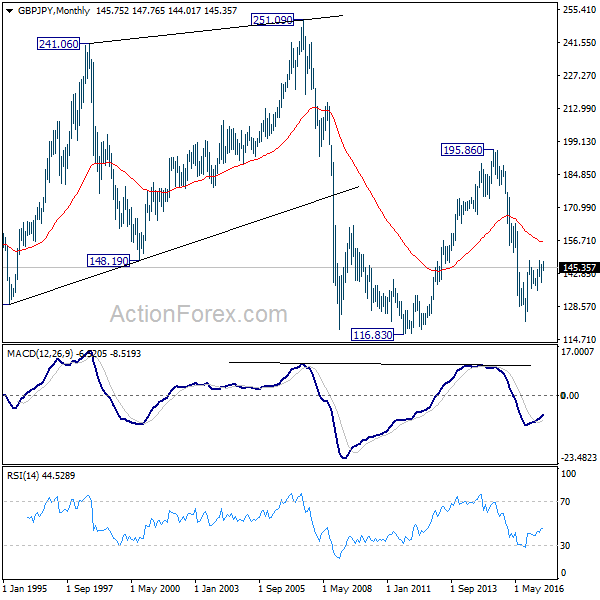
In the longer term picture, it remains to be confirmed is whole down trend from 195.86 has completed at 122.36 already and there is no confirmation yet. But in any case, firm break of 38.2% retracement of 195.86 to 122.36 at 150.43 would pave the way to 61.8% retracement at 167.78. And with that, the 55 month EMA will be firmly taken out which suggests that price actions from 116.83 is indeed a sideway pattern that could last more than a decade.
EUR/JPY Weekly Outlook
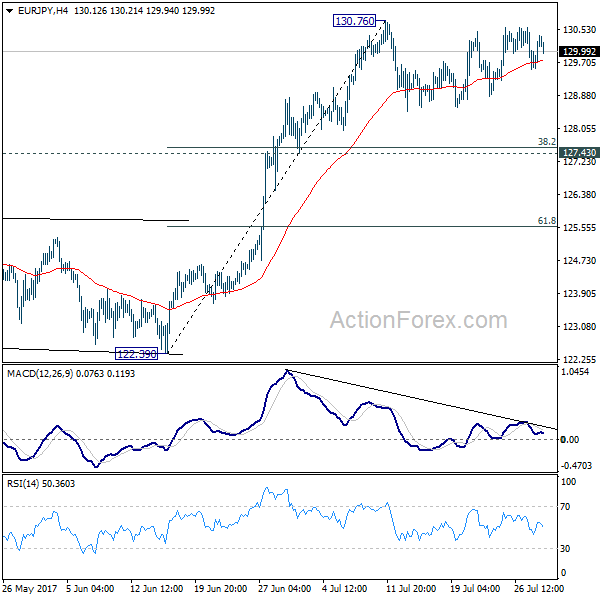
EUR/JPY's consolidation from 130.76 continued last week and outlook is unchanged. Initial bias remains neutral this week. Another fall cannot be ruled out. But downside should be contained by 127.43 cluster support (38.2% retracement of 122.39 to 130.76 at 127.56) and bring rebound. Above 130.76 will extend the larger rally to next key fibonacci level at 134.20.
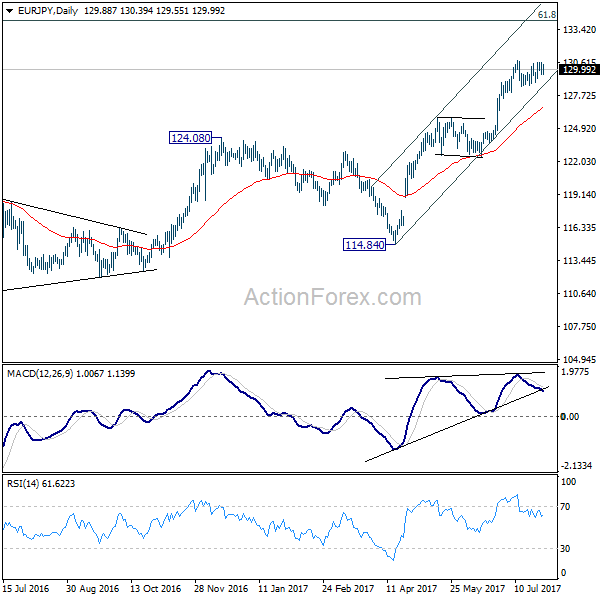
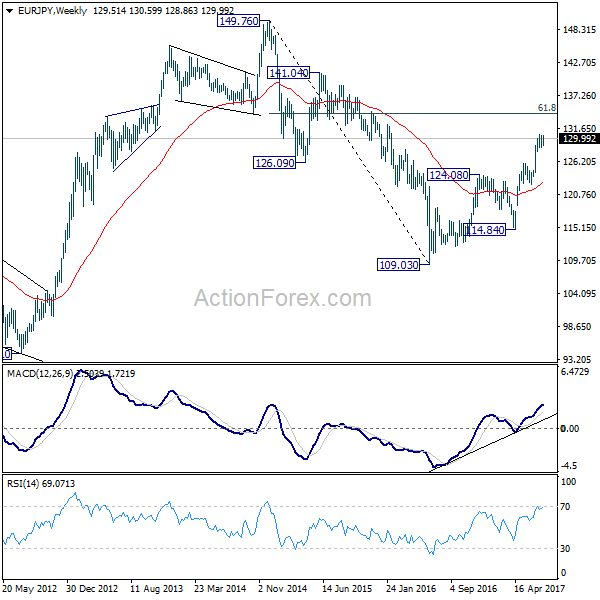
In the bigger picture, the down trend from 149.76 (2014 high) is completed at 109.03 (2016 low). Current rally from 109.03 should be at the same degree as the fall from 149.76 to 109.03. Further rise is expected to 61.8% retracement of 149.76 to 109.03 at 134.20. Sustained break there will pave the way to key long term resistance zone at 141.04/149.76. Medium term outlook will remain bullish as long as 124.08 resistance turned support holds.
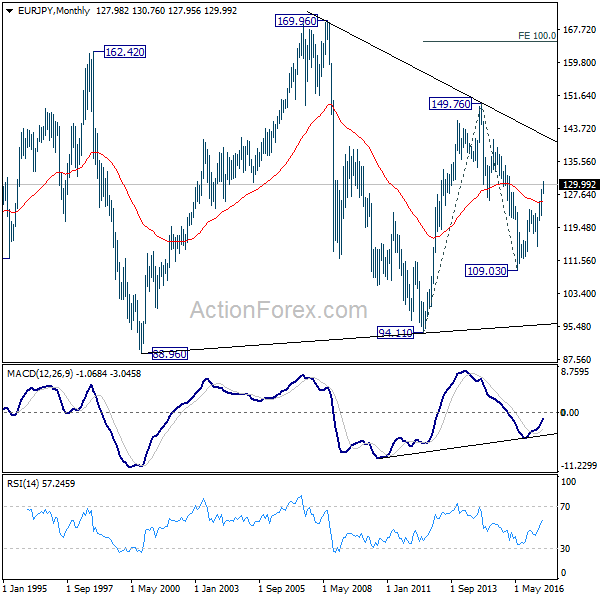
In the long term picture, at this point, there is no clear indication that rise from 109.03 is resuming that from 94.11. Hence, we'd be cautious on topping below 149.76 to extend range trading. Nonetheless, firm break of 149.76 will indicates strong underlying buying. In such case, EUR/JPY will target 100% projection of 94.11 to 149.76 from 109.03 at 164.68.
EUR/GBP Weekly Outlook
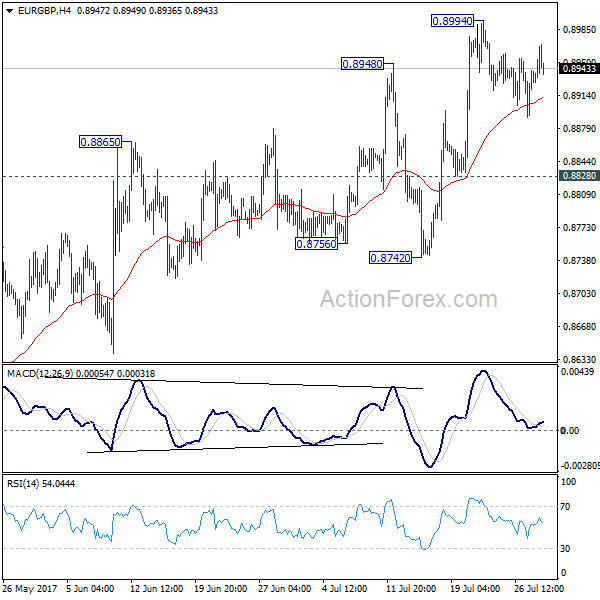
EUR/GBP stayed in consolidation from 0.8994 last week and outlook is unchanged. Initial bias is neutral this week first. Downside of retreat should be contained by 0.8828 to bring rise resumption. Whole rally from 0.8312 is still in progress and break of 0.8994 will target 0.9304 key high. There is no clear sign of up trend resumption yet. Hence, we'll be cautious on strong resistance from 0.9304 to limit upside and bring another fall. However, break of 0.8828 will turn focus back to 0.8742 support. Break there will indicate near term reversal.
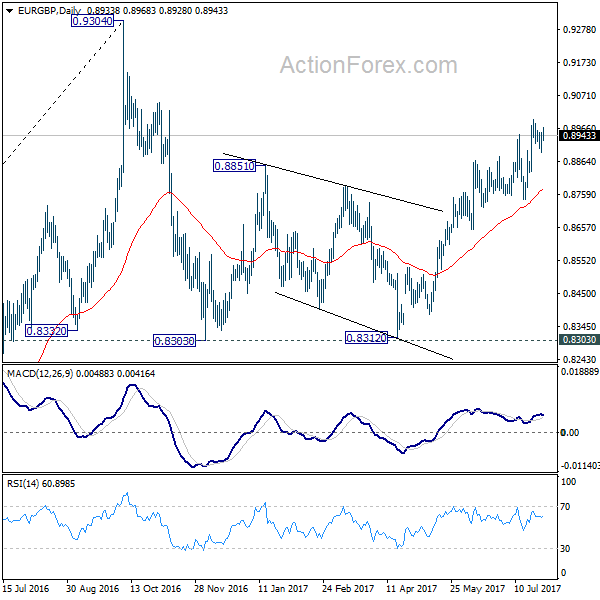
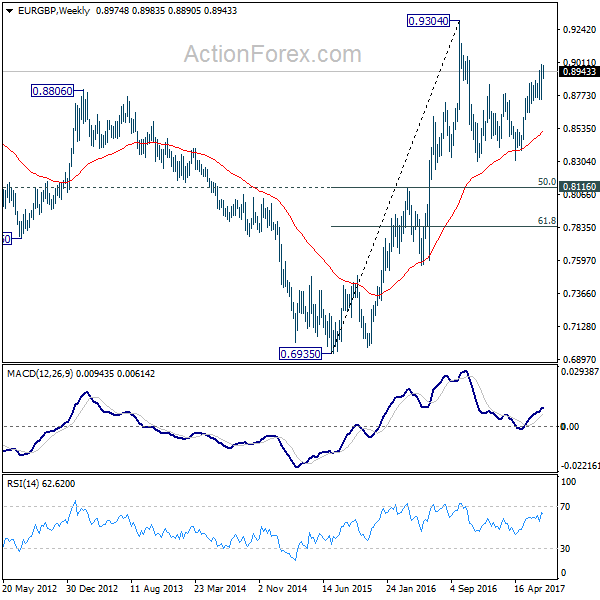
In the bigger picture, price actions from 0.9304 are viewed as a medium term corrective pattern. It's uncertain whether it is finished yet. But in case of another fall, we'd expect strong support from 0.8116 cluster support (50% retracement of 0.6935 to 0.9304 at 0.8120) to contain downside and bring rebound. Whole up trend from 0.6935 is expected to resume after consolidation from 0.9304 completes.
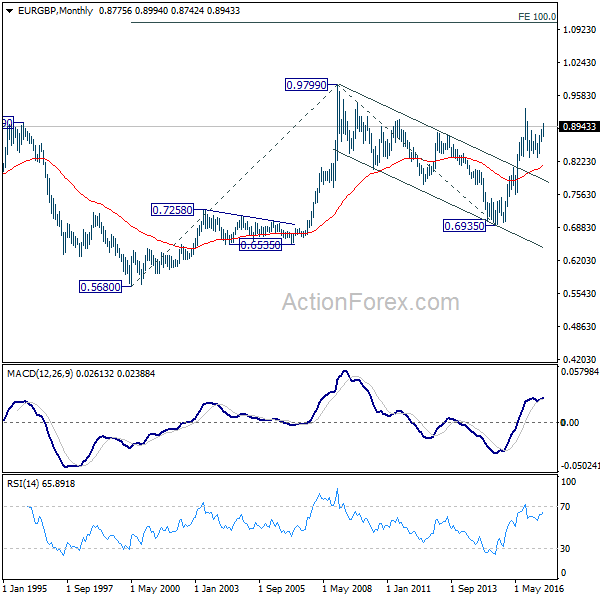
In the long term picture, firstly, price action from 0.9799 (2008 high) is seen as a long term corrective pattern and should have completed at 0.6935 (2015 low). Secondly, rise from 0.6935 is likely resuming up trend from 0.5680 (2000 low). Thirdly, this is supported by the impulsive structure of the rise from 0.6935 to 0.9304. Hence, after the correction from 0.9304 completes, we'd expect another medium term up trend to target 0.9799 high and above.
EUR/AUD Weekly Outlook
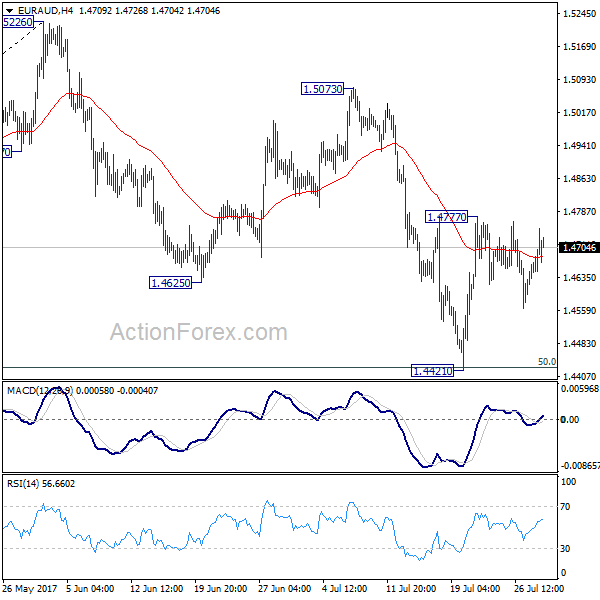
EUR/AUD stayed in consolidation below 1.4777 temporary top last week and outlook is unchanged. Initial bias remains neutral this week first. We continue to favor the case that correction from 1.5226 has completed with three waves down to 1.4421 already. Hence, another rally is expected. Break of 1.4777 will turn bias to the upside for 1.5073 resistance first. Break there will indicate resumption of whole rise from 1.3624. However, break of 1.4221 will invalidate our view and extend the decline from 1.5226 to 61.8% retracement of 1.3624 to 1.5226 at 1.4236.
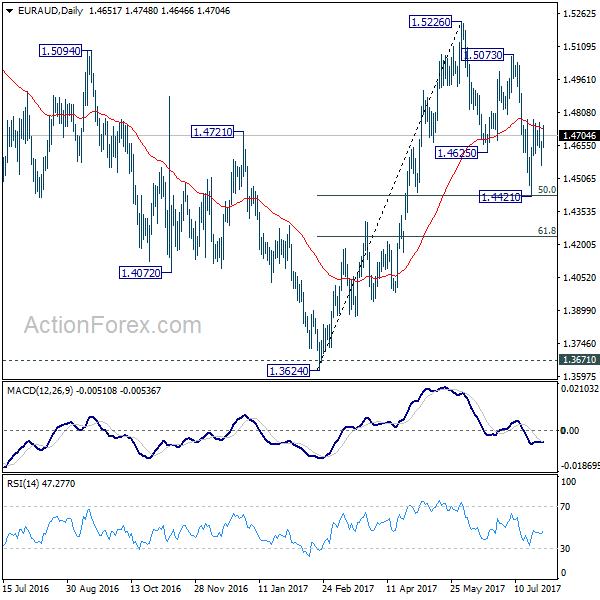
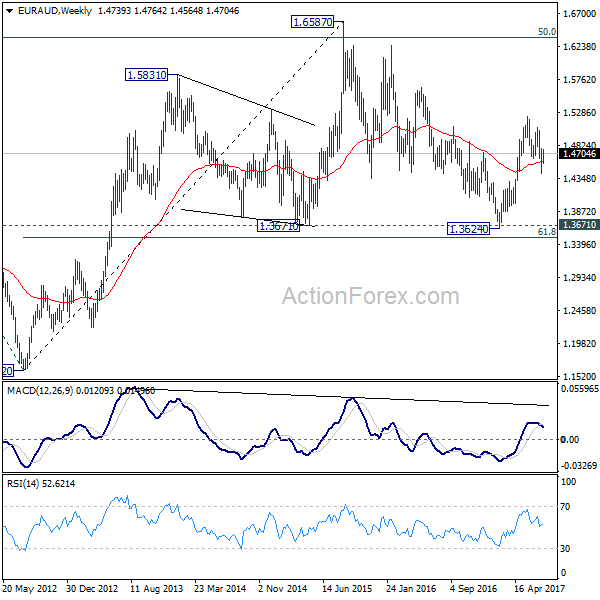
In the bigger picture, we're holding on to the view that corrective decline from 1.6587 medium term has completed at 1.3624. Rise from 1.3624 is expected to resume to retest 1.6587. The corrective structure of the fall from 1.5226 is affirming this view. Above 1.5226 will target a test on 1.6587 key resistance. However, another decline will dampen our view and would drag EUR/AUD lower to retest key support zone around 1.3624.
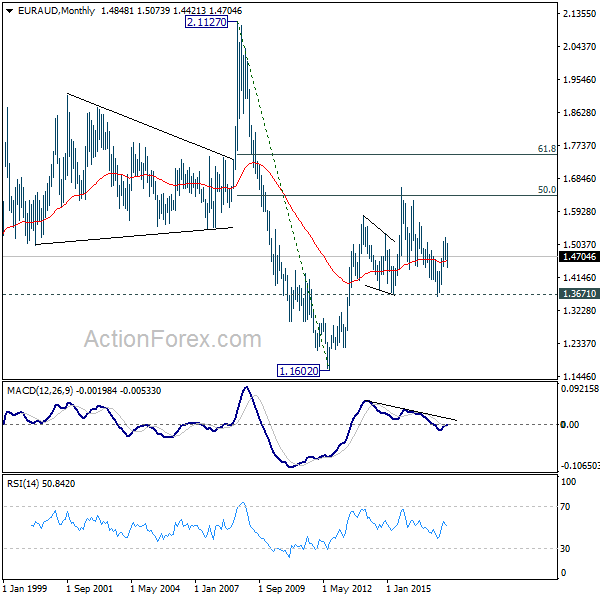
In the longer term picture, the rise from 1.1602 long term bottom isn't over yet. We'll keep monitoring the development but there is prospect of extending the rise to 61.8% retracement of 2.1127 to 1.1602 at 1.7488 and above. However, sustained trading below 1.3671 should confirm trend reversal and target 1.1602 long term bottom again.
EUR/CHF Weekly Outlook
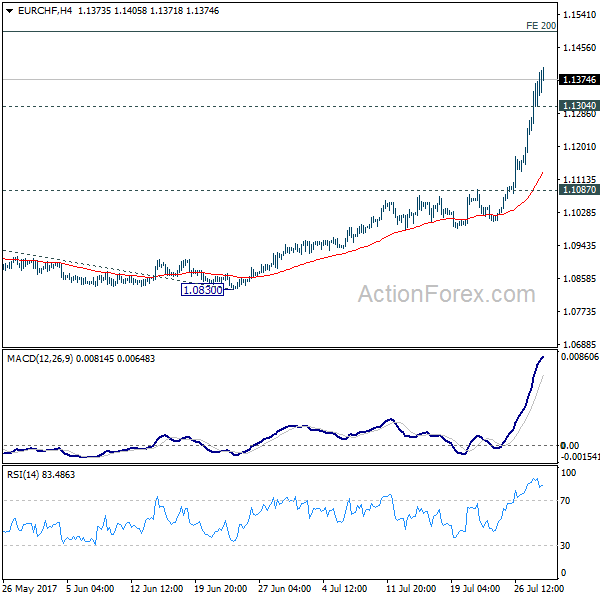
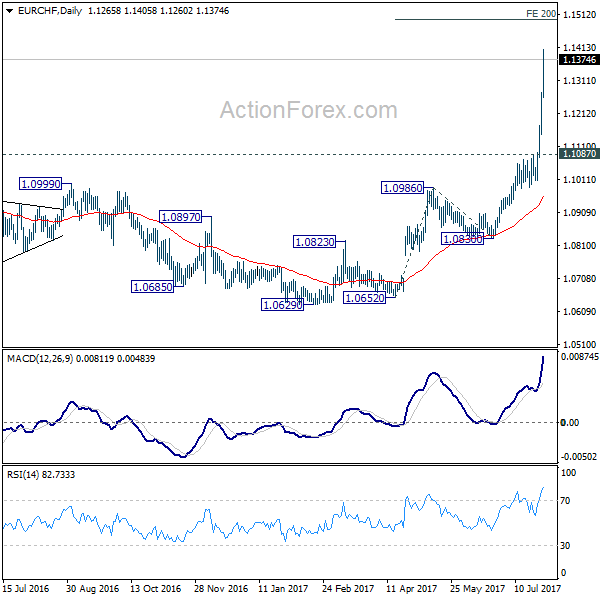
EUR/CHF surged sharply to as high as 1.1405 last week as recent rally accelerated. The strong break of 1.1198 resistance confirmed underlying bullishness. Initial bias remains on the upside this week. Current rise will target 200% projection of 1.0652 to 1.0986 from 1.0830 at 1.1498. On the downside, below 1.1304 minor support will turn intraday bias neutral and bring consolidations, before staging another rally.
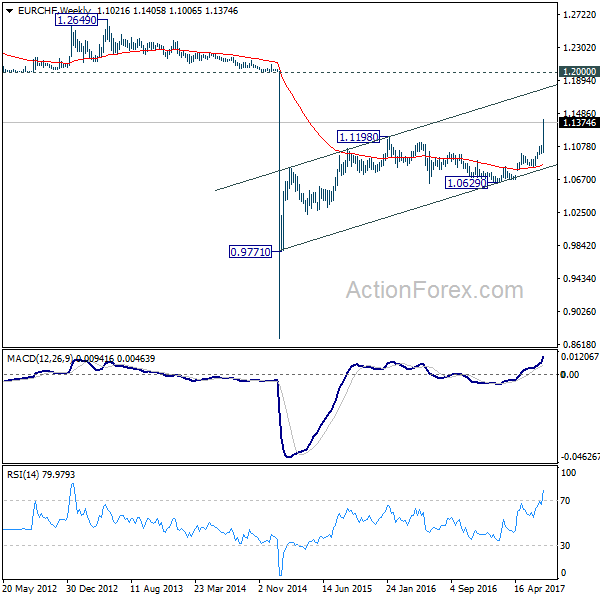
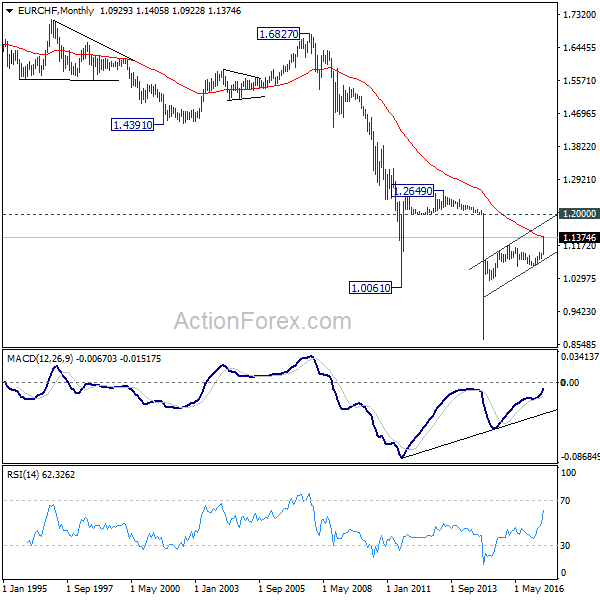
In the bigger picture, sustained break of 1.1198 key resistance confirms resumption of the long term rise from SNB spike low back in 2015. In this case, EUR/CHF would eventually head back to prior SNB imposed floor at 1.2000. For now, this will be the favored case as long as 1.1087 resistance turned support holds.
Swiss Franc Weakness to Persist, Risks Skewed to the Downside for Dollar and Sterling
While there were quite a number of key events last week, Swiss Franc came up as the surprised biggest mover. The Franc tumbled broadly as safe haven funds flowed out in accelerated pace. Franc has indeed ended the week down over -3% against Sterling, Aussie, Canadian, Kiwi and Euro. Against Yen and Dollar, Franc closed down -2.8% and -2.4% respectively. Dollar ended as the second weakest one as FOMC statement was taken as a dovish one while GDP price data missed. Also, continuous political drama in the White House means that there is still no clear light on when US President Donald Trump's tax reform would be implemented. Commodity currencies closed generally higher as supported by surge in energy and metal prices. Nonetheless, another surprise was that Sterling ended as the strongest one as it recovered on position squaring ahead of BoE Super Thursday.
Swiss Franc tumbled on Eurozone improvements
Swiss Franc and Euro are on two sides of the same coin. Funds will flow into the Swiss Franc when risks in Eurozone increase and flow out when situations stabilize. This could be clearly demonstrated by the strong rise in EUR/CHF from 1.0670 to 1.0812 on a gap open following French President Emmanuel Macron's win in the first round of election. On the background, political risks in Eurozone, according to some ECB officials, had become "tailwinds" already. Growth momentum in Eurozone has improved, which can be illustrated by IMF's upgrade of growth forecast. ECB is now widely expected to start at least tapering its bond purchases next year and stimulus exit is not too far away. Meanwhile, the strong rally in energy and metal prices would likely boost Eurozone inflation which further affirm the direction of ECB policy path.
Successful Greece bond sales the trigger
Policy divergence is a key in EUR/CHF's strong rise and Swiss Franc's selloff. SNB chairman Thomas Jordan reiterated earlier in the week that the Franc remained significantly over-valued, indicating that he's not ready to change the negative rates policy. But in our view, the trigger for the accelerated selloff was the successful bond sales in Greece, the first one since 2014. Greece sold EUR 5b of its five-year bond was sold at yield at 4.625%, notably lower than 4.95% back in the auction in 2014. The overall developments pushed Spanish/German yield spread to the tightest level since 2015. Italian/German yield spread also dropped to the lowest level since December. All point to reduced need for safe haven parking in the Franc. And indeed, Franc could now be viewed as a ideal candidate for carry trades as the financial markets are generally in full risk-on mode.
Swiss to be weaker than even Yen
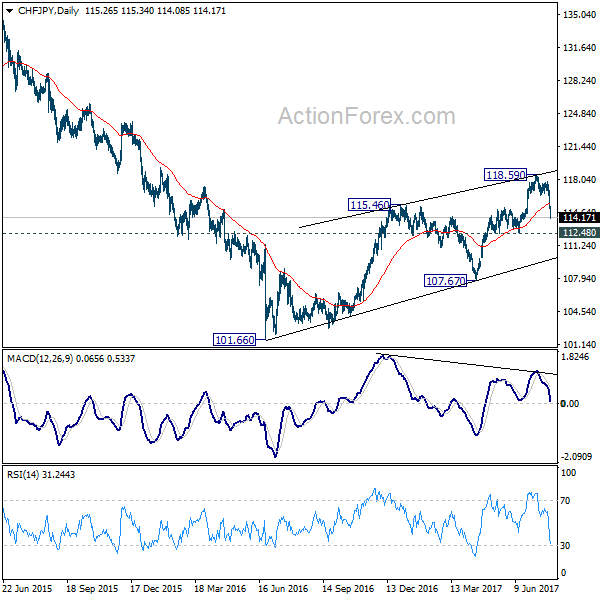
Development in CHF/JPY suggests that there is more downside potential in the Swiss Franc ahead. Last week's sharp fall argues that the corrective rise from 101.66 could have completed with three waves up to 118.69 already, on bearish divergence condition in daily MACD. Focus is now back on 112.48 support. Break there will affirm this bearish view pave the way to 107.67 key support level next. As we noted many times before, we're expecting Yen to be pressured as markets enter into an era of monetary stimulus exit. Current reversal in CHF/JPY argues that the Swiss Franc could be even more pressured.
Dollar lower on FOMC, GDP
Dollar ended generally lower as markets perceived FOMC statement as a dovish one. Fed left its monetary policy unchanged, maintaining the federal funds rate target at 1-1.25%. The Fed made two tweak in the statement, though. First, it noted that balance sheet reduction would begin 'relatively soon', signaling that the official announcement would come in September. And that means, Fed will pushed back another rate hike to December to hold the card on its hand first. Second, policymakers revised lower the outlook on core inflation. Q2 GDP grew 2.6% annualized, up from prior 1.4% and versus consensus of 2.5%. However, GDP price index slowed to 1.0%, down from 1.9% and below expectation of 1.3%.
IMF added more pressure
Adding pressure to the Greenback, IMF kept global growth forecast unchanged at 3.5% for 2017 and 3.6% for 2018. But, growth forecasts for the US was lowered to 2.1% in 2017 and 2.1% in 2018, down from April projection of 2.3% and 2.5% respectively. IMF noted the "uncertainty" over US President Donald Trump's policies as the main factor for the downward revision. IMF said that "the major factor behind the growth revision, especially for 2018, is the assumption that fiscal policy will be less expansionary than previously assumed, given the uncertainty about the timing and nature of U.S. fiscal policy changes."
In addition, IMF said in another report that the US dollar was overvalued by 10% to 20% based on near-term economic fundamentals. Meanwhile, Euro, Yen and Yuan exchange rate are broadly in line with fundamentals. IMF also urged US to address current account imbalances and warned that "if they're not dealt with appropriately and through the right policies, we could have a backlash in the form of protectionism."
Dollar index still heading to 91.91/93
Dollar index's decline from 103.82 extended last week to close at 93.26. Further is expected in near term. But the index should target to get enough support from 91.91 cluster level, 38.2% retracement of 72.69 to 103.82 at 91.93 to contain downside and bring rebound. Break of 95.47 resistance will be the first sign of reversal. However, firm break of 91.91/93 will pave to way through 50% retracement at 88.25, possibly to 61.8% retracement at 84.58 before completing the correction from 103.82.
Sterling recovered ahead of BoE, but risks skewed to the downside
While Sterling ended higher against all others last week, there was no indication of change in trend yet. Indeed it was merely traders adjusting positions ahead of BoE Super Thursday. And, it should be noted that UK was another country IMF lowered growth forecast for this year. Q2 GDP released last week showed sluggish 0.3% qoq growth only. CPI slowed sharply from 2.9% yoy in 2.6% yoy in June and that's a key factor limiting any rebound attempt in the Pound. BoE super Thursday and PMIs would be closely watched this week.
There is little chance for BoE to hike interest rate this time. The most hawkish member Kristin Forbes has left the MPC already. It's uncertain whether her replacement would vote for a hike. Chief economist Andy Haldane, though hawkish, seems not ready to vote for a hike yet. Overall, there would be at most three members voting for a hike, and the base case could indeed be two, just Michael Saunders and Ian McCafferty. Should either Saunders or McCafferty changes is mind, that would be a rather dovish voting. BoE's updated forecast will also be watched.
Volatility for sure this week
Looking ahead, there are quite a number of important events scheduled this week. And volatility is like certainty. ISM indices and non-farm payroll are important data. But we'd like to emphasize that they're not going to change Fed's plan to start unwinding the assets in September. And Fed will need a string of strong inflation related data, including wage growth to convince it to hike again in December. Dollar's risks to NFP are skewed to the downside and any post NFP rebound might be short-lived. In addition to that UK will release PMIs and BoE rate decision. Eurozone will release PMIs and CPI. Canada job report will be a key for the Canadian Dollar. RBA meeting and a string of Chinese data will be important for commodities and Aussie.
EUR/CHF Weekly Outlook
EUR/CHF surged sharply to as high as 1.1405 last week as recent rally accelerated. The strong break of 1.1198 resistance confirmed underlying bullishness. Initial bias remains on the upside this week. Current rise will target 200% projection of 1.0652 to 1.0986 from 1.0830 at 1.1498. On the downside, below 1.1304 minor support will turn intraday bias neutral and bring consolidations, before staging another rally.
In the bigger picture, sustained break of 1.1198 key resistance confirms resumption of the long term rise from SNB spike low back in 2015. In this case, EUR/CHF would eventually head back to prior SNB imposed floor at 1.2000. For now, this will be the favored case as long as 1.1087 resistance turned support holds.