
Sample Category Title
Trade Idea Wrap-up: USD/CHF – Buy at 0.9600
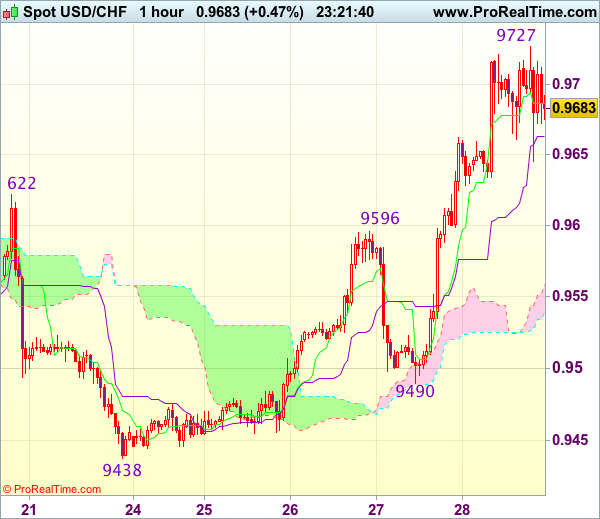
USD/CHF - 0.9686
Most recent candlesticks pattern : N/A
Trend : Near term down
Tenkan-Sen level : 0.9686
Kijun-Sen level : 0.9663
Ichimoku cloud top : 0.9559
Ichimoku cloud bottom : 0.9539
Original strategy :
Buy at 0.9600, Target: 0.9700, Stop: 0.9565
Position : -
Target : -
Stop : -
New strategy :
Buy at 0.9600, Target: 0.9700, Stop: 0.9565
Position : -
Target : -
Stop : -
Although the greenback slipped to 0.9490 yesterday, renewed buying interest emerged and dollar has rallied above indicated resistance at 0.9622-35, confirming recent decline has ended at 0.9438, hence upside bias is seen for the move from there to extend gain to 0.9730, however, break there is needed to retain bullishness and encourage for headway to 0.9750-60, then 0.9780 but reckon 0.9800 would hold from here.
In view of this, would not chase this rise here and would be prudent to buy dollar on pullback as previous resistance at 0.9596 should turn into support and contain dollar’s downside. Below 0.9570 would defer and risk test of the upper Kumo (now at 0.9559) but price should stay well above support at 0.9490, bring another rise later.
Trade Idea Wrap-up: GBP/USD – Stand aside
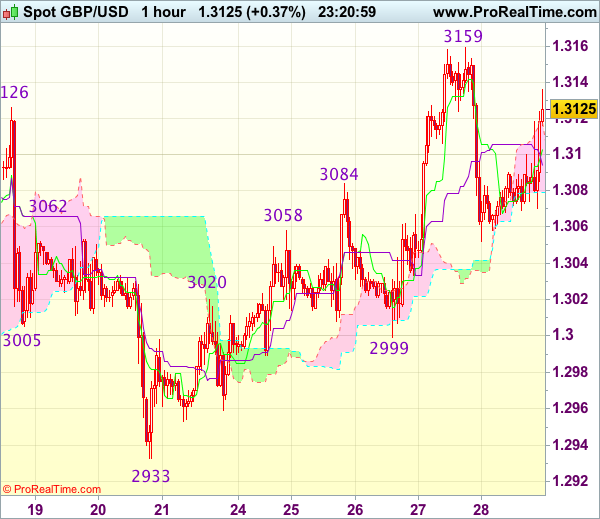
GBP/USD - 1.3118
Most recent candlesticks pattern : N/A
Trend : Near term up
Tenkan-Sen level : 1.3103
Kijun-Sen level : 1.3094
Ichimoku cloud top : 1.3118
Ichimoku cloud bottom : 1.3079
New strategy :
Stand aside
Position : -
Target : -
Stop : -
Although cable has rebounded after finding support at 1.3052 yesterday and gain towards 1.3159 (this week’s high) cannot be ruled out, break there is needed to revive bullishness and signal recent upmove has resumed and extend further gain to 1.3185-90 and then 1.3210-20, otherwise, further choppy trading below said this week’s high would take place, bring another retreat later.
On the downside,e below 1.3070 would prolong consolidation, bring weakness to 1.3050-52, break there would suggest a temporary top is possibly formed, bring retracement of recent rise to 1.3030 but support at 1.2999 should remain intact, bring rebound later. As near term outlook is mixed, would be prudent to stand aside in the meantime.
Trade Idea Wrap-up: EUR/USD – Stand aside
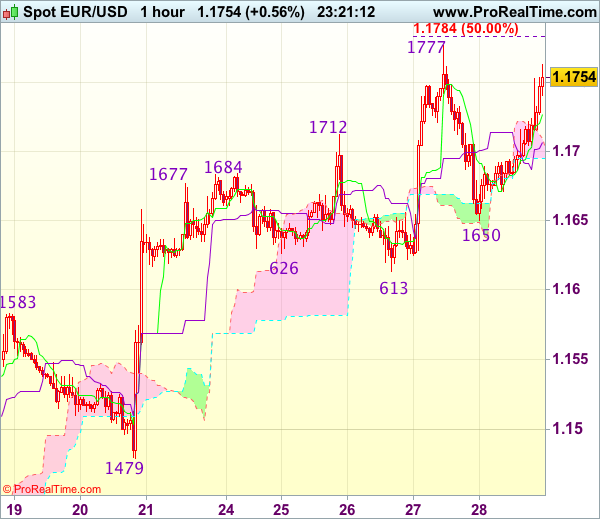
EUR/USD - 1.1756
Most recent candlesticks pattern : N/A
Trend : Near term up
Tenkan-Sen level : 1.1727
Kijun-Sen level : 1.1707
Ichimoku cloud top : 1.1710
Ichimoku cloud bottom : 1.1695
New strategy :
Stand aside
Position : -
Target : -
Stop : -
As the single currency found support at 1.1650 and has recovered, suggesting further recovery cannot be ruled out, however, break of this week’s high at 1.1777 is needed to signal recent upmove has once again resumed and extend gain to 1.1784-85 (50% projection of 1.1370-1.1712 measuring from 1.1613). then 1.1800 but loss of near term upward momentum should prevent sharp move beyond 1.1820-25 (61.8% projection), risk from there has increased for a retreat later.
In view of this, would not chase this rise here and would be prudent to stand aside for now. Below 1.1700 would bring test of said support at 1.1650 but break there is needed to signal a temporary top is possibly formed, bring further weakness towards support at 1.1613, having said that, price should stay well above previous resistance at 1.1583 (now support), bring another rise later.
Dollar Continues Declining after Robust Growth; Loonie Eyes Fresh High
Second quarter US GDP estimates dominated investors' attention during today's European session trading. Certain components within the data led to the dollar recording losses as the news became public, though those were short-lived. In other notable releases, Canadian growth figures for May were released today as well.
The much-awaited preliminary US GDP estimates for the second quarter of the year showed the economy expanding at an annualized rate of 2.6%, as expected. First quarter growth was revised downwards to 1.2% from the previous 1.4%. The advance GDP deflator estimate, which acts as a broad inflationary indicator by measuring the change in the price of all goods and services included in GDP calculations, showed a 1.0% quarter-on-quarter growth during the second quarter. This fell short of expectations for a reading of 1.3% and came in below the first quarter's respective number of 2.0%, which was the result of an upward revision from 1.9%.
The figures verify that the slowdown during the first quarter was temporary, as increased consumer spending led the way for stronger growth during the second quarter of the year. However, price data in the report are suggesting that inflation is moving significantly below the Federal Reserve's 2% target. The greenback initially reacted negatively to the data relative to majors including the yen, euro and the pound, though it quickly made up those losses, especially with respect to the latter two.
Other US data pertained to the final reading of the University of Michigan's Consumer Sentiment index. That came in at 93.4, above forecasts and the previous month's 93.1. Dollar/yen advanced on the data, though it didn't manage to maintain those gains for long.
In terms of forex market movements, the dollar index, which gauges the greenback against the currencies of six major US trading partners, was last down by a sizable 0.5% on the day and close to the 13-month low of 93.15 hit yesterday. Dollar/yen was 0.3% down, trading around the 111 level. Euro/dollar was up 0.6% at 1.1737 and pound/dollar 0.3% up, marginally above the 1.31 handle.
In other news, the Swiss franc continued losing ground versus the euro in today's trading, looking set to record its fourth straight day of declines. Euro/swissie today touched 1.1396, the highest since the Swiss National Bank dropped its peg on the euro in mid-January 2015. The movement is in part attributed to the European Central Bank and Swiss National Bank seemingly diverging in terms of monetary policy.
Canada saw the release of GDP numbers for May today. The nation's economy expanded by 0.6% month-on-month, far outpacing expectations for a growth rate of 0.2%, which also coincided with the previous month's figure. The loonie gained on the data, with dollar/loonie eventually falling to as low as 1.2419, close to the 25-month low of 1.2413 hit yesterday. The pair traded at 1.2525 before the numbers went public. The Canadian dollar has also been gaining on the back of rising oil prices as Canada is a major oil exporter.
Turning to commodities, gold gained on the back of dollar weakness, rising to a one-and-a-half-month high of $1267.85 an ounce in today's trading. The precious metal was last trading close to this level. WTI and Brent crude maintained momentum from previous days. They traded at $49.60 a barrel and $52.40, up 1.1% and 1.8% respectively, in afternoon European trading hours.
The Baker Hughes Oil Rig Count will be released at 17:00 GMT. FOMC voting member Neel Kashkari is scheduled to speak at 17:20 GMT.
Trade Idea Wrap-up: USD/JPY – Hold short entered at 111.45
USD/JPY - 110.80
Most recent candlesticks pattern : N/A
Trend : Near term down
Tenkan-Sen level : 111.00
Kijun-Sen level : 111.21
Ichimoku cloud top : 111.49
Ichimoku cloud bottom : 111.37
Original strategy :
Sold at 111.45, Target: 110.45, Stop: 111.75
Position : - Short at 111.45
Target : - 110.45
Stop : - 111.75
New strategy :
Hold short entered at 111.45, Target: 110.45, Stop: 111.40
Position : - Short at 111.45
Target : - 110.45
Stop : - 111.40
As the greenback has fallen again after meeting renewed selling interest at 111.71, retaining our bearishness for a retest of this week’s low t 110.62, however, break there is needed to confirm recent decline has resumed and extend further weakness to 110.30-35 but reckon 110.00-05 would hold from here due to near term oversold condition, risk from there is seen for a rebound next week.
In view of this, we are holding on to our short position entered at 111.45. Only above said resistance at 111.71 would defer and prolong choppy trading, however, price should still falter below said resistance at 112.20, bring retreat later.

Trade Idea: EUR/GBP – Buy at 0.8925
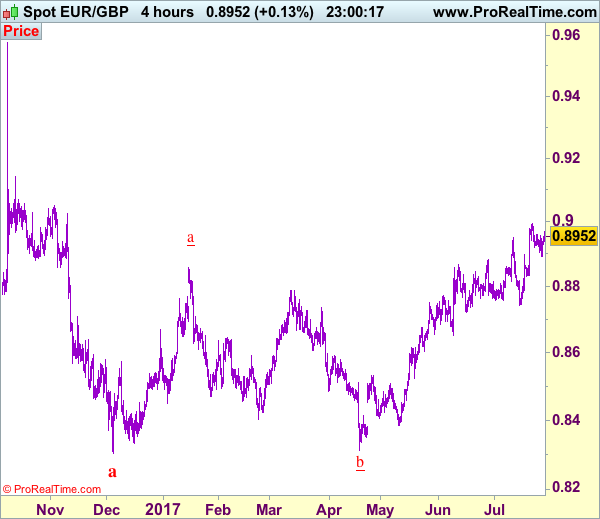
EUR/GBP - 0.8957
Recent wave: Major double three (A)-(B)-(C)-(X)-(A)-(B)-(C) is unfolding and 2nd (A) has possibly ended at 0.6936.
Trend: Near term up
Original strategy :
Buy at 0.8865, Target: 0.8995, Stop: 0.8825
Position : -
Target : -
Stop : -
New strategy :
Buy at 0.8925, Target: 0.9025, Stop: 0.8885
Position : -
Target : -
Stop : -
The single currency found renewed buying interest at 0.8891 and has staged a rebound, suggesting the pullback from 0.8995 has possibly ended there, hence retest of this level would be seen, however, break there i needed to confirm upmove has resumed for test of psychological resistance at 0.9000, then 0.9020 but reckon upside would be limited to 0.9050 due to overbought condition, risk from there has increased for a retreat later.
In view of this, would not chase this rise here and would be prudent to buy euro on dips as 0.8920-25 should limit downside. A break of said support at 0.8891 would defer and suggest a temporary top is formed instead, bring correction to 0.8860-65 but only break of support at 0.8829 would provide confirmation, bring correction to 0.8800 first.
Our preferred count is that, after forming a major top at 0.9805 (wave V), (A)-(B)-(C) correction is unfolding with (A) leg ended at 0.8400 (A: 0.8637, B: 0.9491 and 5-waver C ended at 0.8400. Wave (B) has ended at 0.9413 and impulsive wave (C) has either ended at 0.8067 or may extend one more fall to 0.8000 before prospect of another rally. Current breach of indicated resistance at 0.9043 confirms our view that the (C) leg has ended and bring stronger rebound towards 0.9150/54, then towards 0.9240/50.
Trade Idea: USD/CAD – Sell at 1.2690
USD/CAD - 1.2423
Recent wave: Only wave v of c has ended at 0.9407 and wave C of major A-B-C correction is underway with wave iii ended at 1.4690, wave v of C may bring one more marginal rise probably in 2018
Trend: Down
Original strategy :
Sell at 1.2690, Target: 1.2490, Stop: 1.2750
Position: -
Target: -
Stop: -
New strategy :
Sell at 1.2690, Target: 1.2490, Stop: 1.2750
Position: -
Target: -
Stop:-
As the greenback has fallen again after brief rebound, suggesting recent decline is still in progress and bearishness remains for further weakness to 1.2400, then towards 1.2350-60, however, oversold condition should prevent sharp fall below 1.2330 and reckon 1.2300 would hold, risk from there is seen for a rebound later. We are keeping our count that wave v as well as wave (C) ended at 1.3794 and impulsive wave (i ii, i ii) is now unfolding with minor wave iii still in progress, hence bearishness remains for this fall to extend weakness to aforesaid downside targets.
In view of this, would not chase this fall here and would be prudent to sell the pair again on recovery as 1.2690-95 should limit upside. Above 1.2745-50 would defer and risk a stronger rebound to 1.2800-10 but only break of latter level would signal a temporary low is formed instead, bring retracement of recent decline to 1.2850, then 1.2900, however, price should falter below 1.3000 and the greenback shall head south again from there.
To recap, wave B from 1.3066 is unfolding as an a-b-c and is sub-divided as a: 1.2192, b: 1.2716 and wave c is a 5-waver with i: 1.1983, ii: 1.2506, extended wave iii with minor iii at 1.0206, wave iv ended at 1.0781 and wave v as well as wave iii has ended at 0.9931, hence the subsequent choppy trading is the wave iv which is unfolding as (a)-(b)-(c) with (a) leg of iv ended at 1.0854, followed by (b) leg at 1.0108 and (c) leg as well as the wave iv ended at 1.0674. The wave v is sub-divided by minor wave (i): 0.9980, (ii): 1.0374, (iii): 0.9446, (iv): 0.9913 and (v) as well as v has possibly ended at 0.9407, therefore, consolidation with upside bias is seen for major correction, indicated target at 1.3700 and 1.4000 had been met and further gain to 1.4700 would be seen later.

US – GDP Bounces Back to Trend: Inflation Remains a Challenge
GDP Q2 bounced back to a trend-like 2.6 percent with the help of solid consumer spending and business investment. Flagging inflationary pressures continue to challenge current FOMC dot-plot expectations.
Second Quarter Bounce Back: Real Final Sales Solid
After the perennial residual seasonality issues and despite a negative inventory contribution, second quarter GDP returned to trend at 2.6 percent, annualized.
Underlying momentum for the economy is better gauged by real final sales to domestic purchasers, which came in at 2.4 percent, a reflection of solid consumer spending and continued business equipment spending (top graph). The gains in consumer spending reflect the gains in disposable personal income of 3.2 percent. Spending for durables and nondurables were areas where consumer spending rebounded most notably. Business equipment also contributed to growth at a moderate pace of 8.2 percent, consistent with core capital goods shipments. Core capital goods shipments and orders have been on an improving track, and with business leaders still optimistic that some progress can be made on the fiscal policy front, the outlook for business investment remains constructive.
Structures, government and net exports all added to GDP growth. Moreover, residential investment corrected from the favorable weather induced fast pace of the first quarter when activity was clearly pulled forward. Looking forward, the outlook for residential construction remains constructive as long as the labor market, including wage & salary growth continues to show improvement.
Inflation Remains Tame
Inflation, as measured by the PCE deflator, has registered soft performances over the prior four months and has grown just 1.6 percent, year over year (middle graph). The figure reinforces the view that the price environment exhibits little upward momentum as we enter the second half of the year. The FOMC will have to grapple with flagging price pressures as they assess the appropriate path for monetary policy. There is a lot of runway left before the December FOMC meeting where we believe the Fed may be in position to hike interest rates again, but a return to a quickening pace of inflation is critical to that call.
Outlook Going Forward
In the first half of the year, GDP growth has averaged just 1.9 percent. Looking ahead to the second half of the year, we expect GDP to accelerate slightly, averaging 2.5 percent. Continued job gains (bottom graph) along with signs that real disposable income is accelerating is supportive of our view of stronger consumer spending in the second half of the year. Global economic data has been surprising to the upside, suggesting that domestic business investment is also likely to slowly accelerate in the second half of the year. Should our forecast for H2 hold, year-over-year GDP growth should expand at a 2.2 percent pace in 2017, faster than the 1.5 percent rate observed in 2016.
EURCHF Rallies Sharply But Overbought RSI Could Weaken Bullish Bias
EURCHF surged to as high as 1.1396 so far, reaching the highest level since January 2015 after four days of big gains. The near-term bias remains on the upside as the pair is heading sharply higher.
Despite the market being overextended as indicated by the RSI which reached overbought territory above 70, the rally is not showing signs of exhaustion. The technical picture still looks bullish, with the three moving averages being positively aligned and giving bullish signals. The 20-day MA crossed above the 50-day MA, which is also located above the 200-day MA.
Prices are fast approaching a key level at 1.1400, which is likely to be a strong resistance area. The rally could pause here amidst an overextended market (if RSI remains overbought). A break above 1.1400 would open the way towards 1.1500 and then 1.1551 (161.8% Fibonacci extension level of move from 1.1200 to 1.0619).
Should prices fall below 1.1000, this would likely lead to consolidation and bring the pair back to a neutral bias. But only a drop below the 200-day MA in the 1.0700 handle would shift the overall market structure to bearish.
US: Economic Growth Accelerates in Q2
- The economy grew by 2.6% (annualized) in the second quarter according to the BEA's advance estimate - a hair below expectations for 2.7%.
- Real personal consumption expenditures grew by 2.8%, led by a 6.3% gain in durable goods spending. Spending on non-durable goods rose 3.8%, while spending on services was up a more moderate 1.9%.
- Non-residential fixed investment rose 5.2%, led by a 8.2% gain in equipment spending. Non-residential structures investment rose 4.9%, down from 14.8% in the first quarter as non-mining structures investment declined by 9.4% annualized - the largest decline in six quarters. Mining investment continued to support growth on increasing drilling activity, advancing by 117% (annualized), but still down from the 272% (annualized) pace in Q1.
- Net exports contributed marginally economic growth. Exports were up 4.1%, while imports rose 2.1%.
- Inventory investment was basically flat in the quarter (-0.3 billion from 1.2 billion in Q1).
- Benchmark revisions reduced first quarter growth to 1.2% from 1.4% previously. Annual average growth in 2016 was revised down to 1.5% (from 1.6%), while 2014 and 2015 were both revised up (to 2.6% and 2.9% from 2.4% and 2.6% respectively). All told, the positive revisions were larger than the downward ones and the American economy is 0.2% bigger than previously estimated.
Key Implications
- Not too shabby. As expected, economic growth accelerated from its soft opening and is once again is running at a capacity-absorbing pace.
- Still, with the downward revision to first quarter growth and 2.6% in the second quarter, economic growth will have to accelerate further in the second half of the year in order to hit the Federal Reserve's median forecast for 2.2% (on a Q4/Q4 basis). Fortunately, economic data has maintained momentum heading into the third quarter and there is good reason to expect this to happen.
- All told, there is little here to raise eyebrows at the Fed. As long as economic growth continues to run above 2.0%, the focus will likely remain firmly on inflation, wage growth, and unemployment for guidance on future monetary policy.