
Sample Category Title
Economic Growth Back On Track?
US equities continued to advance, helped by technology companies, with the S&P 500 rising on Monday following last week's sell-off with the index moving from 2421.06 up to 2429.13 on Monday. The market is now starting to analyze Q2 earnings for more indications that global economic growth is progressing as expected by many analysts – in turn helping push USD higher. As Global equities close in on reaching record highs, political uncertainty has taken a back seat to expected global economic growth. Recently released data indicated that Germany had a higher than expected trade surplus and recent employment data out of the US showed employers adding the most jobs for the past 4 months – suggesting a degree of buoyancy in growth. On Tuesday, in Sydney, San Francisco Federal Reserve President Williams stated “that it was a reasonable view to expect one more rate hike this year, and his own view was to start adjusting the central bank's balance sheet in the next few months”.
USDJPY rose to a high on Monday of 114.298, a 0.3% gain and the highest it has traded at since May 11th. BOJ Governor Kuroda reiterated his stance to maintain ultra-loose monetary policy until inflation is stable above its 2% target, a sign the BoJ will not join its U.S. and European counterparts in easing stimulus anytime soon. Currently, USDJPY is trading higher at around 114.38.
EURUSD traded in a narrow range on Monday of less than 40 pips, 0.4% compared to the average trading range for 2017 of 0.7%; 1.13813 to 1.14177. Currently, EURUSD is trading around 1.1388.
GBPUSD also traded in a narrow range compared to recent trading sessions of 0.4% compared to the average trading range for 2017 of 0.8%. An early morning high of 1.29079 retraced lower to 1.28545. Currently, GBPUSD is trading around 1.2874.
Oil traded up 0.2% on the day as traders analyzed the potential effectiveness of both Libya and Nigeria capping production. Both countries have been invited to a meeting in Russia on July 24th to discuss their production outlook. If Libya and Nigeria both agree to production cuts the markets are expecting oil prices to rise even with the heavy supply from non-OPEC producers. On Monday, WTI traded up from a low of $43.76pb to trade to a high of $44.96pb. Currently, WTI is trading lower at around $44.68pb.
Gold hit a 4-month low on Monday trading as low as $1,204.71 before rebounding higher to $1,215.44. Gold is currently trading lower at $1,211.
At 13:15 BST Canadian Housing Starts (YoY) (Jun) are scheduled to be released. CAD has been strong against USD of late as the markets are expecting an imminent rise in Canadian Interest rates. The previous release of 194.7K is expected to be bettered with the consensus suggesting a figure of 201.5K. Any stronger number will likely see CAD appreciate further against USD.
Australia’s Business Confidence Rose In June, While Business Conditions Improved To A Nearly Decade High In The Same Month
For the 24 hours to 23:00 GMT, the AUD declined 0% against the USD and closed at 0.7606.
LME Copper prices declined 0.5% or $29.0/MT to $5780.0/MT. Aluminium prices declined 0.3% or $6.0/MT to $1914.0/MT.
In the Asian session, at GMT0300, the pair is trading at 0.7613, with the AUD trading 0.09% higher against the USD from yesterday's close, after Australia's NAB business conditions index advanced to a level of 15.0 in June, notching its highest level in nearly ten years, reflecting growing optimism amongst
businesses about the nation's growth prospects. In the preceding month, the index had recorded a revised reading of 11.0.
Additionally, the nation's NAB business confidence index edged up to a level of 9.0 in June, compared to a revised reading of 8.0 in the previous month. Meanwhile, the nation's seasonally adjusted home loan approvals rebounded less-than-expected by 1.0% in May, compared to a fall of 1.9% in the prior month.
The pair is expected to find support at 0.7595, and a fall through could take it to the next support level of 0.7577. The pair is expected to find its first resistance at 0.7623, and a rise through could take it to the next resistance level of 0.7633.
Moving ahead, investors will focus on Australia's Westpac consumer confidence index for July, slated to release overnight.
The currency pair is trading above its 20 Hr and 50 Hr moving averages.

Euro-Zone’s Investor Confidence Moderated In July
For the 24 hours to 23:00 GMT, the EUR declined 0.11% against the USD and closed at 1.1396.
Macroeconomic data showed that the Euro-zone's Sentix investor confidence index fell less-than-expected to a level of 28.3 in July, after hitting a 10-year high level of 28.4 in the prior month, while market participants had anticipated a fall to a level of 28.1.
Separately, Germany's seasonally adjusted trade surplus widened more-than-expected to a level of €22.0 billion in May, as growth in exports outpaced that of imports, thus reaffirming a solid upswing in the Euro-zone's largest economy. In the prior month, the nation had registered a trade surplus of €18.1 billion, while markets were expecting the country's surplus to rise to a level of €18.7 billion.
In economic news, the US labour market conditions index declined more-than-expected to a level of 1.5 in June, compared to market expectations for a drop to a level of 2.5 and following a revised reading of 3.3 in the preceding month. On the other hand, the nation's consumer credit jumped to a level of $18.4 billion in May, hitting its highest level in six months and compared to a revised advance of $12.9 billion in the previous month. Market participants were anticipating consumer credit to advance to a level of $13.5 billion.
In the Asian session, at GMT0300, the pair is trading at 1.1393, with the EUR trading a tad lower against the USD from yesterday's close.
The pair is expected to find support at 1.1377, and a fall through could take it to the next support level of 1.1362. The pair is expected to find its first resistance at 1.1413, and a rise through could take it to the next resistance level of 1.1434.
In absence of any major economic releases in the Euro-zone today, investors will look forward to the US NFIB small business optimism index for June followed by JOLTS job openings and final wholesale inventories, both for May, slated to release later in the day.
The currency pair is showing convergence with its 20 Hr moving average and trading below its 50 Hr moving average.

Pound Trading A Tad Lower In The Morning Session
For the 24 hours to 23:00 GMT, the GBP declined 0.15% against the USD and closed at 1.2879.
In the Asian session, at GMT0300, the pair is trading at 1.2875, with the GBP trading slightly lower against the USD from yesterday's close.
Overnight data revealed that Britain's BRC retail sales across all sectors rebounded 1.2% on an annual basis in June, surpassing market expectations for a rise of 0.8% and following a decline of 0.4% in the previous month.
The pair is expected to find support at 1.2851, and a fall through could take it to the next support level of 1.2826. The pair is expected to find its first resistance at 1.2904, and a rise through could take it to the next resistance level of 1.2932.
With no major economic releases in the UK today, investor sentiment will be governed by global macroeconomic news.
The currency pair is showing convergence with its 20 Hr moving average and trading below its 50 Hr moving average.

Japan’s Eco-Watchers Survey For The Current Situation Hit A 6-Month High In June
For the 24 hours to 23:00 GMT, the USD declined 0.1% against the JPY and closed at 114.06.
Yesterday, the Bank of Japan (BoJ) Governor, Haruhiko Kuroda, reiterated the central bank's pledge to keep Japanese government bond yields fixed near zero until inflation rises above its 2.0% target in a sustainable manner.
On the data front, Japan's Eco-Watchers Survey for the current situation rose more-than-anticipated to a level of 50.0 in June, notching its highest level in 6 months and compared to market expectations of a rise to a level of 49.0. In the previous month, the index had registered a reading of 48.6. Moreover, the nation's Eco-Watchers Survey for the future outlook climbed more-than-expected to a level of 50.5 in June, following a reading of 49.6 in the prior month.
In the Asian session, at GMT0300, the pair is trading at 114.20, with the USD trading 0.12% higher against the JPY from yesterday's close.
The pair is expected to find support at 114.03, and a fall through could take it to the next support level of 113.85. The pair is expected to find its first resistance at 114.34, and a rise through could take it to the next resistance level of 114.47.
Looking ahead, traders will keep a close watch on Japan's flash machine tool orders for June, slated to release in a while.
The currency pair is showing convergence with its 20 Hr moving average and trading above its 50 Hr moving average.

Swiss Franc Trading On A Weaker Footing This Morning
For the 24 hours to 23:00 GMT, the USD rose 0.23% against the CHF and closed at 0.9660.
In economic news, Swiss total sight deposits stood at CHF578.7 billion in the week ended 07 July, compared to a level of CHF578.6 billion in the previous week.
In the Asian session, at GMT0300, the pair is trading at 0.9666, with the USD trading 0.06% higher against the CHF from yesterday’s close.
The pair is expected to find support at 0.9639, and a fall through could take it to the next support level of 0.9612. The pair is expected to find its first resistance at 0.9684, and a rise through could take it to the next resistance level of 0.9702.
The currency pair is showing convergence with its 20 Hr moving average and trading above its 50 Hr moving average.

Loonie Trading Marginally Lower, Ahead Of Canada’s Housing Starts Data
For the 24 hours to 23:00 GMT, the USD rose 0.11% against the CAD and closed at 1.2891.
In the Asian session, at GMT0300, the pair is trading at 1.2893, with the USD trading slightly higher against the CAD from yesterday's close.
The pair is expected to find support at 1.2865, and a fall through could take it to the next support level of 1.2837. The pair is expected to find its first resistance at 1.2927, and a rise through could take it to the next resistance level of 1.2961.
Ahead in the day, market participants will await the release of Canada's housing starts data for June.
The currency pair is showing convergence with its 20 Hr moving average and trading below its 50 Hr moving average.

Daily Technical Analysis: EUR/USD, GBP/USD Approaching Confirmation Or Invalidation Zone Of Wave-4
Currency pair EUR/USD
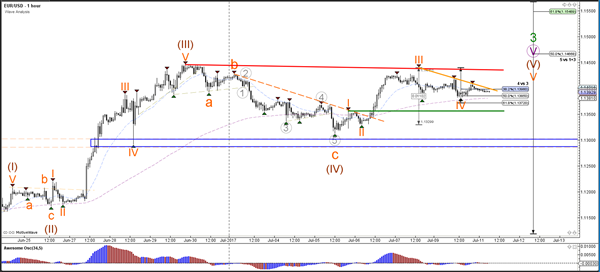
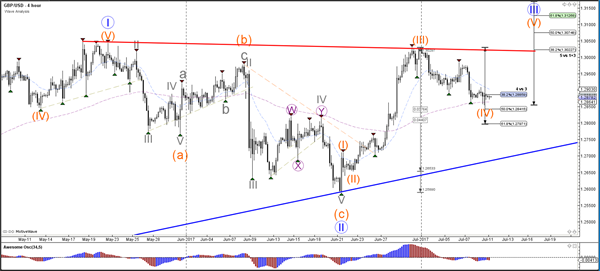
The EUR/USD is moving sideways after failing to break above the previous top (red). A bullish breakout could however restart the uptrend towards the Fibonacci targets of wave 5 vs 1+3 and the round level of 1.15.
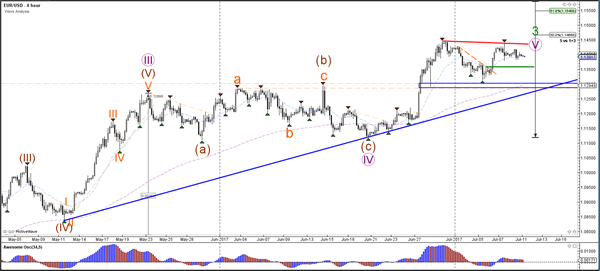
The EUR/USD expanded the wave 4 (orange) correction back to the 50% Fibonacci level. The wave 4 (orange) becomes unlikely if price breaks below the 61.8% Fibonacci level.
Currency pair USD/JPY
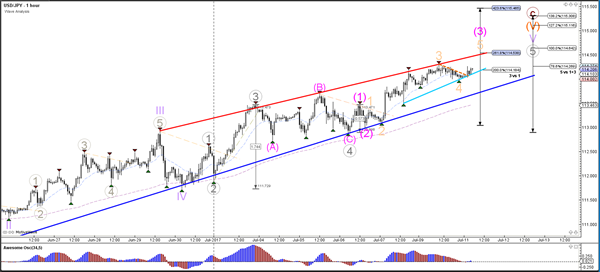
The USD/JPY is moving higher in a neat bullish trend channel towards the Fibonacci targets of wave 5 vs 1+3. Price could extend the uptrend towards the Fibonacci levels of wave X vs W.
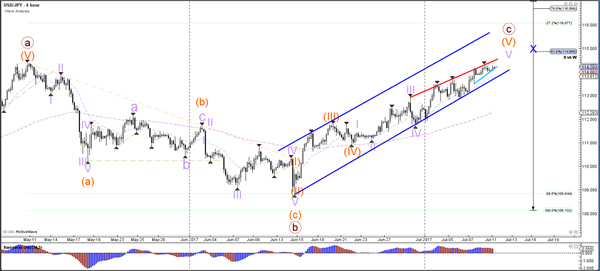
The USD/JPY retraced back to a support trend line (blue) within a wave 4 (light orange) correction within wave 3 (pink). Price could now be in a wave 5 moving towards the Fib targets at 114.50 and 115.
Currency pair GBP/USD
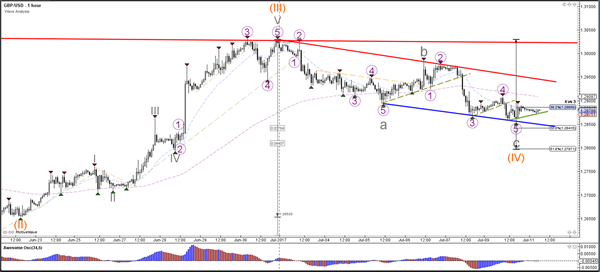
The GBP/USD retraced to deeper Fibonacci support levels of wave 4 vs 3 (orange). A bullish bounce could confirm the wave 4-5 (orange).
The GBP/USD seems to have completed an C (grey) bearish zigzag within wave 4 (orange). A break below the 61.8% makes a wave 4 structure less likely.
Daily Technical Outlook And Review: EUR/USD, GBP/USD, AUD/USD, USD/JPY, USD/CAD, USD/CHF, DOW 30, GOLD
A note on lower timeframe confirming price action...
Waiting for lower timeframe confirmation is our main tool to confirm strength within higher timeframe zones, and has really been the key to our trading success. It takes a little time to understand the subtle nuances, however, as each trade is never the same, but once you master the rhythm so to speak, you will be saved from countless unnecessary losing trades. The following is a list of what we look for:
- A break/retest of supply or demand dependent on which way you're trading.
- A trendline break/retest.
- Buying/selling tails ... essentially we look for a cluster of very obvious spikes off of lower timeframe support and resistance levels within the higher timeframe zone.
- Candlestick patterns. We tend to only stick with pin bars and engulfing bars as these have proven to be the most effective.
We typically search for lower-timeframe confirmation between the M15 and H1 timeframes, since most of our higher-timeframe areas begin with the H4. Stops are usually placed 1-3 pips beyond confirming structures.
EUR/USD
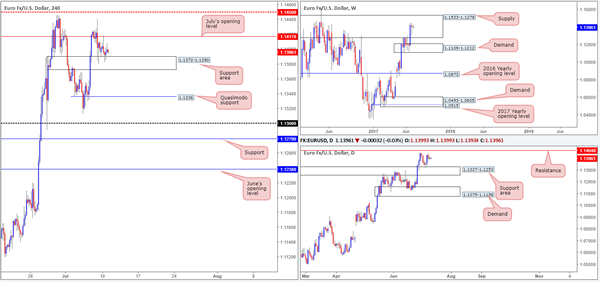
The EUR/USD took on more of a sober tone during Monday's sessions, ranging between July's opening level at 1.1417 and a H4 support area based at 1.1372-1.1390. Should the unit violate 1.1417 today, the next hurdle in the firing range is likely to be the H4 mid-level resistance 1.1450. A break below the current H4 support area on the other hand would likely open the gates down to the H4 Quasimodo support at 1.1336.
Moving over to the bigger picture, weekly flow remains loitering within the walls of a major supply zone drawn from 1.1533-1.1278 that has capped upside since May 2015. On the daily timeframe, however, we currently see a resistance level pegged at 1.1464 and a daily support area coming in at 1.1327-1.1253.
With weekly candles trading within such a respected supply zone at the moment, a break below the current H4 support base would not surprise us. This, according to both the daily and H4 timeframes, could open up a small gap south for a potential trade as beyond the H4 support area we have the aforementioned Quasimodo support to target, followed closely by the top edge of the daily support area at 1.1327 and then the 1.13 handle.
Our suggestions: Watch for a decisive break below the H4 support area at 1.1372-1.1390 and then look to trade any retest seen thereafter. Ideally, we would like to see a reasonably sized H4 bearish candle take shape (preferably a full-bodied candle) following the retest, as this will, in our opinion, suggest seller intent.
Data points to consider: FOMC member Brainard speaks at 5.30pm GMT+1.
Levels to watch/live orders:
- Buys: Flat (stop loss: N/A).
- Sells: Watch for H4 price to engulf 1.1372-1.1390 and then look to trade any retest seen thereafter ([waiting for a H4 bear candle – preferably a full, or near full-bodied candle – to form following the retest is advised] stop loss: ideally beyond the candle's wick).
GBP/USD
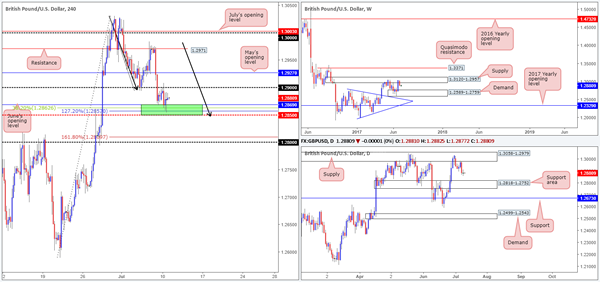
Coming at you from the top this morning, weekly supply at 1.3120-1.2957, as you can see, is currently holding this market lower. In the event that this continues, the next downside target can be seen at a demand base drawn from 1.2589-1.2759. Sliding down to the daily timeframe, we can see that supply at 1.3058-1.2979 (positioned within the weekly supply area) held price lower last week which could eventually send the unit down to a support area chiseled in at 1.2818-1.2752.
Despite both the weekly and daily timeframes suggesting further downside may be upon us this week, the H4 is currently seen trading from a rather interesting area of support marked in green at 1.2850-1.2869. The zone is comprised of June's opening level at 1.2869, a 38.2% Fib support level at 1.2862, a AB=CD 127.2% ext. at 1.2857 and a mid-level support line at 1.2850.
Our suggestions: While the H4 confluence surrounding 1.2850-1.2869 is tempting to buy, there's just too much higher-timeframe structure positioned against this area for us to justify a trade, unfortunately. In addition to this, we do not like how the 1.29 handle held so well on Monday – just look at the strength of the bears upon connecting with this psychological level!
With the above points in mind, our attention is drawn to the 1.28 handle seen below, which happens to converge with the 161.8% ext. point at 1.2809 (from the AB=CD pattern mentioned above) and is lodged within the said daily support area!
Data points to consider: MPC Member Broadbent speaks at 12.00pm. FOMC member Brainard speaks at 5.30pm GMT+1.
Levels to watch/live orders:
- Buys: Currently watching the 1.28 neighborhood for a potential long opportunity. To trade from here we would highly recommend waiting for at least a H4 bullish candle to form, preferably a full-bodied candle, before pulling the trigger.
- Sells: Flat (stop loss: N/A).
AUD/USD
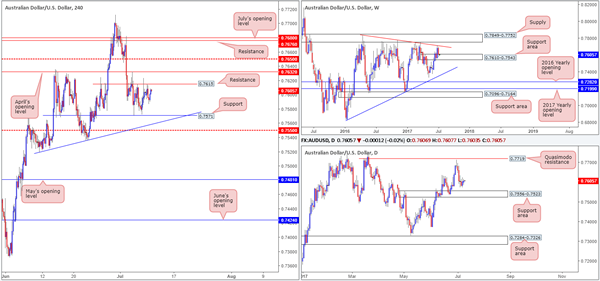
Over the last week or so, the H4 candles have been chiseling out a consolidation between resistance at 0.7615 and support located at 0.7571. According to the weekly timeframe, the commodity currency could be heading higher sometime soon given that weekly price recently connected with a support area carved from 0.7610-0.7543. There are, however, two cautionary points to bear in mind regarding this theory. Firstly, the daily chart shows space for price to continue pushing lower until we reach the support area formed at 0.7556-0.7523, which happens to be glued around the lower edge of the current weekly support area. Secondly, even if weekly price does force the pair north, we have a multiple H4 resistances planted beyond the current H4 resistance, thus making it a difficult buy!
Our suggestions: With the above points in mind, the only level of interest that we believe deserves attention is the H4 mid-level support at 0.7550. Not only does it converge with a H4 trendline support etched from the low 0.7519, it is also located within both of the above said weekly and daily support areas.
Should we spot H4 bulls coming into the picture from the 0.7550 vicinity today in the shape of a (preferably) full-bodied bull candle, we would have no hesitation in buying this market, with the hope that price breaks back into the current H4 range.
Data points to consider: FOMC member Brainard speaks at 5.30pm GMT+1.
Levels to watch/live orders:
- Buys: 0.7550 region ([waiting for a H4 bull candle – preferably a full, or near full-bodied candle – to form is advised] stop loss: ideally beyond the candle's tail).
- Sells: Flat (stop loss: N/A).
USD/JPY
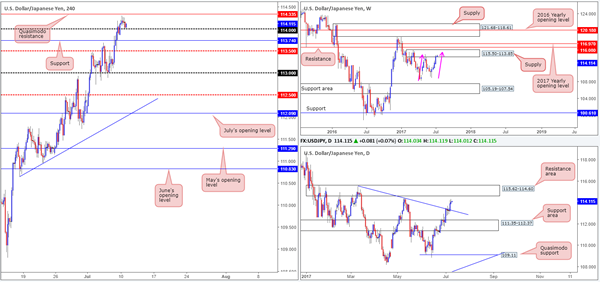
Although USD/JPY bulls look incredibly strong at the moment, there may be trouble lurking ahead! Weekly price recently entered supply coming in at 115.50-113.85. Assuming that price continues to push higher, nevertheless, it could also form a possible AB=CD correction completing around 115 (see pink arrows). The story on the daily timeframe shows price also trading within striking distance of a resistance area at 115.62-114.60, which happens to be positioned nearby the aforementioned weekly AB=CD completion point!
Meanwhile, over on the H4 timeframe, the 114 handle is currently offering the market a level of support. With the next upside target coming in at 114.35 (Quasimodo resistance), however, the bulls may struggle from here.
Our suggestions: On account of the above, our desk is firmly biased to the downside right now. Nevertheless, we will wait for daily price to at least shake hands with the aforementioned resistance area before looking to sell this market, as ideally we want to short the 115 handle and place stops just above the daily zone at 115.64, thus clearing both the daily resistance area and the current weekly supply.
Data points to consider: FOMC member Brainard speaks at 5.30pm GMT+1.
Levels to watch/live orders:
- Buys: Flat (stop loss: N/A).
- Sells: Currently have our eye on the 115 neighborhood for shorts.
USD/CAD
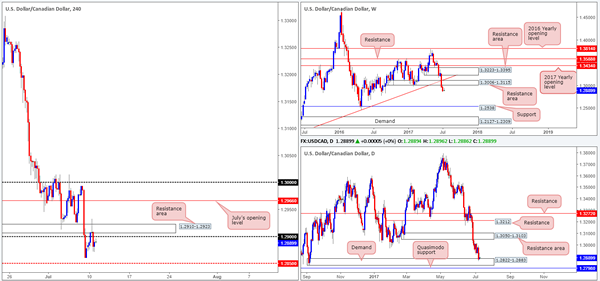
From the weekly timeframe, the USD/CAD appears to reflect an incredibly bearish market at present. After breaching the support area at 1.3006-1.3115, which is now a resistance area, the unit shows space to trade all the way down to support coming in at 1.2538. Interestingly though, on the daily timeframe we see the candles challenging a demand base pegged at 1.2822-1.2883. Also noteworthy is yesterday's inverted pin-bar candle, which according to conventional wisdom, is considered a buy signal.
Across on the H4 timeframe, however, the resistance area at 1.2910-1.2923 held firm during yesterday's segment, forcing the candles to trade back below the 1.29 handle. Should the bears remain on the offensive here, we could see the loonie attack the mid-level support at 1.2850.
Our suggestions: In essence, what we have here is the weekly timeframe telling us that the sellers show potential, while conversely, the daily timeframe shows that the bulls may make an appearance this week as well as the H4 candles trading bearishly below a psychological band. Personally speaking, this market is not something we would look to trade, especially with the higher-timeframe conflicting signals being seen.
Data points to consider: FOMC member Brainard speaks at 5.30pm. Canadian Housing starts at 1.15pm GMT+1.
Levels to watch/live orders:
- Buys: Flat (Stop loss: N/A).
- Sells: Flat (Stop loss: N/A).
USD/CHF
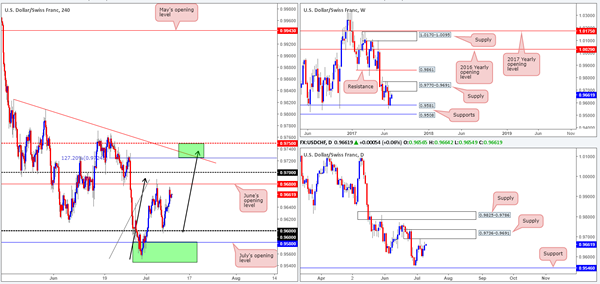
In recent trading, we've seen the H4 candles begin completing a D-leg to an AB=CD formation that finalizes around the 0.9720ish range. Also of particular interest is the converging trendline resistance extended from the high 0.9825 and a mid-level resistance at 0.9750 (upper green area).
What's also notable from a technical perspective is that the upper green H4 zone is positioned within the upper limits of a weekly supply zone seen at 0.9770-0.9691. However, in order to reach the H4 area, the pair would need to breach daily supply at 0.9736-0.9691, which is located around the lower edge of the said weekly supply.
Our suggestions: The desk has come to a general consensus that waiting to see if H4 price can strike the upper green zone before we look to sell is the better path to take. Apart from benefitting from the H4 and weekly confluence, this would also allow traders to place stops ABOVE the weekly supply at 0.9772.
Data points to consider: FOMC member Brainard speaks at 5.30pm GMT+1.
Levels to watch/live orders:
- Buys: Flat (stop loss: N/A).
- Sells: 0.9750/0.9720 (stop loss: 0.9772).
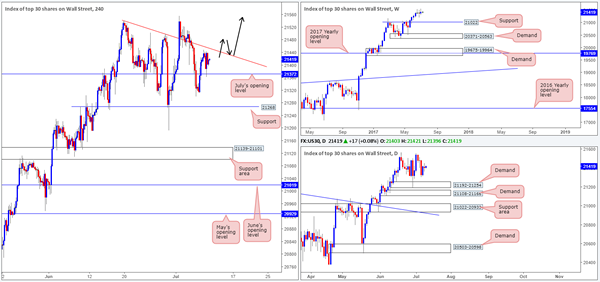
DOW 30
Despite the H4 candles grinding lower at the moment, the US equity market remains trading with a strong upside bias. On the weekly timeframe, there's little stopping the unit from pushing higher. Should the index pullback, however, the support level at 21022 will likely offer a floor to trade from considering that it had a relatively sound history as a resistance.
Ultimately, we're looking for July's opening level at 21372 to continue providing support, and eventually force the candles above the nearby H4 trendline resistance extended from the high 21541. This, for us, would be a cue to begin looking to buy this market.
Our suggestions: Following a decisive close above the current H4 trendline resistance, the desk will be watching for the piece to retest this line as support and print a reasonably sized H4 bull candle, preferably a full, or near full-bodied candle, before looking to pull the trigger (as per the black arrows).
Data points to consider: FOMC member Brainard speaks at 5.30pm GMT+1.
Levels to watch/live orders:
- Buys: Watch for H4 price to close above the current trendline resistance and then look to trade any retest seen thereafter ([waiting for a H4 bull candle – preferably a full, or near full-bodied candle – to form following the retest is advised] stop loss: ideally beyond the candle's tail).
- Sells: Flat (stop loss: N/A).
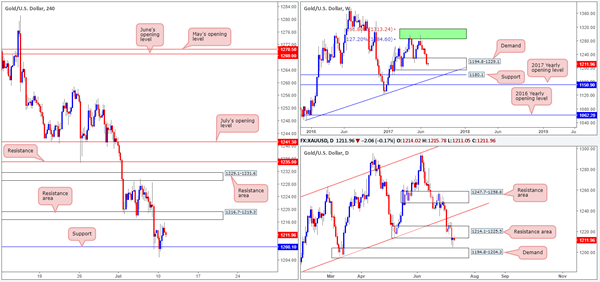
GOLD
Kicking this morning's report off with a look at the weekly timeframe, we can clearly see the buyers and sellers battling for position within a demand zone at 1194.8-1229.1. This demand has held price higher once already back in early May, so there's a solid chance that history may repeat itself here. Punching down to the daily timeframe, Monday's action came within a cat's whisker of connecting with a demand base at 1194.8-1204.3 and printed a nice-looking buying tail. Although this is considered a buy signal by many, the yellow metal is also touching base with the underside of a resistance area at 1214.1-1225.5 as well.
H4 support at 1208.1 remains in a stable state right now and could eventually force the unit to challenge the H4 resistance area at 1216.7-1219.3. Given this, and the above notes, there is clearly conflicting signals evident in this market. Buying from the weekly demand not only places traders up against the current daily resistance area, but also the H4 resistance area seen within, as well.
Our suggestions: Before our team becomes buyers in this market, we would require a decisive H4 close above the said H4 resistance area. That way, we can be somewhat confident that the daily resistance area is weakened and the H4 candles will likely reach the H4 resistance area at 1229.1-1231.6, followed closely by H4 resistance at 1235.0.
Levels to watch/live orders:
- Buys: Watch for H4 price to close above 1216.7-1219.3 and then look to trade any retest of this area seen thereafter ([waiting for a H4 bull candle – preferably a full, or near full-bodied candle – to form following the retest is advised] stop loss: ideally beyond the candle's tail).
- Sells: Flat (stop loss: N/A).
European Open Briefing: Most Major Pairs Consolidated Overnight
Global Markets:
- Asian stock markets: Nikkei up 0.40 %, Shanghai Composite gained 0.90 %, Hang Seng rose 1 %, ASX 200 lost 0.10 %
- Commodities: Gold at $1211 (-0.10%), Silver at $15.57 (-0.40%), WTI Oil at $44.50 (0.45%), Brent Oil at $47.10 (0.45%)
- Rates: US 10 year yield at 2.38, UK 10 year yield at 1.28, German 10 year yield at 0.54
News & Data:
- Australia NAB Business Confidence Jun: 9 (Rev Prev 8)
- Australia NAB Business Conditions Jun: 12 (Rev Prev 11)
- Japan Money Stock M2 (Y/Y) Jun: 3.90% (Est 3.90%, Prev 3.90%)
- Japan Money Stock M3 (Y/Y) Jun: 3.30% (Est 3.40%, Prev 3.40%)
- PBoC Fixes USDCNY Reference Rate At 6.7983 (Prev 6.7964)
- Fed's Williams: His Own View Is To Start Adjustment Of Balance Sheet In Next Few Months
- Fed's Williams: Reasonable Vie To Expect One More Rate Hike This Year
Markets Update:
Most major pairs consolidated overnight, amid a lack of major data releases and events. USDJPY is struggling with resistance at 114.30. However, the outlook for the Yen is negative, so further gains seem likely in the near-term. The next notable resistance lies at 115, followed by 115.50.
The Euro continues to consolidate around 1.14. It has lost some momentum, but is not showing any signs of weakness yet. Key resistance is noted at 1.1450. A break above would signal a rally to at least 1.16. In the short-term, the outlook for the Euro remains positive both from a fundamental and technical perspective.
AUDUSD has recovered slightly, although resistance at 0.7630 has capped the topside so far. Should it break above it, the rally would likely extend to 0.77.
Markets should remain rather quiet today amid few important data releases. However, volatility will increase tomorrow. Especially in CAD pairs as the Bank of Canada is deciding on interest rates.
Upcoming Events:
- 09:00 BST – Italian Industrial Production
- 15:00 BST – US JOLTs Job Openings