Sample Category Title
Forex Technical Analysis: EUR/USD, USD/JPY, GBP/USD
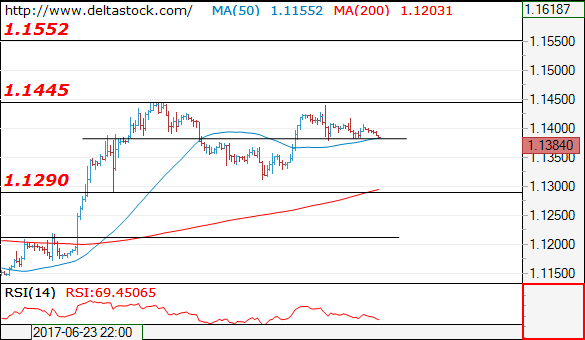
EUR/USD
Current level - 1.1384
Yesterday's tight trading range signals a bearish bias, for a break through 1.1380 and slide towards 1.1290+ area. The mentioned dip should be the final leg of the consolidation pattern below 1.1445, before upmove towards 1.1550.
| Resistance | Support | ||
| intraday | intraweek | intraday | intraweek |
| 1.1445 | 1.1550 | 1.1380 | 1.1020 |
| 1.1550 | 1.1610 | 1.1290 | 1.0838 |
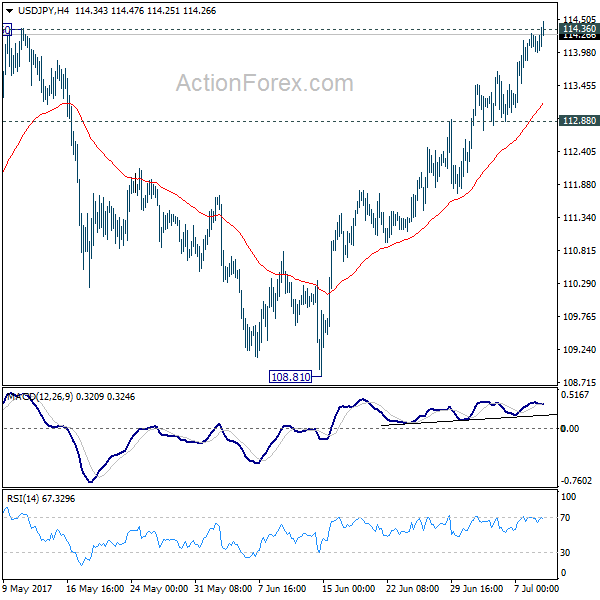
USD/JPY
Current level - 114.38
My outlook remains bullish, for a rise towards 115.50 area. Key intraday support lies at 114.00, followed by the major one at 113.50.
| Resistance | Support | ||
| intraday | intraweek | intraday | intraweek |
| 114.50 | 115.50 | 114.00 | 112.60 |
| 115.40 | 115.50 | 113.50 | 108.81 |
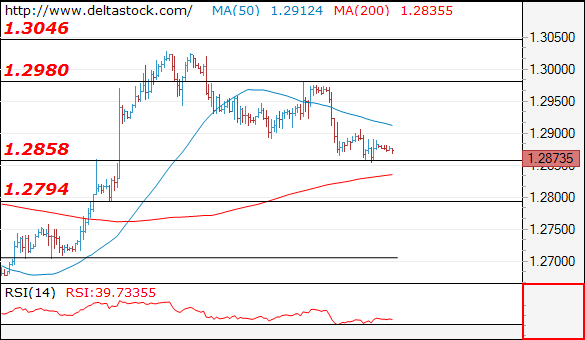
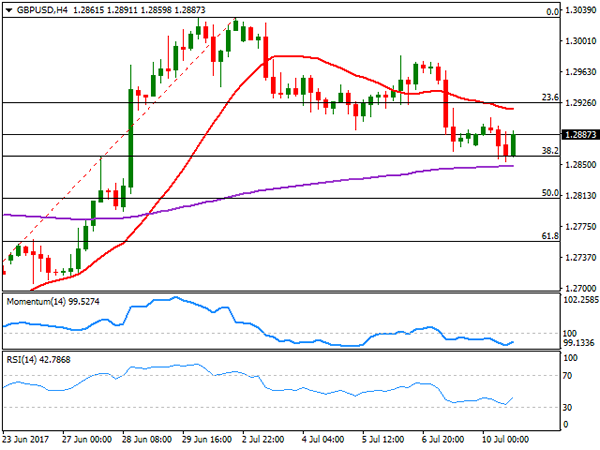
GBP/USD
Current level - 1.2873
My outlook is bearish below 1.2900, for a violation of 1.2860, towards 1.2790 area. Crucial on the upside is 1.2980.
| Resistance | Support | ||
| intraday | intraweek | intraday | intraweek |
| 1.2900 | 1.3130 | 1.2860 | 1.2635 |
| 1.2980 | 1.3500 | 1.2790 | 1.2480 |
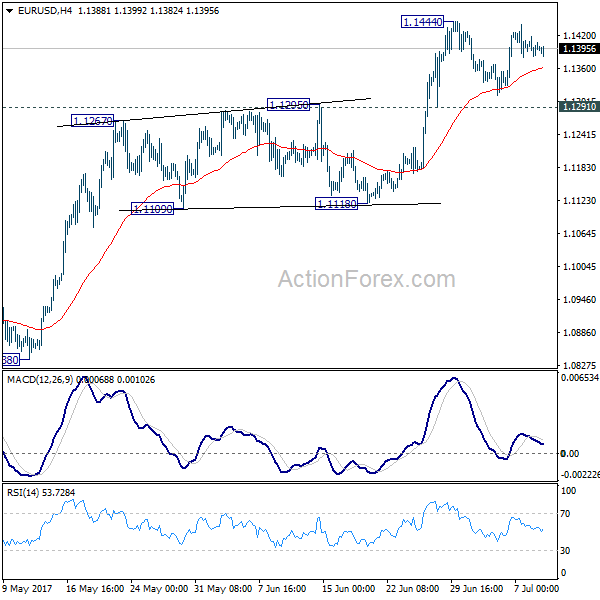
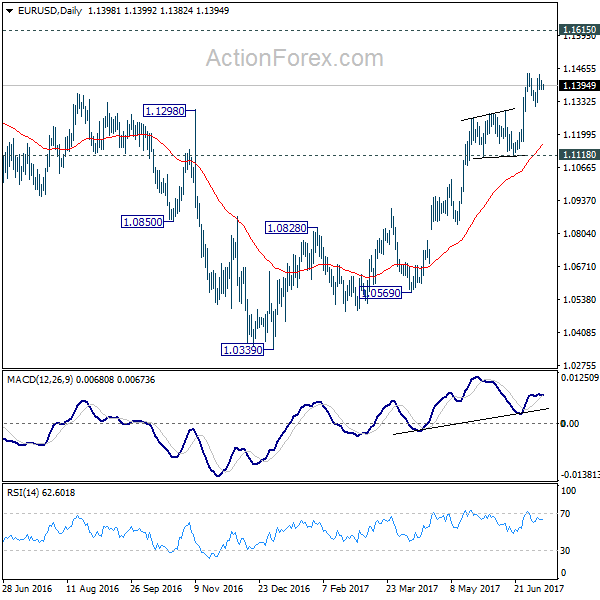
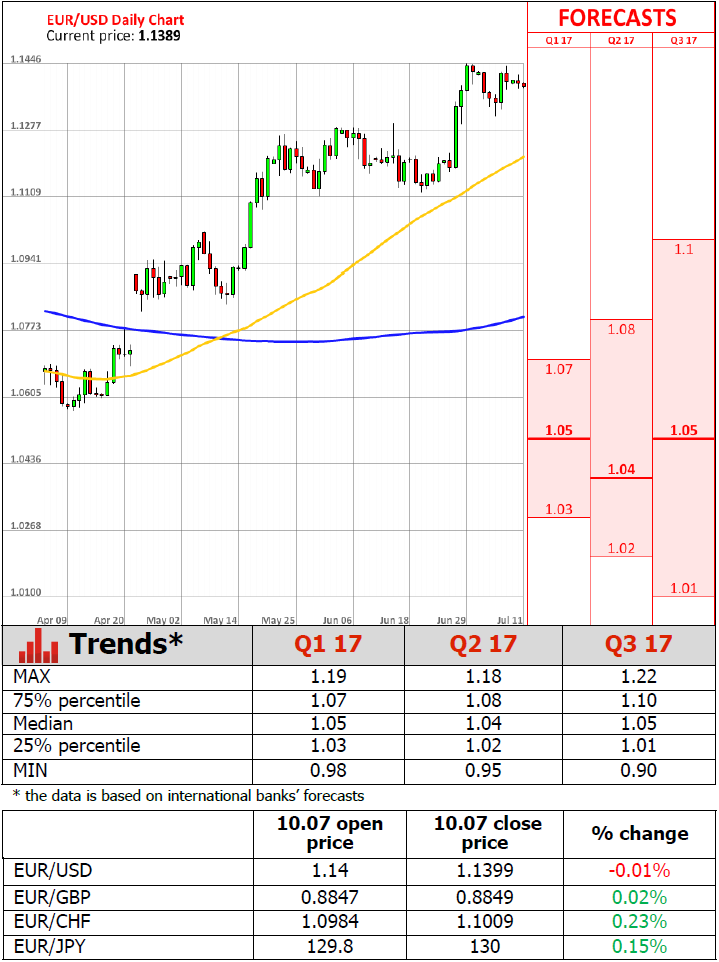
EUR/USD Daily Outlook
Daily Pivots: (S1) 1.1380; (P) 1.1399 (R1) 1.1417; More.....
EUR/USD's consolidation from 1.1444 is still in progress and intraday bias remains neutral. In case of another fall, downside should be contained by 1.1291 resistance turned support to bring rise resumption. Break of 1.1444 will extend the rally from 1.0339 low to 1.1615 resistance next. Meanwhile, break of 1.1291 will turn focus back to 1.1118 support instead.
In the bigger picture, the firm break of 1.1298 resistance further affirm medium term reversal. That is an important bottom was formed at 1.0339 on bullish convergence condition in weekly MACD. Further rise would be seen to 55 month EMA (now at 1.1763). Sustained break there will pave the way to 38.2% retracement of 1.6039 (2008 high) to 1.0339 (2017 low) at 1.2516 next. This will now remain the favored case as long as 1.1118 support holds.
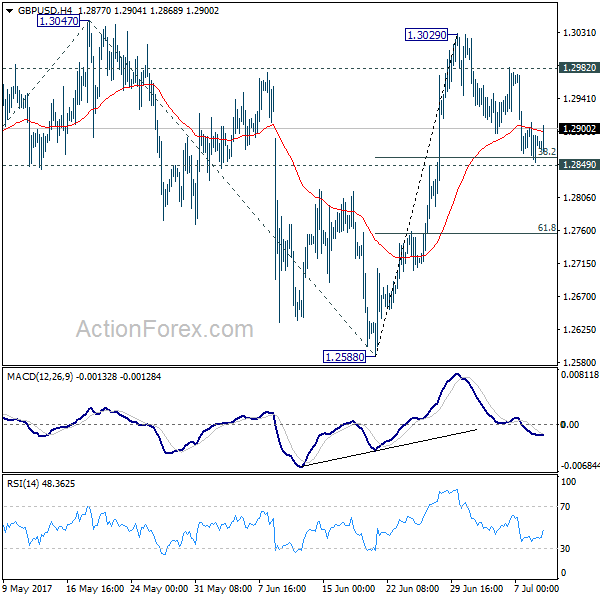
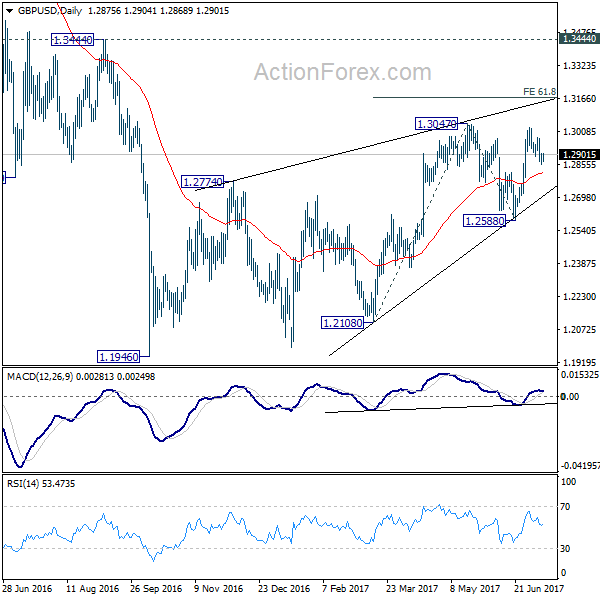
GBP/USD Daily Outlook
Daily Pivots: (S1) 1.2853; (P) 1.2881; (R1) 1.2907; More...
Intraday bias in GBP/USD remains neutral as consolidation from 1.3029 continues. Downside is expected to be contained by 1.2849 support to bring rise resumption. Above 1.2982 minor resistance should turn bias back to the upside for 1.3047 resistance. Break will target 61.8% projection of 1.2108 to 1.3047 from 1.2588 at 1.3168 next. However, sustained break of 1.2849 will dampen our near term bullish view and turn focus back to 1.2588 support.
In the bigger picture, overall, price actions from 1.1946 medium term low are seen as a corrective pattern that is still in progress. While further upside is now in favor, overall outlook remains bearish as long as 1.3444 key resistance holds. Larger down trend from 1.7190 is expected to resume later after the correction completes. And break of 1.2588 will indicate that such down trend is resuming.
Investors’ Sentiment For Euro Zone Remains Positive
'For a few months now, it has been clear to investors that the ECB must leave its expansive course. This expectation has intensified for investors over the past few weeks.' - Sentix
Euro zone Sentix economic sentiment remained close to the ten-year high, a private survey showed on Monday. The Sentix Investor Confidence Index dropped 0.1 point to 28.3 in June, following a reading of 28.4 in the preceding month and beating forecasts for a decline to 28.1. In the last few days, market activity was determined by investors' fears over interest rate policy changes in the EU. With a strongly improved economic momentum in the Euro zone, investors' assessment of the current situation increased for the seventh consecutive time, reaching 37.3 points, the highest level in nearly 10 years. Though, the Sentix Economic Index for expectations was in the range between 19.8 and 21.0 points, staying confidently positive, as investors anticipated that the current trends would continue, with the economic growth eventually reaching its peak. Apart from that, the survey showed that investors' sentiment on the central bank's impact on the European bond market was pessimistic amid expectations for the bonds to be hit in the next months, as the ECB starts moving closer to monetary policy tightening.
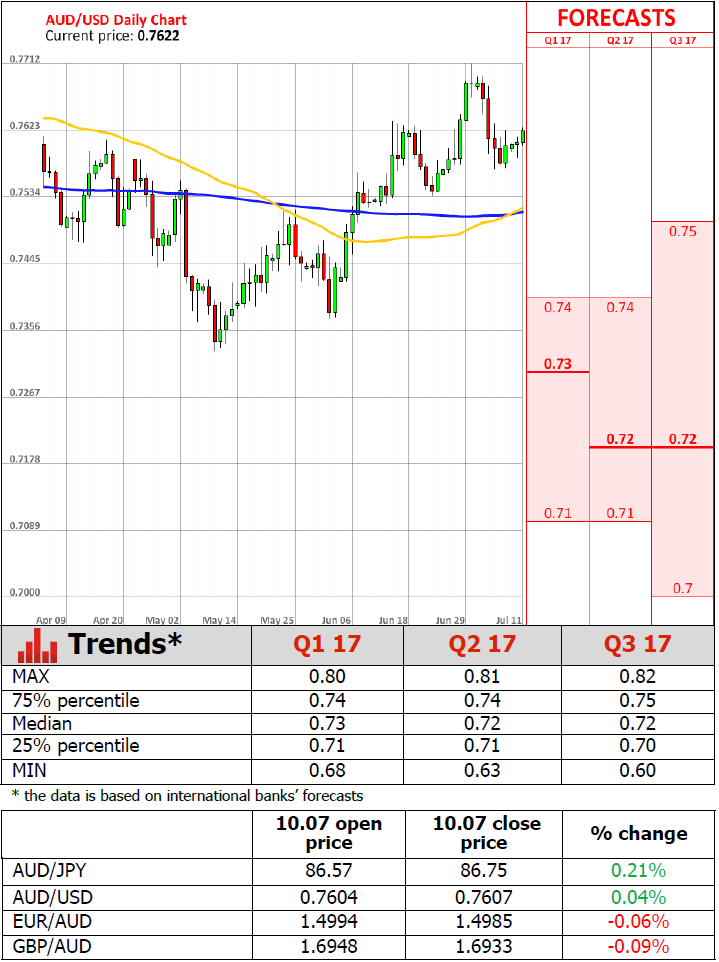
Australian Business Conditions Around Pre-GFC Highs, Confidence Improves
'We continue to be pleasantly surprised by just how upbeat the business sector is, given the context of a fairly beleaguered household sector that has been weighed down by limited wages growth and record levels of debt.' - Alan Oster, NAB
The measure of business conditions in Australia jumped to its multi-year highs, nearing pre-crisis levels, as most of industries performed well, reporting higher sales and increases in profits. According to the National Australia Bank's business survey, the Index of business conditions jumped to 15 points in June from the previous month's 11 points, still far above the long-term average of 5 points. An increase was fuelled by strong gains in construction, wholesale and manufacturing conditions, while employment conditions remained flat, but provided enough momentum to diminish the unemployment rate in the coming months. There was a 10-point drop in mining sector, as it reflected negative movements in commodity prices. In the meantime, the Business Confidence Index rose just 1 point to 9 during the reported month, lagging behind conditions measure, while the Bank kept expecting such trend to continue. Overall, some risks to Australia's economic perspective remained on the table, as important growth contributors such as housing construction, gas exports and commodity prices started to weaken.
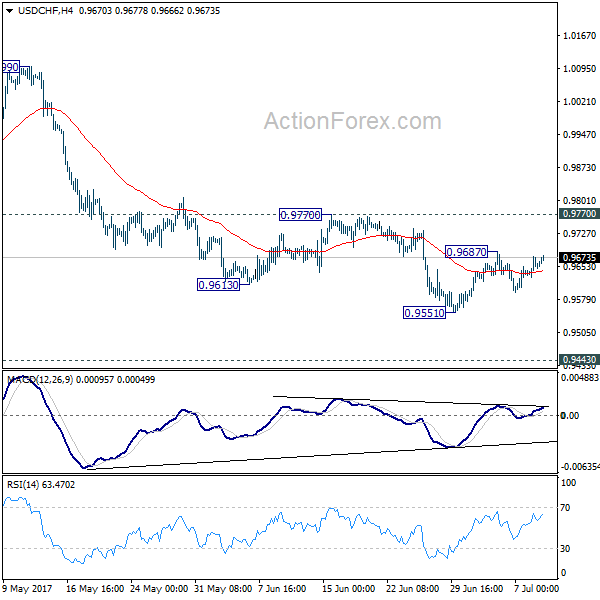
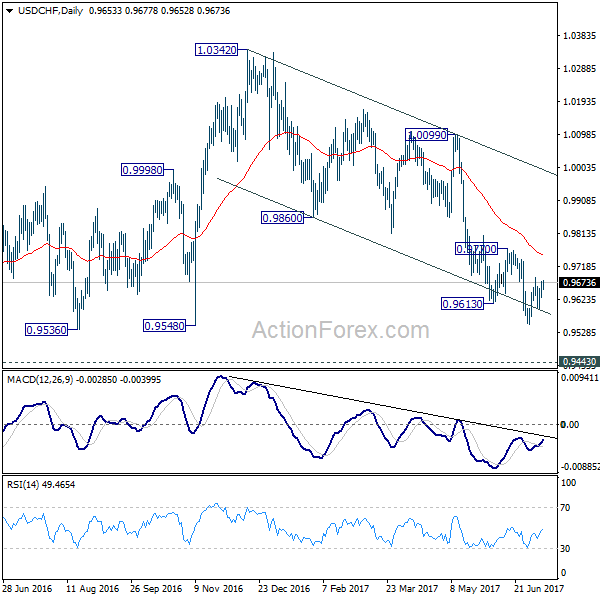
USD/CHF Daily Outlook
Daily Pivots: (S1) 0.9632; (P) 0.9653; (R1) 0.9677; More......
USD/CHF recovers mildly today as consolidation from 0.9551 is still in progress. In case of further rise, upside should be limited by 0.9770 resistance and bring fall resumption. Break of 0.9551 will extend the whole fall from 1.0342 and target 0.9443 key support level next. We'd expect strong support from there to bring rebound. Meanwhile, firm break of 0.9770 will indicate near term reversal, on bullish convergence condition in 4 hour MACD.
In the bigger picture, USD/CHF is still bounded in medium term range of 0.9443/1.0342 for the moment. Consolidative trading would likely continue and medium term outlook remains neutral. Break of 1.0342 key resistance is needed to confirm underlying bullish momentum in the pair. Meanwhile, downside attempts should be contained by 0.9443 key support level. However, sustained break of 0.9443 will carry larger bearish implication and target 0.9 handle.
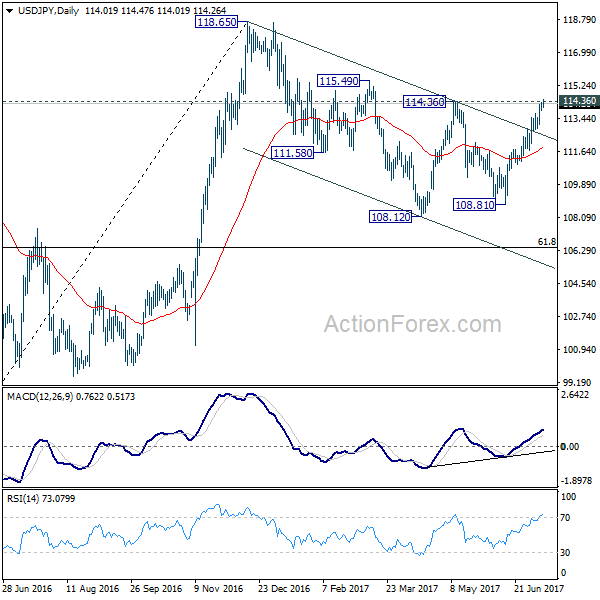
USD/JPY Daily Outlook
Daily Pivots: (S1) 113.83; (P) 114.06; (R1) 114.26; More...
USD/JPY's rally is still in progress and intraday bias remains on the upside. Decisive break of 114.36 resistance will confirm our bullish view that corrective pull back from 118.65 has completed at 108.12. In that case, further rally would be seen to retest 118.65. On the downside, break of 112.88 support is needed to indicate short term topping. Otherwise, outlook will remain bullish in case of retreat.
In the bigger picture, the corrective structure of the fall from 118.65 suggests that rise from 98.97 is not completed yet. Break of 118.65 will target a test on 125.85 high. At this point, it's uncertain whether rise from 98.97 is resuming the long term up trend from 75.56, or it's a leg in the consolidation from 125.85. Hence, we'll be cautious on topping as it approaches 125.85.
Foreign Exchange Market Commentary: EUR/USD, USD/JPY, GBP/USD, GOLD, WTI CRUDE, DJIA, FTSE100, DAX
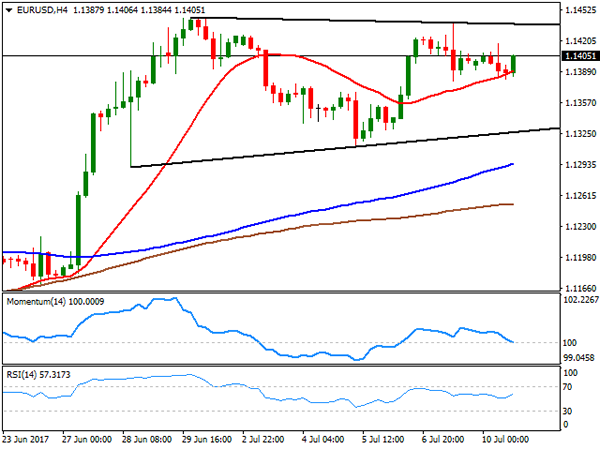
EUR/USD
The EUR/USD pair closed the day pretty much unchanged, a couple of pips above the 1.1400 level, with a quiet macroeconomic calendar keeping major pairs within limited intraday ranges, ahead of bigger events that will take place later this week. Minor figures released in Europe reaffirm healthy economic growth in the region, as German's May seasonally-adjusted trade surplus rose to €20.3bn, from €19.7bn in April, with exports and imports more than doubling expectations in the same month. For the whole EU area, the Sentix investor confidence index for July resulted at 28.3, slightly below the expected and previous 28.4. In the US, the June labor market conditions index rose 1.5%, below previous 2.3% and the expected 2.3%, up for 13th consecutive month. Despite Tuesday's macroeconomic calendar will be quite busy, there's no first-tier data scheduled until next Wednesday, when the UK will release its latest employment figures, and Fed's Yellen will testify before the US Congress.
Technically, the pair continues consolidating near this year high, although having retreated for the 1.1440 region where it topped the last two weeks, with investors rushing to take profits on approaches to the 1.1460 area, as the pair has remained below this last with a couple of short-lived exceptions, since January 2015. The short term technical picture is neutral-to-bullish, as in the 4 hours chart, the price held above a bullish 20 SMA, with the Momentum indicator heading lower around its 100 level and the RSI hovering around its 50 level. Beyond the mentioned 1.1460 resistance, the pair has scope to extend its gains up to 1.1520/30 price zone, while the risk will turn towards the downside only with a break below 1.1290.
Support levels: 1.1380 1.1340 1.1290
Resistance levels: 1.1460 1.1490 1.1525
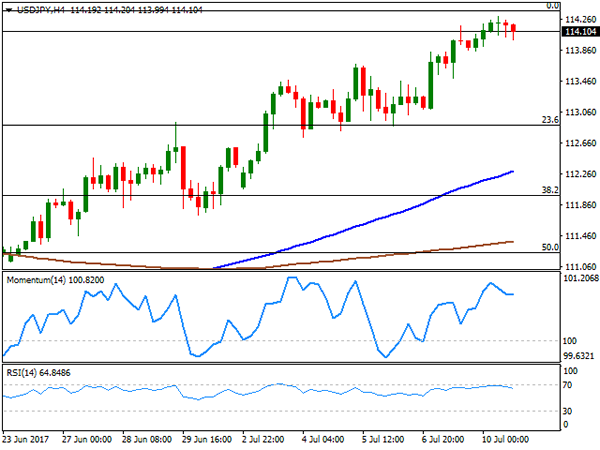
USD/JPY
The USD/JPY pair settled above 114.00 for the first time in almost two months, having traded as high as 114.29 following BOJ's Governor Kuroda dovish stance on monetary policy, as he pledged to maintain the ongoing easing programs as long as needed to achieve a 2% inflation target. JPY losses were limited by retreating Treasury yields, as a couple of ECB's members indicate that there's no rush to retrieve the ongoing QE program in the EU, with Peter Praet saying that "we still need a long period of accommodative policy before we are ready,” triggering a bounce in government bonds. The US 10-year note yield eased to 2.38% from previous 2.39%, still holding near two-month highs and not enough to send the pair lower. Technically, the 4 hours chart shows that technical indicators have retreated modestly from near overbought readings, lacking anyway bearish strength, whilst the price remains well above bullish 100 and 200 SMAs, with the shortest accelerating above the largest. The pair needs to advance beyond 114.40 to be able to extend its gains, up to 115.10 as an initial bullish target.
Support levels: 114.00 113.60 113.10
Resistance levels: 114.40 114.75 115.10
GBP/USD
The GBP/USD pair fell to its lowest in two weeks early London, printing 1.2853 before bouncing, to close the day unchanged at the 1.2880 region. In the news, PM Theresa May called for more cross-party cooperation in pushing though Brexit legislation, getting mocked by Labour Corbyn, who said that if she is running out of ideas, she should read the party's manifesto. May's position as leader of the UK has weakened ever since the election, and her ability to run the kingdom is still in doubt, despite allying with the DUP. The news have not affected the Pound so far, but indeed added to the negative tone of the GBP. In the macroeconomic front, a couple of MPC members will hit the wires on Tuesday, while UK employment data will be released on Wednesday. From the technical point of view, the 4 hours chart shows that the price continues developing below a bearish 20 SMA, this last around 1.2920, while technical indicators have bounced modestly within negative territory, maintaining the risk towards the downside. The same chart shows that the price held above the 38.2% retracement of the latest daily advance at 1.2860, the level to break to confirm additional declines ahead.
Support levels: 1.2860 1.2820 1.2785
Resistance levels: 1.2925 1.2960 1.3000
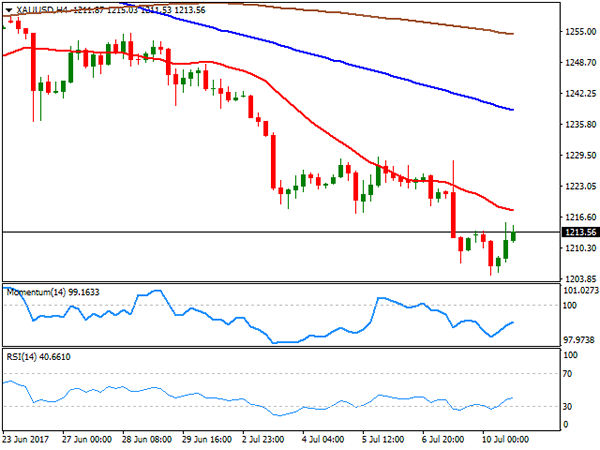
GOLD
Spot gold fell to $1,204.75 a troy ounce, its lowest since mid-March, to close the day barely positive at 1,213.50, helped by the soft tone of the American currency during the US afternoon. Still, the safe-haven commodity has lost market's favor as major central banks' are considering shifting their monetary policies towards tightening. Additionally, the COT report released on Friday showed that speculative interest kept dumping metals for a fourth consecutive week. Technical readings maintain the bearish stance in the daily chart, as the price remained well below all of its moving averages, the Momentum indicator maintaining its downward slope within negative territory, and the RSI indicator holding within oversold levels. Shorter term, the outlook is also bearish according to the 4 hours chart, as a bearish 20 SMA keeps leading the way lower, whilst technical indicators resumed their declines within negative territory after correcting oversold conditions reached earlier on the day.
Support levels: 1,204.75 1,194.95 1,188.20
Resistance levels: 1,222.10 1,228.00 1,236.50
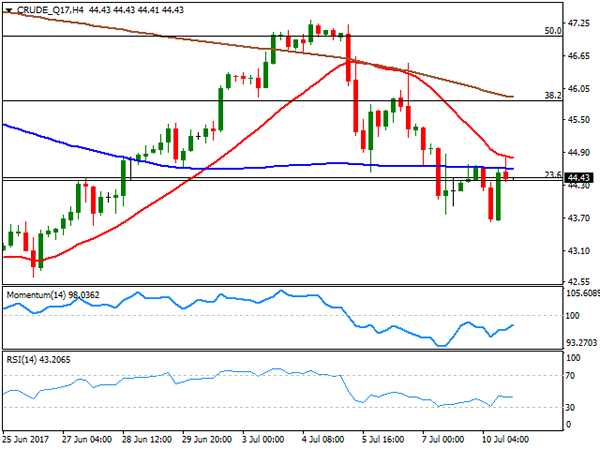
WTI CRUDE OIL
West Texas Intermediate crude oil futures settled at $44.40 a barrel, barely changed intraday, but bouncing from a daily low of 43.64, with news that the OPEC has invited Libya and Nigeria to join a meeting with other major producers later this month, capping the decline. Hopes that the two now exempted countries can join the output cut, however, have not been enough to attract buyers. The daily chart shows that the commodity met selling interest around a flat 20 DMA, while the Momentum indicator have turned modestly lower within positive territory, whilst the RSI indicator continues to lack directional strength below its 50 level, leaning the scale towards the downside. In the 4 hours chart, the upward potential is also limited, as WTI stands below its moving averages, while technical indicators have lost directional strength within negative territory, following a bounce form oversold readings.
Support levels: 43.70 43.10 42.60
Resistance levels: 44.80 45.50 46.10
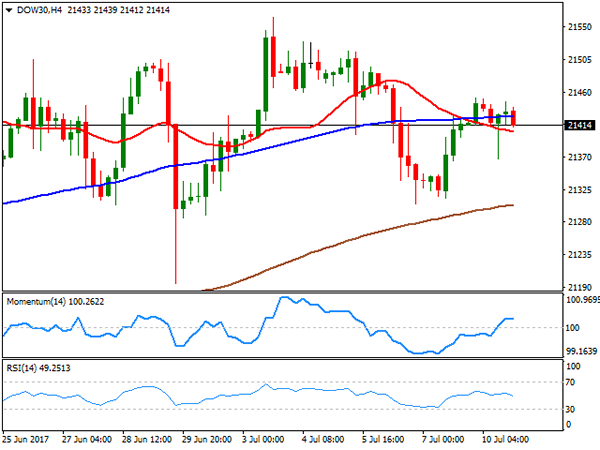
DJIA
Wall Street closed little changed, with the Dow Jones Industrial Average down 6 points, to 21,408.52, and the S&P adding 0.09%, to 2,427.43. The Nasdaq Composite added 23 points or 0.38% and closed at 6,176.39, backed by a bounce in the tech sector. Trading volumes were low as caution prevailed ahead of US inflation readings and Yellen's testimony before the Congress. Within the DJIA, Visa led advancers, adding 1.51%, followed by Nike that closed 1.25% higher. Wal-Mart shed 2.61%, leading losers' list, while Home Depot shed 0.71%, as Best Buy sunk 6%. The index remains neutral daily basis, as it settled around a now horizontal 20 SMA, whilst technical indicators head nowhere around their mid-lines. In the 4 hours chart, the index is stuck between its 20 and 100 SMAs, while technical indicators turned lower, with the RSI indicator at 48, somehow leading the scale towards the downside.
Support levels: 21,366 21,305 21,278
Resistance levels: 21,459 21,515 21,563
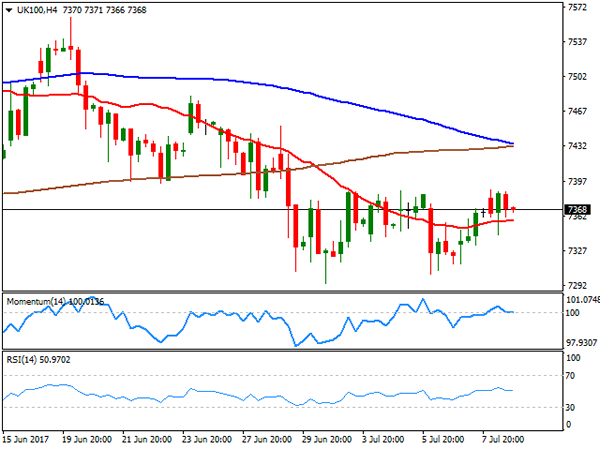
FTSE100
The FTSE 100 ended the day with modest gains at 7,370.02, up 19 points or 0.26%, reverting early losses as the mining-sector edged higher after an early dip, and as the Pound maintained the sour tone. Volumes were along across the region, amid the absence of a fundamental catalyst and as investors wait for earnings reports. The best performer was Schroders, which added 2.15% while big names of the mining sector, including Anglo American, Randgold Resources and Glencore added over 1.0% each. In the losing side, Shire led with a 3.19% decline, followed by Next that ended 1.94% lower. In the daily chart, the index settled right below its 100 DMA, whilst the 20 DMA extended its decline above it, as technical indicators keep hovering within bearish territory, with the RSI flat around 45, which keeps the risk towards the downside. In the shorter term, the pair remains neutral according to the 4 hours chart, having ended the day a few points above a horizontal 20 SMA, and technical indicators heading nowhere around their mid-lines.
Support levels: 7,327 7,294 7,256
Resistance levels: 7,386 7,424 7,452
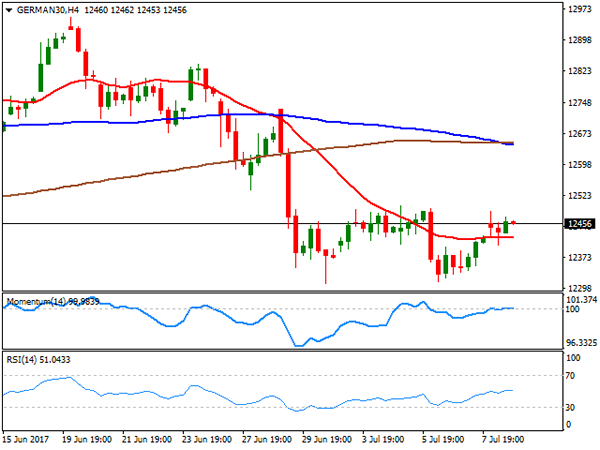
DAX
European indexes advanced at the beginning of the week, gaining on strength in the mining and energy-related sectors, backed by an advance in oil. The German DAX closed the day at 12,445.92, up 57 points or 0.46%, helped by surging exports in the country, according to the latest trade balance data. Most members were up, with E.ON leading gainers, up 2.11%, followed by Linde that added 1.69%. ProSiebenSat.1 led decliners once again, down 0.96%, followed by Adidas that shed 0.48%. The daily chart for the index shows that it held below last week's high, still struggling above its 100 DMA and below a bearish 20 SMA, whilst technical indicators have lost downward strength, but hold within negative territory, limiting chances of a steeper recovery. In the 4 hours chart, the technical outlook is neutral, as technical indicators turned flat around their mid-lines, whilst the benchmark settled above a horizontal 20 SMA, but still below the 100 and 200 SMAs, both converging around 12,650, in line with the longer term perspective.
Support levels: 12,432 12,390 12,333
Resistance levels: 12,490 12,536 12,581
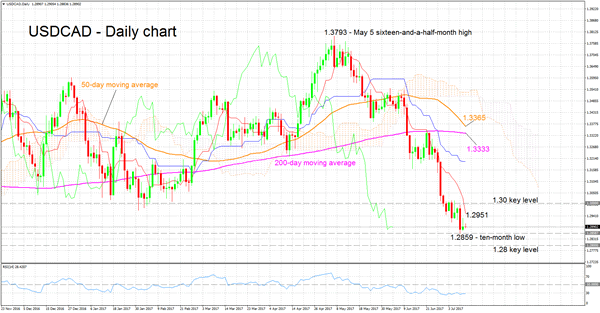
USDCAD Bearish Bias, RSI Oversold
USDCAD has experienced significant declines since reaching a sixteen-and-a-half-month high of 1.3793 on May 5th. The pair touched a ten-month low of 1.2859 during Friday of last week.
Delving into the Ichimoku analysis, the negative alignment when the Tenkan-sen line (red) crossed below the Kijun-sen (blue) in late May is still in place. Adding to the bearish signal is the steep negative slope of the Tenkan-sen.
Turning to the RSI, the indicator is well into bearish territory but notice that it has entered oversold levels when it crossed below 30. This might hint to a shift in short-term momentum.
Should the price advance, a resistance area might be formed by the 1.29 handle and the current level of the Tenkan-sen at 1.2951. Bear in mind that the price today momentarily rose above 1.29 before falling back below it. Further up, the area around the 1.30 mark, which was of significance in the past, could provide additional resistance.
On the downside, support could be met around Friday’s low of 1.2859. Additional declines would divert attention to the area around the 1.28 handle (a potential psychological level) for additional support.
The price being far below the 50- and 200-day moving averages suggests a predominantly bearish medium-term picture.
Overall, both the short- and medium-term are currently looking bearish.
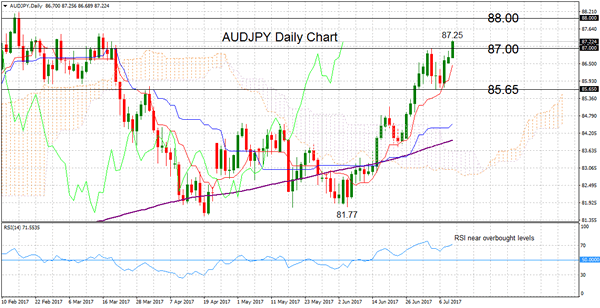
AUDJPY Maintains Short-Term Bullish Bias Above Ichimoku Cloud
AUDJPY has been rising steadily from the June 6 low of 81.77 to the key 87-handle today, making the short-term bias bullish. The market structure is bullish since prices are above the daily Ichimoku cloud and the Tenkan-sen line (red) is positively aligned. Additionally, prices are above the 200-day moving average which is sloping upwards, highlighting a positive picture.
Looking at the daily RSI, it has reached overbought levels just above 70. This suggests that upside momentum may weaken and the market could consolidate or pull back in the near term. However, while the RSI remains above 50 in bullish territory, the upside bias in the market is likely to remain intact.
The key 87.00 level is currently being tested and prices have pierced above this line which has provided strong resistance in the past few months. AUDJPY has not recorded a daily close above this level since March 16. Should prices close above it, then the February peak at 88.16 would be targeted.
Failure to close above 87.00 today, combined with an overextended market, could bring about a pullback in AUDJPY. Strong support is viewed at the 85.65 level. Below this level, further support comes into view at 84.76. A drop below it would weaken the short-term bullish bias and bring prices into the cloud.
In the longer-term picture, AUDJPY is neutral and has not shown a clear sense of direction since December 2016. The market needs to rise above 88.00 to give a more bullish outlook.