Sample Category Title
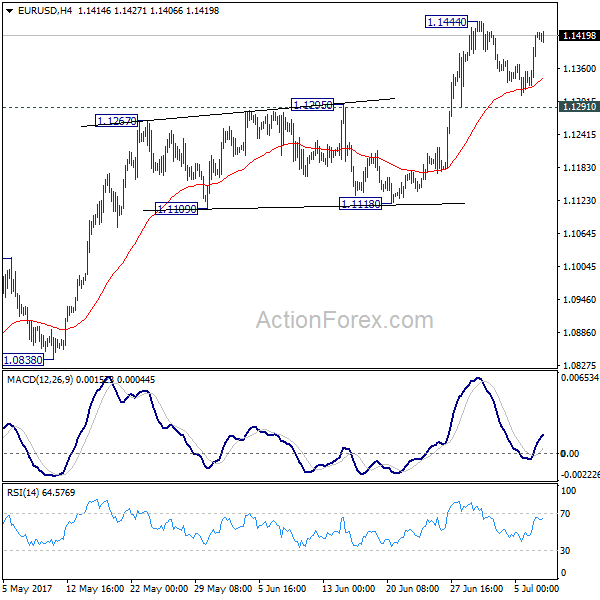
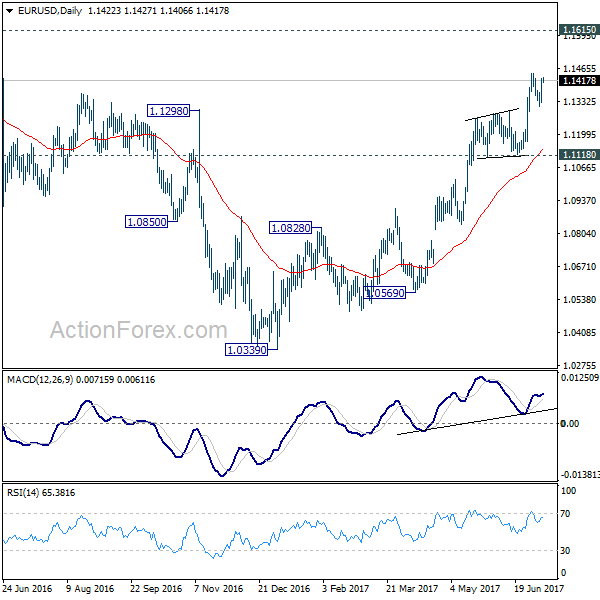
EUR/USD Daily Outlook
Daily Pivots: (S1) 1.1359; (P) 1.1392 (R1) 1.1454; More.....
EUR/USD is staying in range below 1.1444 and intraday bias remains neutral first. In case of another fall, we'd expect downside to be contained by 1.1291 resistance turned support to bring rally resumption. Break of 1.1444 will extend the rise from 1.0339 low to 1.1615 resistance next. Meanwhile, break of 1.1291 will turn focus back to 1.1118 support.
In the bigger picture, the firm break of 1.1298 resistance further affirm medium term reversal. That is an important bottom was formed at 1.0339 on bullish convergence condition in weekly MACD. Further rise would be seen to 55 month EMA (now at 1.1776). Sustained break there will pave the way to 38.2% retracement of 1.6039 (2008 high) to 1.0339 (2017 low) at 1.2516 next. This will now remain the favored case as long as 1.1118 support holds.
EUR/JPY Candlesticks and Ichimoku Analysis
Weekly
• Last Candlesticks pattern: Window
• Time of formation: 24 April 2017
• Trend bias: Up
Daily
• Last Candlesticks pattern: Hammer
• Time of formation: 18 May 2017
• Trend bias: Up
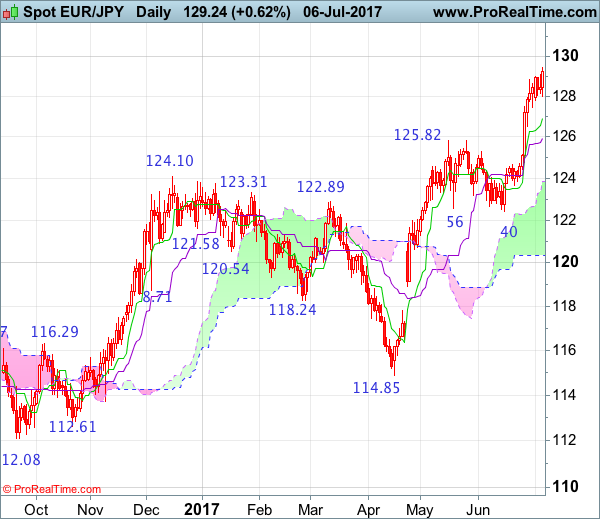
EUR/JPY – 129.89
As the single currency has maintained a firm undertone after recent rally above previous resistance at 125.82 (now support), adding credence to our bullish view that medium term rise from 109.49 low is still in progress, hence upside bias remains for this move to extend further gain to 129.45-50 (100% projection of 109.49-124.10 measuring from 114.85), however, near term overbought condition should prevent sharp move beyond psychological resistance at 130.00 and reckon 130.50-60 would hold from here, risk from there has increased for a retreat to take place later.
On the downside, whilst initial pullback to 127.80-85 cannot be ruled out, reckon downside would be limited to 127.00 and the Tenkan-Sen (now at 126.77) would hold, bring another upmove later to aforesaid upside targets. A daily close below the Kijun-Sen (now at 125.77) would defer and suggest a temporary top is possibly formed instead, risk correction to 125.00-10, then 124.45-50, however, reckon downside would be limited to 124.00-10 and price should stay above support at 123.66, bring another upmove later.
Recommendation: Buy at 127.00 for 129.50 with stop below 126.00.
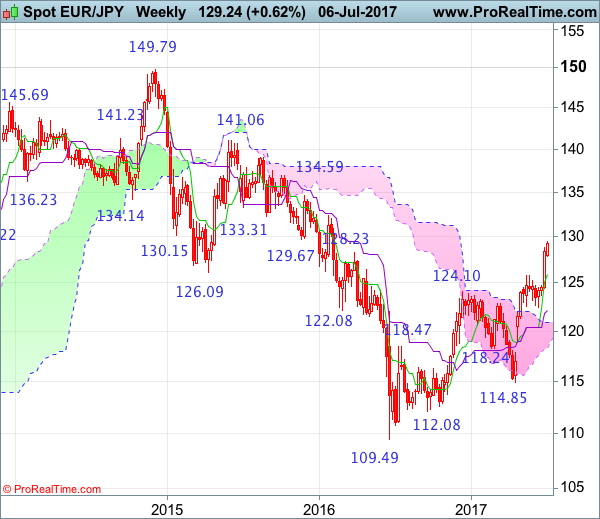
On the weekly chart, last week’s rally above previous resistance at 125.82 did form a long white candlestick, reinforcing our bullish view that the medium term rise from 109.49 low is still in progress and bullishness remains for this move to extend further gain to 129.45-50 (100% projection of 109.49-124.10 measuring from 114.85), then psychological resistance at 130.00, however, reckon upside would be limited to 130.50-60 and 131.00 should hold, the single currency should falter well below previous chart resistance at 132.33), risk from there is seen for a retreat to take place later.
On the downside, although initial pullback to 128.00, then 127.00-10 cannot be ruled out, reckon 126.50 would limit downside and euro shall head north again from there to aforesaid upside targets. A drop below said previous resistance at 125.82 (now support) would defer and risk correction to 125.00, then towards 124.50, however, still reckon downside would be limited to 124.00 and support at 123.66 should remain intact, bring another rally in late Q3.
Forex Technical Analysis: EUR/USD, USD/JPY, GBP/USD
EUR/USD
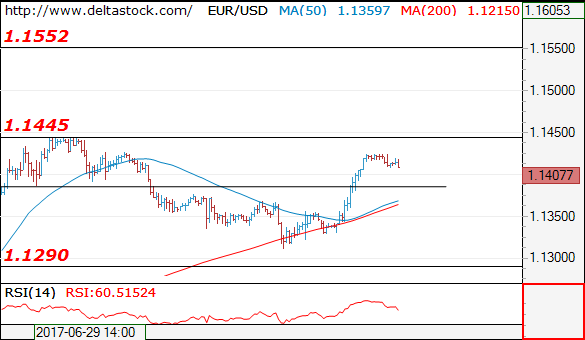
Current level - 1.1407
A reversal has been confirmed at 1.1310 and the bias is already positive, for a break through 1.1445 peak, towards 1.1550. Initial intraday support lies at 1.1385.
| Resistance | Support | ||
| intraday | intraweek | intraday | intraweek |
|
1.1445 |
1.1550 |
1.1385 |
1.1020 |
|
1.1550 |
1.1610 |
1.1290 |
1.0838 |
USD/JPY
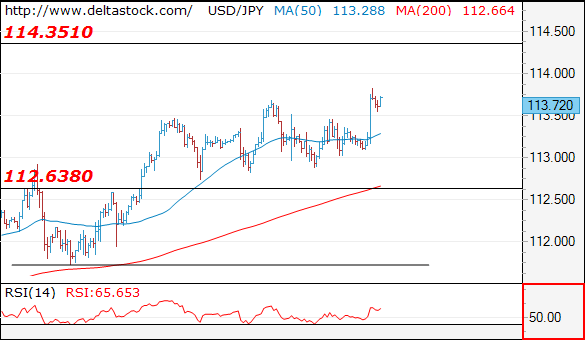
Current level - 113.72
The uptrend has been renewed, heading towards 114.30 area. Minor intraday support lies at 113.40.
| Resistance | Support | ||
| intraday | intraweek | intraday | intraweek |
|
114.30 |
114.30 |
113.40 |
110.30 |
|
114.30 |
115.50 |
112.60 |
108.81 |
GBP/USD
Current level - 1.2951
The bias is positive after 1.2889 low, for a rise towards 1.3050 key resistance area. A violation of the latter will challenge 1.3135 zone.
| Resistance | Support | ||
| intraday | intraweek | intraday | intraweek |
|
1.3050 |
1.3130 |
1.2860 |
1.2635 |
|
1.3130 |
1.3500 |
1.2790 |
1.2480 |
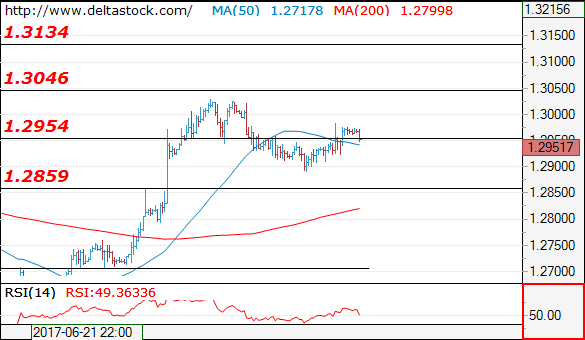
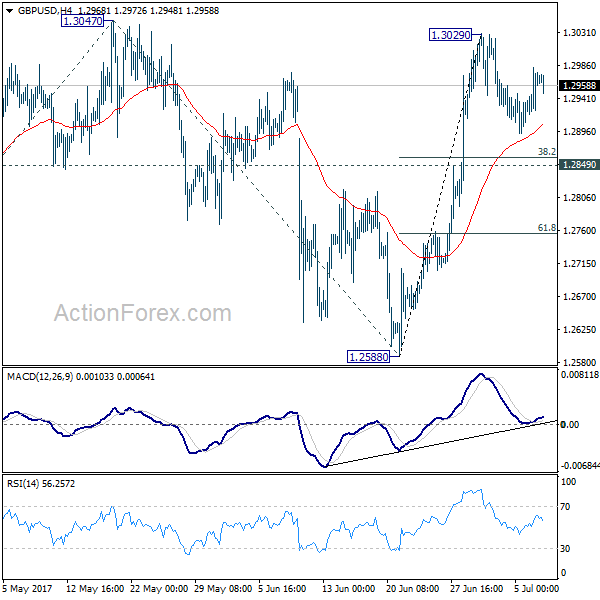
GBP/USD Daily Outlook
Daily Pivots: (S1) 1.2930; (P) 1.2957; (R1) 1.2995; More...
GBP/USD is still bounded in consolidation from 1.3029 and intraday bias stays neutral. Another fall cannot be ruled out. But downside should be contained above 1.2849 support to bring rise resumption. Break of 1.3029 should then send GBP/USD through 1.3047 to 61.8% projection of 1.2108 to 1.3047 from 1.2588 at 1.3168 next.
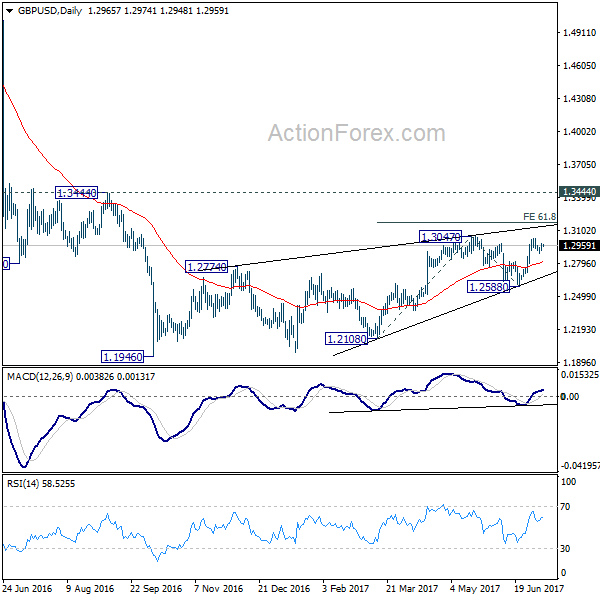
In the bigger picture, overall, price actions from 1.1946 medium term low are seen as a corrective pattern that is still in progress. While further upside is now in favor, overall outlook remains bearish as long as 1.3444 key resistance holds. Larger down trend from 1.7190 is expected to resume later after the correction completes. And break of 1.2588 will indicate that such down trend is resuming.
USD/CAD Candlesticks and Ichimoku Analysis
Weekly
• Last Candlesticks pattern: Shooting doji
• Time of formation: 01 May 2017
• Trend bias: Sideway
Daily
• Last Candlesticks pattern: Bearish engulfing
• Time of formation: 5 May 2017
• Trend bias: Down
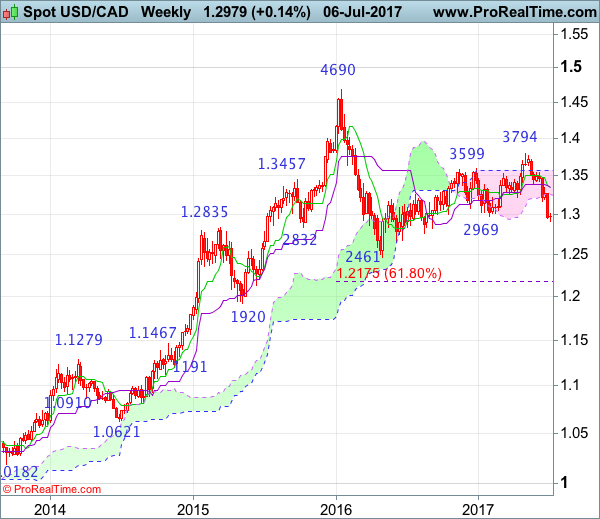
USD/CAD – 1.2945
As the greenback has remained under pressure after recent selloff and price has broken below indicated previous support at 1.2969, adding credence to our bearish view that early erratic rise from 1.2461 has ended at 1.3794 earlier, hence further fall to 1.2900 and later 1.2850 would be seen, however, reckon support at 1.2822 would hold from here due to oversold condition and price should stay well above support at 1.2763, risk from there has increased for a rebound to take place later this month.
On the upside, whilst initial recovery to 1.3000-05 and possibly towards 1.3050 cannot be ruled out, reckon upside would be limited to the Tenkan-Sen (now at 1.3092) and bring another selloff later. Only a sustained breach above previous support 1.3165 (now resistance) would defer and bring a stronger rebound to 1.3180-85 and then test of previous support at 1.3208 but upside should be limited to the Kijun-Sen (now at 1.3230) and price should falter below 1.3305-10, bring another decline later.
Recommendation: Sell again at 1.3050 for 1.2850 with stop above 1.3150.

On the weekly chart, last week’s selloff below indicated previous support at 1.2969 did form another long black candlestick and bearishness remains fort the fall from 1.3794 top to extend weakness to 1.2900, break there would signal the entire recovery from 1.2461 low (2016 low) has ended at 1.3794 early last month, then further decline to 1.2850 and then test of support at 1.2822 would be seen, however, near term oversold condition should limit downside and price should stay above another previous support at 1.2763, bring rebound later.
On the upside, although initial recovery to 1.3070-80 cannot be ruled out, reckon 1.3100-10 would limit upside and bring another decline later. A weekly close above said previous support at 1.3165 would defer and risk a stronger recovery to 1.3200-10 but still reckon 1.3270-75 would limit upside and price should falter below resistance at 1.3348 and bring another selloff next month.
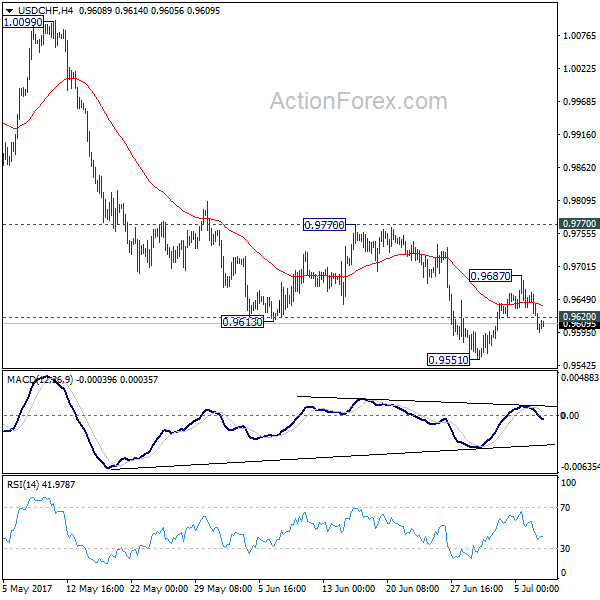
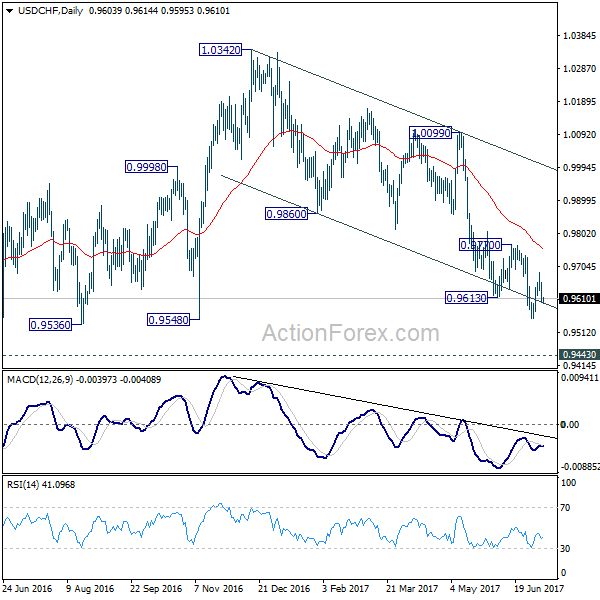
USD/CHF Daily Outlook
Daily Pivots: (S1) 0.9583; (P) 0.9622; (R1) 0.9643; More......
Break of 0.9620 minor support suggests that recovery from 0.9551 is already completed at 0.9687. Intraday bias is turned back to the downside for 0.9551 low. Break will extend the decline from 1.0342 to 0.94443 key support level. At this point, we'd expect strong support from there to bring rebound. Above 0.9687 will bring another recovery. But overall, outlook will remain bearish as long as 0.9777 resistance holds.
In the bigger picture, USD/CHF is still bounded in medium term range of 0.9443/1.0342 for the moment. Consolidative trading would likely continue and medium term outlook remains neutral. Break of 1.0342 key resistance is needed to confirm underlying bullish momentum in the pair. Meanwhile, downside attempts should be contained by 0.9443 key support level. However, sustained break of 0.9443 will carry larger bearish implication and target 0.9 handle.
The Fed Is Due To Release The Monetary Policy Report Today
Market movers today
The main release today is the US jobs report for June. We expect employment rose 180,000 due to strong ISM and Markit PMI employment indices but yesterday's ADP jobs report puts some downside risks to this forecast . We estimate the unemployment rate was unchanged at 4.3% and wage growth rose slightly to 2.6%, which is st ill low in a historical perspective. For more, see US Labour Market Monitor: June report likely to be stronger than in recent months, 5 July.
Also, the Fed is due to release the monetary policy report today ahead of Janet Yellen's testimony to Congress next week. The FOMC minutes from the June meeting revealed that the Fed may soon begin quantitative tightening (see FOMC Minutes: Fed likely to announce start of QT in September, 5 July).
In Sweden, we are due to get household consumption data at 09:30 CET . In Norway, we are due get product ion data at 08:00 CET.
In the UK, the NIESR GDP estimate for June and product ion and construct ion data for May are due out today.
The G20 summit begins today and there are many t hings to discuss: North Korea, Ukraine and trade/protectionism to mention but a few.
Selected market news
The European fixed income market sold off yesterday on the back of hawkish minutes from the ECB, modest demand for the long-end of France and Spain at the auctions yesterday and a technical sell-off as the 10Y German government bond yield broke through the important level of 0.5%.
Focus on global monetary policy tightening is set to be an ongoing theme in markets but both the ECB and the Federal Reserve are well aware that they have to do this gradually in order to avoid the previous policy mistakes made in 2011, when the ECB tightened monetary policy too early, and 2013, with the Federal Reserve's taper tantrum. Hence, we expect rates to remain range-bound.
Sentiment in the Asian equity markets this morning was hit by rising rates and the hawkish minutes from the ECB. This also affected the euro versus the US dollar, with EUR/USD remaining above the 1.14 level in Asian trading.
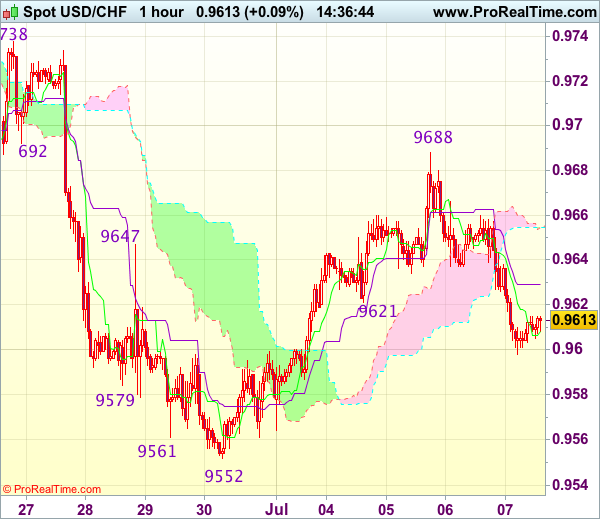
Trade Idea : USD/CHF – Buy at 0.9555
USD/CHF - 0.9613
Most recent candlesticks pattern : N/A
Trend : Near term down
Tenkan-Sen level : 0.9608
Kijun-Sen level : 0.9629
Ichimoku cloud top : 0.9655
Ichimoku cloud bottom : 0.9655
Original strategy :
Buy at 0.9585, Target: 0.9685, Stop: 0.9550
Position : -
Target : -
Stop : -
New strategy :
Buy at 0.9555, Target: 0.9655, Stop: 0.9520
Position : -
Target : -
Stop : -
Although the greenback retreated after rising to 0.9688 and near term downside risk remains for initial weakness to 0.9580, reckon last week’s low at 0.9552 would limit downside and bring another rebound later, above 0.9660 would signal the retreat from 0.9688 has ended and bring test of this level, break there would signal low has been formed at 0.9552, bring retracement of early decline to 0.9700 and later towards resistance area at 0.9738-43.
In view of this, we are inclined to buy dollar on further fall. Below said support at 0.9552 would signal recent decline has resumed instead, then weakness to 0.9520-25 would follow but reckon 0.9500 would hold on first testing.
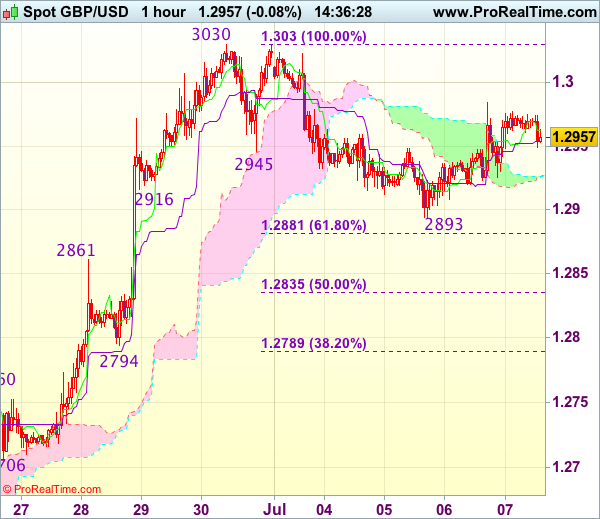
Trade Idea : GBP/USD – Stand aside
GBP/USD - 1.2959
Most recent candlesticks pattern : N/A
Trend : Near term up
Tenkan-Sen level : 1.2962
Kijun-Sen level : 1.2954
Ichimoku cloud top : 1.2927
Ichimoku cloud bottom : 1.2926
Original strategy :
Buy at 1.2865, Target: 1.3000, Stop: 1.2830
Position : -
Target : -
Stop : -
New strategy :
Stand aside
Position : -
Target : -
Stop : -
Although the British pound found support at 1.2893 earlier this week and has rebounded, above 1.3000 is needed to signal the pullback from 1.3030 (last week’s high) has indeed ended and bring retest of this level, break there would signal early upmove has resumed and extend further gain towards recent high 1.3048, only break there would retain bullishness and encourage for headway to 1.3080, then 1.3100-10.
In view of this, would not chase this rise here and would be prudent to stand aside for now. Below 1.2920 would prolong consolidation, bring another test of said support at 1.2893, break there would signal temporary top has been formed at 1.3030, bring further corrective fall to previous resistance at 1.2861, then towards 1.2830-35 (50% Fibonacci retracement of 1.2640-1.3030).
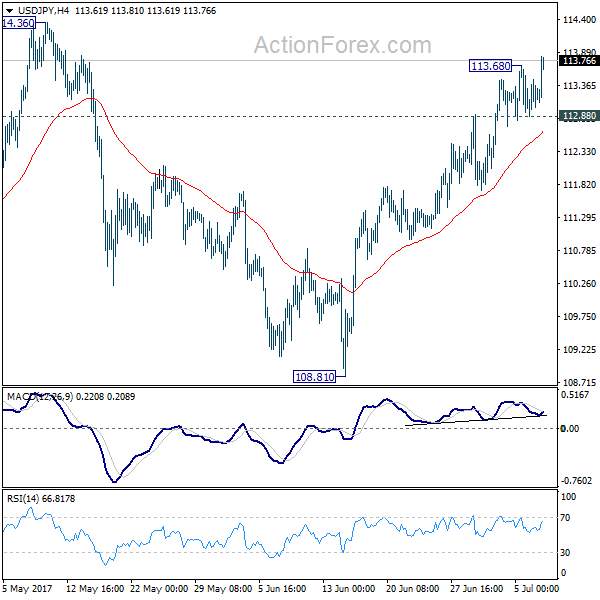
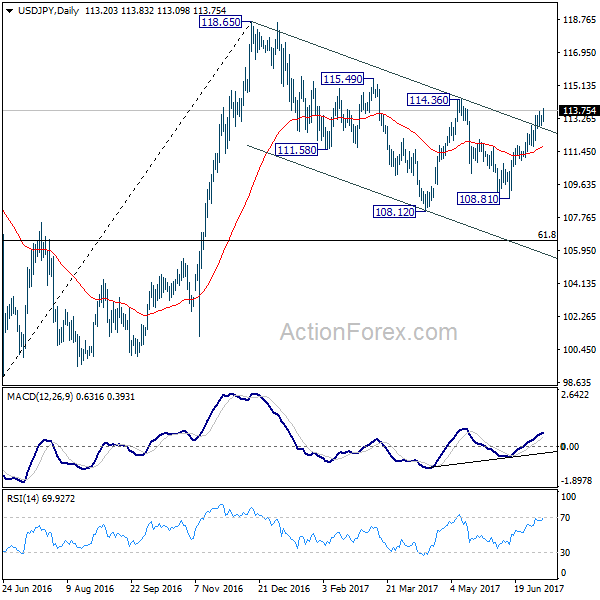
USD/JPY Daily Outlook
Daily Pivots: (S1) 112.85; (P) 113.14; (R1) 113.57; More...
USD/JPY's rally resumed after brief consolidation and intraday bias is back on the upside for 114.36 resistance. Decisive break there will confirm our bullish view that corrective pull back from 118.65 has completed at 108.12. In that case, further rally would be seen to retest 118.65. On the downside, break of 112.88 support is needed to indicate short term topping. Otherwise, outlook will remain bullish in case of retreat.
In the bigger picture, the corrective structure of the fall from 118.65 suggests that rise from 98.97 is not completed yet. Break of 118.65 will target a test on 125.85 high. At this point, it's uncertain whether rise from 98.97 is resuming the long term up trend from 75.56, or it's a leg in the consolidation from 125.85. Hence, we'll be cautious on topping as it approaches 125.85.