
Sample Category Title
ECB Minutes Show Discussion Of An Exit From Monetary Stimulus
For the 24 hours to 23:00 GMT, the EUR rose 0.62% against the USD and closed at 1.1421, after minutes of the European Central Bank (ECB) June meeting indicated that policymakers are tilting towards tapering the central bank's quantitative easing programme.
According to minutes, board members mulled over the possibility of tapering the ECB's asset purchases in coming months if confidence in the region's inflation outlook improves further. However, officials decided against it for now as recovery in the Euro-bloc's economic activity had yet to result in higher inflation. Moreover, the ECB stressed on the need to maintain caution in communication as it could trigger unwarranted movements in financial markets.
In other economic news, data showed that Germany's seasonally adjusted factory orders rebounded 1.0% on a monthly basis in May, undershooting market expectations for a rise of 1.9%. In the prior month, factory orders had registered a revised drop of 2.2%. Meanwhile, the nation's Markit construction PMI fell to a level of 55.1 in June, compared to a reading of 55.3 in the previous month.
The greenback lost ground against its major counterparts, on the back of softer than expected jobs data in the US that pointed to some loss of momentum in the nation's job growth.
Data revealed that the ADP private sector employment in the US climbed less-than-expected by 158.0K in June, compared to market consensus for a rise of 188.0K. The private sector employment had recorded a revised increase of 230.0K in the previous month. Further, the nation's initial jobless claims registered an unexpected rise to a level of 248.0K in the week ended 01 July 2017, rising for the third straight week and confounding market expectations of a drop to a level of 243.0K. Initial jobless claims had registered a level of 244.0K in the previous week. Also, the nation's trade deficit narrowed less-than-anticipated to a level of $46.5 billion in May, after registering a deficit of $47.6 billion in the prior month.
Another set of economic data showed that the US ISM non-manufacturing PMI surprisingly rose to a level of 57.4 in June, while investors had envisaged for a drop to a level of 56.5. In the previous month, the PMI had registered a reading of 56.9. Additionally, the nation's final Markit Markit services PMI unexpectedly advanced to a level of 54.2 in June, expanding at its fastest pace since January 2017 and compared to a reading of 53.6 in the previous month. The preliminary figures had recorded a drop to a level of 53.0. Moreover, the nation's MBA mortgage applications rebounded 1.4% in the week ended 30 June 2017, following a decline of 6.2% in the prior week.
In the Asian session, at GMT0300, the pair is trading at 1.1414, with the EUR trading 0.06% lower against the USD from yesterday's close.
The pair is expected to find support at 1.1354, and a fall through could take it to the next support level of 1.1294. The pair is expected to find its first resistance at 1.145, and a rise through could take it to the next resistance level of 1.1486.
Going ahead, investors will focus on Germany's industrial production data for May, slated to release in a few hours. Additionally, in the US, the crucial non-farm payrolls, unemployment rate and average hourly earnings data, all for June, slated to release later today, will attract significant amount of market attention.
The currency pair is trading above its 20 Hr and 50 Hr moving averages.

Pound Trading A Tad Higher, Ahead Of A Slew Of Economic Data In The UK
For the 24 hours to 23:00 GMT, the GBP rose 0.26% against the USD and closed at 1.2969.
In the Asian session, at GMT0300, the pair is trading at 1.2970, with the GBP trading slightly higher against the USD from yesterday’s close.
The pair is expected to find support at 1.2933, and a fall through could take it to the next support level of 1.2895. The pair is expected to find its first resistance at 1.2996, and a rise through could take it to the next resistance level of 1.3021.
Trading trends in the GBP today is expected to be determined by the release of Britain’s industrial, manufacturing and construction output data along with total trade balance figures, all for May, slated to release in a few hours. Also, the NIESR GDP estimate for the three months to June, will also be on investors’ radar.
The currency pair is trading above its 20 Hr and 50 Hr moving averages.

Japanese Yen Trading Lower In The Asian Session
For the 24 hours to 23:00 GMT, the USD slightly declined against the JPY and closed at 113.13.
In the Asian session, at GMT0300, the pair is trading at 113.70, with the USD trading 0.5% higher against the JPY from yesterday's close.
The pair is expected to find support at 113.11, and a fall through could take it to the next support level of 112.53. The pair is expected to find its first resistance at 114.06, and a rise through could take it to the next resistance level of 114.43.
Next week, investors will keep a close watch on Japan's (BOP basis) trade balance, Eco-Watchers survey, tertiary industry index and final industrial production data.
The currency pair is trading above its 20 Hr and 50 Hr moving averages.

Swiss Annual Inflation Growth Weakest In 7 Months In June
For the 24 hours to 23:00 GMT, the USD declined 0.36% against the CHF and closed at 0.9606.
On the macro front, Switzerland's consumer price index (CPI) advanced less-than-expected by 0.2% on an annual basis in June, rising at its weakest pace in seven months. In the prior month, the CPI had risen 0.5%, while lower market participants expected for a rise of 0.3%. Meanwhile, on a monthly basis, the nation's consumer prices unexpectedly eased 0.1% in June, compared to an advance of 0.2% in the previous month.
In the Asian session, at GMT0300, the pair is trading at 0.9611, with the USD trading slightly higher against the CHF from yesterday's close.
The pair is expected to find support at 0.9587, and a fall through could take it to the next support level of 0.9564. The pair is expected to find its first resistance at 0.9647, and a rise through could take it to the next resistance level of 0.9684.
Ahead in the day, traders will await the release of Switzerland's unemployment rate data for June.
The currency pair is trading below its 20 Hr and 50 Hr moving averages.

Canada’s Building Permits Surged In May
For the 24 hours to 23:00 GMT, the USD rose 0.16% against the CAD and closed at 1.2978.
Macroeconomic data indicated that Canada's building permits jumped 8.9% on a monthly basis in May, higher than market expectations for a gain of 1.0% and after recording a revised advance of 0.5% in the previous month. On the contrary, the nation's international merchandise trade deficit expanded to a level of C$1.09 billion in May, following a revised deficit of C$0.55 billion in the previous month.
In the Asian session, at GMT0300, the pair is trading at 1.2985, with the USD trading a tad higher against the CAD from yesterday's close.
The pair is expected to find support at 1.2941, and a fall through could take it to the next support level of 1.2896. The pair is expected to find its first resistance at 1.3012, and a rise through could take it to the next resistance level of 1.3038.
Looking forward, Canada's unemployment rate data for June, due to release later in the day, will keep investors on their toes.
The currency pair is trading above its 20 Hr and 50 Hr moving averages.

A Potential Break Down Looms For The USDCHF
Key Points:
- Price action fails to breach trend line and turns negative.
- Key support level at 0.9585 nearing.
- Watch for a breakdown towards the 0.9550 mark in the coming week.
The USDCHF has been under some significant selling pressure of late as the pair continues to decline under the auspices of a bearish trend line. However, there has been some short term resurgence for the pair which saw a concerted move, which ultimately failed, back towards the falling trend line. Subsequently, the ill-fated, short term rally has set the wheels of a breakdown in motion that could yield some significant short side moves in the week ahead.
Fundamentally, there has been a significant swing around the greenback sentiment due to a range of confusing and mixed economic data emanating from the U.S. In particular, retail sales, consumer spending, and a lack of wage inflation appears to be clouding the current economic outlook for the U.S. and this is adding to slipping greenback sentiment. In addition, this is largely overshadowing some of the recent relatively poor data from Switzerland, including a slip in the monthly CPI figures.
In particular, a quick review of the major technical factors provides some illuminating hints as to what is coming for the embattled pair. Presently, the RSI Oscillator is demonstrating a definite downtrend but is yet to reach neutral territory which suggests that there is still room to move on the downside. Also, price action is currently well below the 100 hour moving average and there looks to be little prospect of an upside move towards that level any time soon.
Subsequently, the view is that the pair's recent decline from the 0.9688 mark towards support around the 0.9600 handle suggests that the longer term decline is not yet completed. The most likely scenario is then likely to be a challenge to support at 0.9585 before a sharp move towards our initial target of 0.9552, representing the recent low, and ultimately towards the 0.9500 handle.
Ultimately, the next week will likely be relatively critical for the pair with an impending breakdown and challenge to support at 0.9585. Subsequently, be on guard for a breach of this level because it will cause a fairly rapid Dollar depreciation.
The Silver Flash Crash: What Might Have Been At Work
Key Points:
- A flash crash has hit silver markets leaving many traders scratching their heads.
- Numerous explanations have been put forward, including the less reliable ones.
- Prices seem to have stabilised now.
Silver prices have been the subject of significant debate of the past few hours as a result of a flash crash that saw the metal plummet to the $14.27 handle before roaring higher within moments. Of course, this has brought out the usual speculations and accusations about exactly what was driving the movement so we have collected a few honourable mentions that might help to explain the crash.
Firstly, the classic 'fat finger' argument has been put forward by numerous analysts as a contributing factor to the tumble. To elaborate,a fat finger is when human input error generates a substantially erroneous trade – typically via an extra zero here or there. As entertaining as the notion is, such mistakes are typically safeguarded against by various fail safes. What’s more, a spike of this size in such a heavily followed market would almost certainly have been picked up prior to execution.
One slightly more plausible suggestion has been a sudden liquidity drain that sparked a bout of panic selling. Indeed, markets have been fairly thin over the 4th of July holiday period which could have compounded fears that silver was becoming illiquid in the wake of JP Morgan’s recent acquisitions. This being said, the extent to which JP Morgan has ‘rigged’ silver markets is constantly challenged and courts seem to be unable to agree on whether or not the institution is breaking antitrust legislation.
Stop loss orders have also been fingered as a cause for the sudden rout for all the usual reasons. Specifically, the hitting of numerous stop loss orders in rapid succession could have easily amplified the effects of a sell-off – even if they probably didn’t trigger the downtrend in the first place. Moreover, given that many traders may have been out of action due to the holiday’s in the US, it’s quite reasonable to expect more ‘set and forget’ trades to have been placed than is typical. This would have left the metal more exposed to this type of risk than we would usually expect.
Ultimately, there are many other potential explanations for what was hammering silver prices but we may never get to the bottom of it. These include, but are not limited to, algorithmic traders, glitches, stub quotes, and so on. Indeed, it was probably a mix of some, if not all, of the above. Nevertheless, it at least looks as though the metal has stabilised now and it could meander higher now that we are out of the woods. This should see the metal make a beeline for the $16 handle in the coming days, especially as political tensions from the G20 Summit begin to be felt.
Elliott Wave View: USDX Downside Resumes
Short term USDX (USD Index) Elliott Wave view suggests the rally to 97.88 high on 6/20 ended Intermediate wave (X). Decline from there is unfolding as an impulse Elliott Wave structure with extension and ended at 95.47 low on 6/29. This 5 wave move could be Minor wave A of an Elliott wave zigzag structure structure, where Minute wave ((i)) ended at 97.17 and Minute wave ((ii)) ended at 97.47. Minute wave ((iii)) ended at 96.15, Minute wave ((iv)) at 96.61 and Minute wave ((v)) of A ended at 95.47.
Revised view calls for Minor wave B bounce completed at 96.52. For this view, a break below Minor wave A at 95.47 will add more validity. Until then, a double correction in Minor wave B can’t be completely ruled out. The subdivision of Minor wave B is unfolding as an Elliott wave double three structure. Minute wave ((w)) ended at 96.24, Minute wave ((x)) ended at 96.04 and Minute wave ((y)) of B ended at 96.52. Near term, while bounces stay below Minor wave B at 96.52, expect the Index to resume lower. We don’t like buying the Index.
USDX 1 Hour Elliott Wave Chart
EUR/JPY Daily Outlook
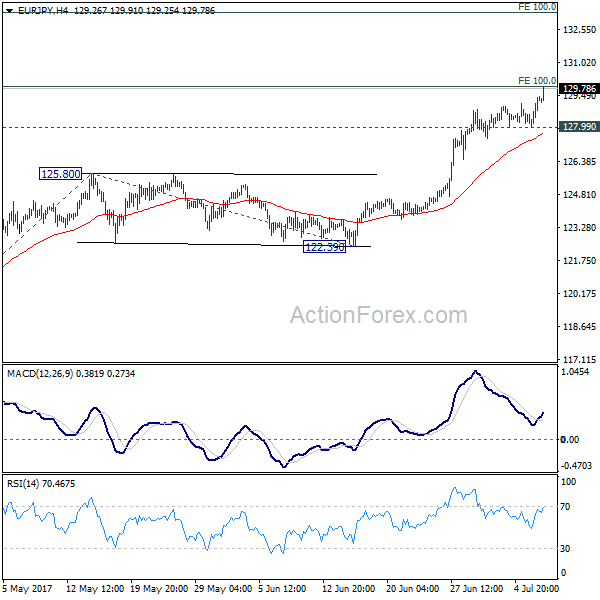
Daily Pivots: (S1) 128.40; (P) 128.90; (R1) 129.82; More...
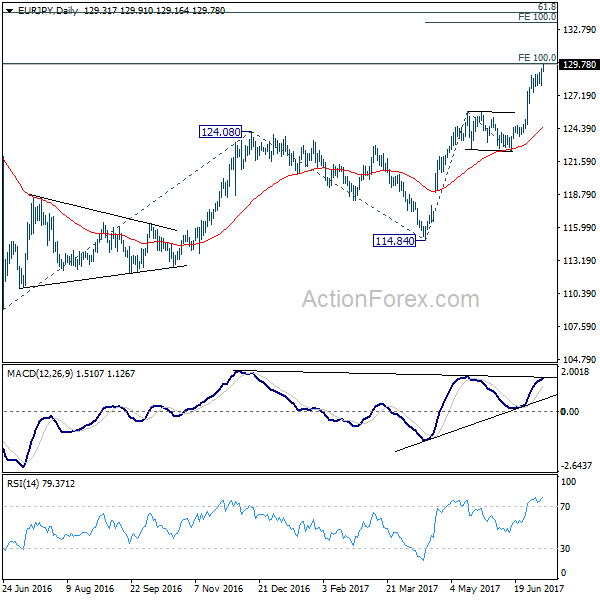
EUR/JPY's rally extends and reaches as high as 129.91 and there is no sign of topping yet. Firm break of medium term projection level at 128.89 will pave the way to next near term projection level at 100% projection of 114.84 to 125.80 from 122.39 at 133.35. On the downside, break of 127.99 support is needed to indicate short term topping. Otherwise, outlook will remain bullish in case of retreat.
In the bigger picture, the break of 126.09 support turned resistance should have confirmed completion of down trend form 149.76 (2014 high), at 109.03 (2016 low). Current rise from 109.03 has already met target of 100% projection of 109.03 to 124.08 from 114.84 at 129.89. Sustained break there will pave the way to 61.8% retracement of 149.76 to 109.03 at 134.20 and above. Medium term outlook will now remain bullish as long as 122.39 support holds.
BoJ Announced Emergency Bond Buying as Global Yields Surges, USD/JPY Strengthens ahead of NFP
Yen tumbles broadly as global bond rout continued and pushed yields higher again. German 10 year bund yields broke 0.5% level for the first time since January 2016. Meanwhile, US 10 year yield jumped to a near two month high and closed firmly at 2.37, up 0.036. The resumed selling in bonds were believed to be triggered by the hawkish ECB minutes which indicated the discussion of removing easing bias. Also, some believed that weak results of French 30 year bond-auction was another trigger. UD/JPY reaches as high as 113.83 as recent rise resumed. GBP/JPY also hits as high as 147.60. Meanwhile, EUR/JPY is even stronger and hits 129.91, set to take on 130 handle.
In response to the developments, BoJ announced to carry out an emergency fixed-rate bond buying operation to curb long term yields under the so called "Yield Curve Control" framework. The central bank said it will buy unlimited amount of JGB with maturities of 5 to 10 years. This is the third time BoJ carries out such operations since the announcement of YCC last year. The first offer in November drew no bids. Under the second operation in February, JPY 723.9b in bonds were purchased.
Yen follows yield, not stocks
We've pointed out before that Yen is decoupling from risk aversion and its now more correlated to yields. This is clearly seen again as global equities tumbled overnight. DOW lost -158.13 pts, or -0.74% to 21320.04. S&P 500 dropped -22.79 pts, or -0.94% to 2409.75. NASDAQ closed down -61.40 pts, or -1.0% at 6089.46. NASDAQ stays the more vulnerable one as last week's low was breached. Weakness carries on in Asia with Nikkei trading down -0.3% and broke 20000 handle at the time of writing. FTSE and DAX might set to take on last week's low at 7302.7 and 12319 respectively.
Euro boosted by hawkish ECB accounts
For the week so far, Euro is the second strongest major currency, behind Dollar by a thin margin. And yesterday's rebound in EUR/USD could actually be setting up for a break through 1.1444 resistance today. The minutes for the June ECB meeting turned out more hawkish than expected. The minutes unveiled that policymakers had discussed removing the guidance on the bond asset purchase program (QE), if necessary. Policymakers just shrugged off recent weakness in headline inflation as core inflation continued to climb higher. This came in line with President Mario Draghi's comments last week that "deflationary forces have been replaced by reflationary ones", pointing to a "strengthening and broadening recovery" in the Eurozone. More in June's Minutes Revealed ECB Discussed over Removing Asset Purchases Guidance, Euro Soars
NFP expectations setting up for downside surprise
Non-farm payroll report from US will be the main focus today. Economists expect 173k growth in the job market in June, with unemployment rate unchanged at 4.3%. Average hourly earnings are expected to show 0.3% mom growth. Looking at other related data, ADP private payroll was a disappointment with only 158k growth. Employment component of ISM services dropped from 57.8 to 55.8. But employment component of ISM manufacturing jumped sharply from 53.5 to 57.2. Four week moving average of initial jobless claims was relatively unchanged at 243k while continuing claims stayed below 2m level. Conference board consumer confidence improved slightly to 118.9. The data point to a solid NFP report today, which on the other hand, could be seen as a setup for a downside surprise.
Also on the data front, Japan labor cash earnings rose 0.7% yoy in May, while real cash earnings rose 0.1% yoy. UK production data will be the main focus in European session, where trade balance will also be released. Germany will release industrial production too. Swiss will release unemployment and foreign currency reserves. Later in the day, in additional to US NFP, Canada will also release employment data and Ivey PMI.
EUR/JPY Daily Outlook
Daily Pivots: (S1) 128.40; (P) 128.90; (R1) 129.82; More...
EUR/JPY's rally extends and reaches as high as 129.91 and there is no sign of topping yet. Firm break of medium term projection level at 128.89 will pave the way to next near term projection level at 100% projection of 114.84 to 125.80 from 122.39 at 133.35. On the downside, break of 127.99 support is needed to indicate short term topping. Otherwise, outlook will remain bullish in case of retreat.
In the bigger picture, the break of 126.09 support turned resistance should have confirmed completion of down trend form 149.76 (2014 high), at 109.03 (2016 low). Current rise from 109.03 has already met target of 100% projection of 109.03 to 124.08 from 114.84 at 129.89. Sustained break there will pave the way to 61.8% retracement of 149.76 to 109.03 at 134.20 and above. Medium term outlook will now remain bullish as long as 122.39 support holds.
Economic Indicators Update
| GMT | Ccy | Events | Actual | Forecast | Previous | Revised |
|---|---|---|---|---|---|---|
| 0:00 | JPY | Labor Cash Earnings Y/Y May | 0.70% | 0.40% | 0.50% | |
| 0:00 | JPY | Real Cash Earnings Y/Y May | 0.10% | -0.10% | 0.00% | |
| 5:00 | JPY | Leading Index May P | 104.6 | 104.2 | ||
| 5:45 | CHF | Unemployment Rate Jun | 3.20% | 3.20% | ||
| 6:00 | EUR | German Industrial Production M/M May | 0.20% | 0.80% | ||
| 7:00 | CHF | Foreign Currency Reserves Jun | 695.0B | 693.7B | ||
| 8:30 | GBP | Industrial Production M/M May | 0.40% | 0.20% | ||
| 8:30 | GBP | Industrial Production Y/Y May | 0.20% | -0.80% | ||
| 8:30 | GBP | Manufacturing Production M/M May | 0.40% | 0.20% | ||
| 8:30 | GBP | Manufacturing Production Y/Y May | 0.90% | 0.00% | ||
| 8:30 | GBP | Construction Output M/M May | 0.60% | -1.60% | ||
| 8:30 | GBP | Visible Trade Balance (GBP) May | -10.9B | -10.4B | ||
| 12:00 | GBP | NIESR GDP Estimate Jun | 0.20% | |||
| 12:30 | CAD | Net Change in Employment Jun | 54.5k | |||
| 12:30 | CAD | Unemployment Rate Jun | 6.60% | |||
| 12:30 | USD | Change in Non-farm Payrolls Jun | 173K | 138K | ||
| 12:30 | USD | Unemployment Rate Jun | 4.30% | 4.30% | ||
| 12:30 | USD | Average Hourly Earnings M/M Jun | 0.30% | 0.20% | ||
| 14:00 | CAD | Ivey PMI Jun | 53.8 | |||
| 14:30 | USD | Natural Gas Storage | 46B |