Sample Category Title
Foreign Exchange Market Commentary: EUR/USD, USD/JPY, GBP/USD, GOLD, WTI CRUDE, DJIA, FTSE100, DAX
EUR/USD
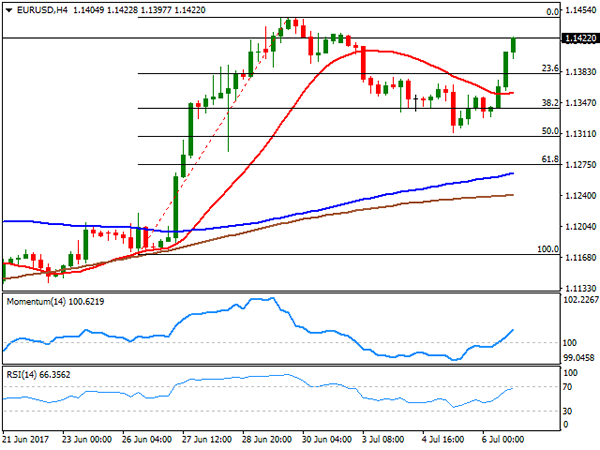
The EUR/USD pair trimmed most of its weekly losses and re-surged above the 1.1400 level, getting an expected boost from the ECB's account of the monetary policy meeting, as the document showed that policymakers discussed removing the pledge to increase their bond-buying program if needed in their policy communication, but decided to be cautious as the economic recovery has yet to result in higher inflation, and to prevent upsetting financial markets. Further supporting the advance was receding demand for the greenback, after data released this Thursday disappointed, particularly that related to employment. The ADP survey showed that the private sector added 158K new jobs, below the expected 185K, while weekly unemployment claims for the week ended June 30th surged to 248K from previous 244K. A positive surprise came from the final services PMIs, as the official ISM index came in at 57.4, well above expectations of 56.5, whilst the Markit index jumped to 54.2 from an initial estimate of 53.0.
Speculative interest will now focus on the upcoming US NFP report to be release this Friday with the country expected to have added 179K new jobs in June, and the unemployment rate to remain steady at 4.3%. The worst-than-expected employment numbers released ahead of the report may lower the bar a bit, but anyway, seems unlikely that even with a positive surprise, the greenback can change course.
From a technical point of view, the pair remains around its daily high and not far from the yearly one set at 1.1445, with technical readings supporting additional advances, given that in the 4 hours chart, indicators maintain their strong upward momentum in positive territory, whilst the 20 SMA has turned higher below the current level. The pair has a strong static resistance in the 1.1460 level, with a break above it probably fueling the advance, at least short-term, towards the 1.1490 region first, an up to 1.1525 then.
Support levels: 1.1380 1.1340 1.1290
Resistance levels: 1.1460 1.1490 1.1525
USD/JPY
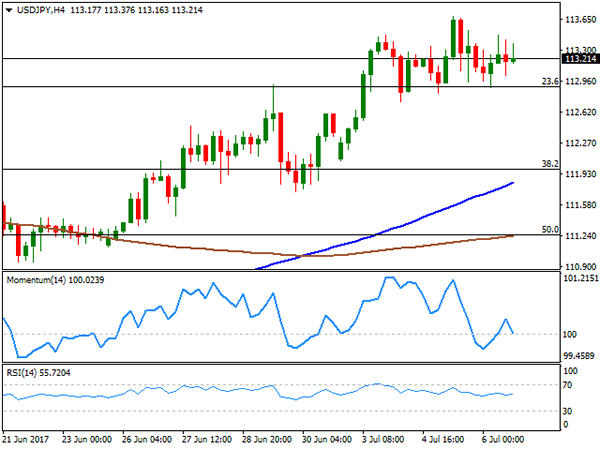
The USD/JPY pair ends the day barely higher for a second consecutive day, having been contained within Wednesday's range, but holding near the twp-month high set this week and meeting buying interest on retracements towards 112.90, a Fibonacci support. The pair struggled for direction as poor US employment data should have sent it lower, but higher Treasury yields dented yen's demand. Also, limiting the advance was the sour tone in worldwide equities as most major indexes closed in the red. Japan will release its preliminary May leading and coincident index during the upcoming Asian session, expected with the first expected above April's figure, but the second below it. Technically, the pair presents a neutral-to-bullish stance in the short term, as in the 4 hours chart, the 100 and 200 SMAs keep advancing below the current level, with the shortest accelerating above the largest, but technical indicators have lost upward strength and hover around their mid-lines. Upcoming direction depends on the NFP outcome, with a huge positive surprise favoring an advance up to 114.40 a major static resistance area.
Support levels: 112.90 112.50 112.10
Resistance levels: 113.70 114.05 114.40
GBP/USD
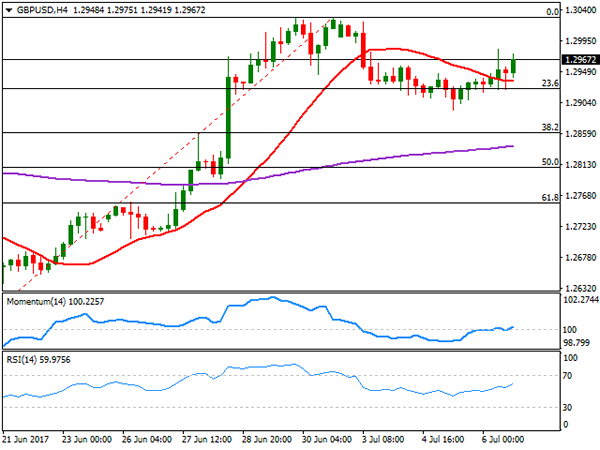
Broad dollar's weakness and comments from BOE´s Ian McCafferty sent the GBP/USD pair to its highest in three days, with the pair settling near a daily high of 1.2983. Investors preferred to sell the American currency ahead of US employment data, particularly after some minor reports released this Thursday came worse-than-expected, while McCafferty said that raising rates would not only be justified, but also "prudent." He was one of three members of the MPC that voted for a hike in the latest meeting, surprising little markets, but backing the Pound anyway. The UK will release industrial and manufacturing May figures this Friday, alongside with the same month trade balance, which may set the tone for the pair, ahead of the US employment report. After correcting down to 1.2892 this week, the pair is now poised to resume its advance, although gains beyond the critical 1.3000 threshold are still in doubt, as the pair has been unable to sustain gains beyond it this year, topping in May at 1.3047. In the short term, the 4 hours chart shows that the price recovered after meeting buying interest around the 23.6% retracement of its latest daily rally at 1.2925, while also setting above the 20 SMA that lost its bearish strength. In the same chart, technical indicators aim modestly higher, with the RSI at 59, but the Momentum still stuck around its mid-line.
Support levels: 1.2925 1.2890 1.2860
Resistance levels: 1.2995 1.345 1.3080
GOLD
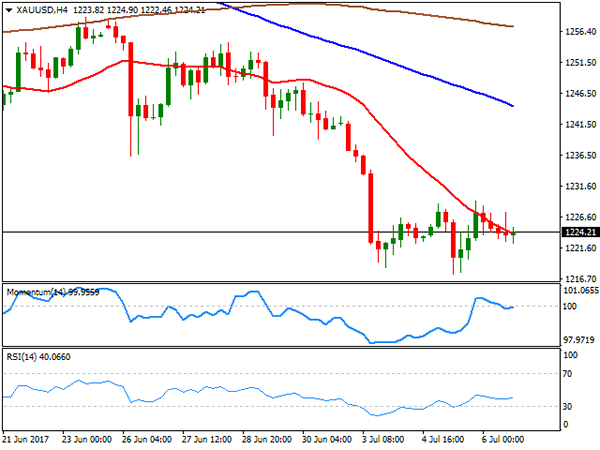
Spot gold closed the day at $1,224.10 a troy ounce, little changed for a third consecutive day, and with a modest advance supported by dollar and equities' weakness. Speculative interest was left clueless after the latest FOMC Minutes showed that US policymakers are split on the rate hike outlook, hoping some clearer clues will surge from the US employment report to be released this Friday. The commodity heads into the Asian session near the 2-month low set at 1,217.40, now the immediate support, with a bearish tone according to technical readings, given that in the daily chart, the price remains far below its 20 and 100 DMAs, while hovering around its 100 DMA, as technical indicators resumed their declines within bearish territory. In the 4 hours chart, the price hovers around a bearish 20 SMA, unable to detach from it, while the Momentum indicator heads nowhere around its 100 level and the RSI indicator hovers around 40, all of which limits the upward potential. Still a disappointing US report may boost the commodity, with gains above 1.228.00 required to confirm additional gains ahead next week.
Support levels: 1,217.40 1,208.30 1,198.20
Resistance levels: 1,228.00 1,236.50 1,241.80
WTI CRUDE OIL
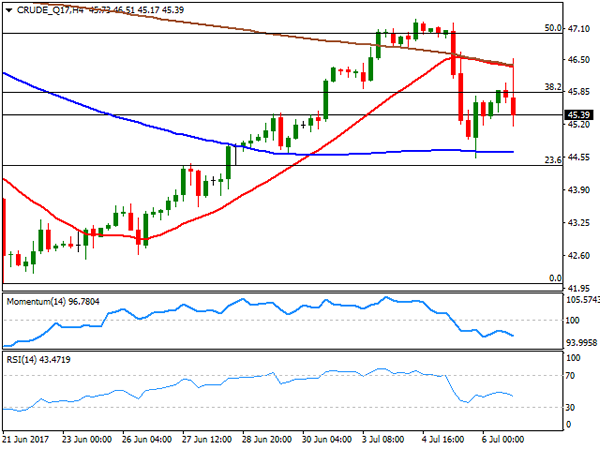
Crude oil prices surged over 2% intraday, but ended the day in the red, with West Texas Intermediate futures ending the day around $45.40 a barrel. WTI traded as high as 46.51, boosted by the EIA report that showed that US crude supplies dropped by 6.3 million barrels in the week ended June 30th, largely surpassing the 1.6 million barrels decline forecasted. The API report released late Wednesday also reported a slide of 5.76 million barrels. Gasoline investors also decline, by 3.7 million barrels. Yet at the end of the day, speculation that the worldwide glut will persist, weighed more. The daily chart shows that the price settled at the lower end of its Wednesday's range, still above a flat 20 SMA, but below the 38.2% retracement of its latest decline, the immediate resistance at 45.90. The Momentum indicator in the mentioned chart aims marginally higher within neutral territory, while the RSI turned south, heading lower around 47. In the 4 hours chart, the technical outlook is bearish, with technical indicators heading sharply lower within negative territory and with the price having been rejected from convergent 20 and 200 SMAs at 46.60.
Support levels: 44.40 43.70 43.10
Resistance levels: 45.90 46.60 47.20
DJIA
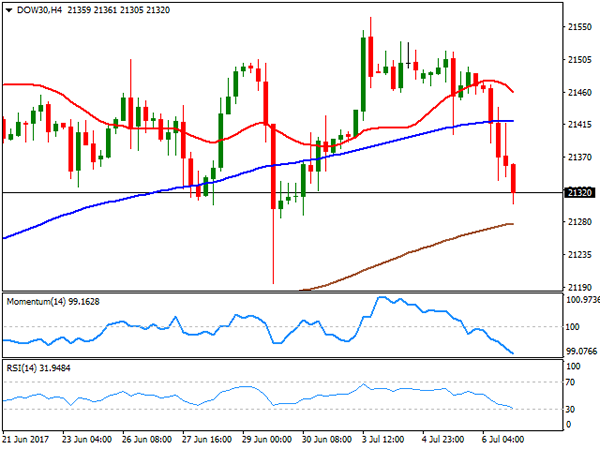
Wall Street plunged, with the Dow Jones Industrial Average posting a three-digit lost of 158 points, and settled at 21,320.04. The Nasdaq Composite shed 1.0%, or 61 points, and closed at 6,089.46, its lowest since mid May, while the S&P ended at 2,409.75, down by 22 points. The decline was led by technical and energy shares, while the negative tone of their overseas counterparts weighed on investors' mood. Within the Dow, only two members closed up, El du Pont that added 0.42%, and Wall-Mart that closed 0.33% higher. General Electric on the other hand, led decliners, down 3.91%, followed by Intel that shed 1.99%. The daily chart for the DJIA shows that the index settled below its 20 DMA, whilst technical indicators entered bearish territory with a sharp downward slope, maintaining the risk towards the upside. In the 4 hours chart, technical indicators also head sharply lower, now nearing oversold territory, whilst the index accelerated further below its 20 and 100 SMAs. The 200 SMA stands as a key support at 21,278, with a break below it favoring a retest of last week's low at 21,195.
Support levels: 21,305 21,278 21,228
Resistance levels: 21,361 21,417 21,459
FTSE100
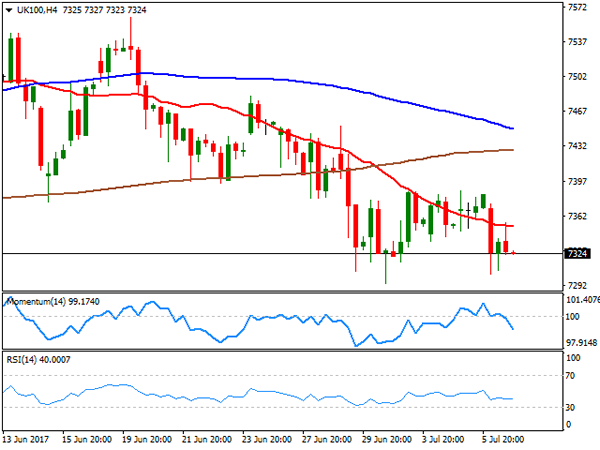
The FTSE 100 turned back south this Thursday, ending the day down 30 points at 7,337.28, following the lead of its European counterparts, undermined by new evidence that the ECB is on its way towards a tighter economic policy. The mining sector led the way lower within the Footsie, with Glencore leading decliners with a 2.52% loss, followed by Fresnillo that shed 2.45%. Associated British Foods was the best performer, up 2.57%, followed by Barclays that added 2.42%. The technical outlook for the index is bearish, as in the daily chart, it fell sharply from its 100 DMA, currently at 7,372, whilst technical indicators head south within bearish territory. Shorter term, and according to the 4 hours chart, the risk is also towards the downside, with the index contained by a bearish 20 SMA, the Momentum indicator heading sharply lower within bearish territory, and the RSI indicator heading south around 39, all supporting further declines on a break below the weekly low of 7,327.
Support levels: 7,327 7,294 7,256
Resistance levels: 7,372 7,424 7,452
DAX
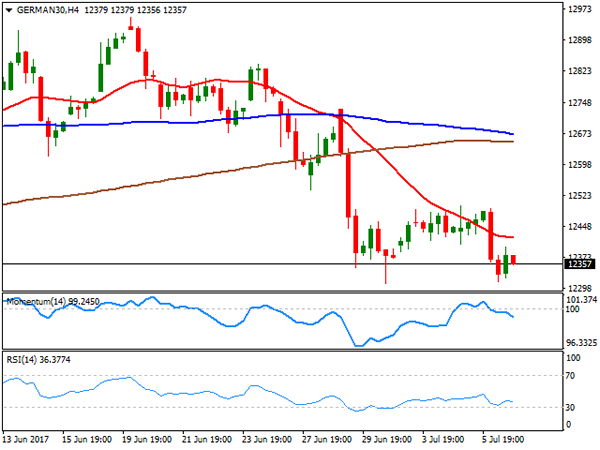
The German DAX closed the day at 12,381.25, down 72 points or 0.58%, with European indexes dragged lower by industrial and pharmaceutical equities. Receding dollar's demand pushed local currencies higher, alongside with speculation of upcoming monetary policy tightening, also weighing on local shares. Within the DAX, only five members closed higher, with Volkswagen leading the advance with a 1.31% gain, followed by Commerzbank that added 1.23%. ProSiebenSat.1 led decliners, down 4.06%, followed by Bayer that shed 2.29%. The index fell further in after-hours trading, entering the Asian session around 12,350 and with a strongly bearish technical stance, as in the daily chart, the index is pressuring its 100 DMA, whilst technical indicators resumed their declines, now nearing oversold levels. In the 4 hours chart, technical readings also favored the downside, as the benchmark stands below a bearish 20 SMA, whilst technical indicators also head south within bearish territory.
Support levels: 12,310 12,272 12,239
Resistance levels: 12,398 12,445 12,490
USDCAD Pauses Downtrend After RSI Reaches Oversold Levels
USDCAD has been in a downtrend since the May 5 high of 1.3792. After falling from this more than one-year high, the pair touched a low of 1.2911 on July 4 and made a slight correction higher. However, prices are finding it difficult to enter back into the key 1.3000 handle.
The bearish market structure remains intact and there are no signs of a reversal in the trend yet. USDCAD is trading below the 200-day moving average, which asserts a bearish view. Meanwhile the downward sloping 50-day MA is suggesting there is downside pressure in the market.
A further decline from current levels would see a re-test of the July 4 low at 1.2911, which would act as an immediate support level. A break below this could accelerate downside momentum to bring a resumption of the downtrend with scope to target the next support level at the September 7 low of 1.2821 and then from here the June 23 low of 1.2677 would act as another support area.
The daily RSI momentum indicator is attempting to rise out of oversold territory, suggesting that the market could retrace in the near-term or consolidate recent losses. If the RSI continues to move higher and further away from oversold levels at 30, then USDCAD could pick up momentum and rise. But the pair could find immediate resistance at 1.3013 (July 5 high). A successful break above this barrier would bring into view a key psychological level at 1.3200. Another important resistance area is located at the 200-day MA at 1.3340, which capped upside moves on June 21 and 22.
Looking at the daily chart, only a rise above the 200-day MA would change the current bearish bias and bring the market to a more neutral phase. A break above resistance at 1.3550 would shift the bias to a more bullish one.
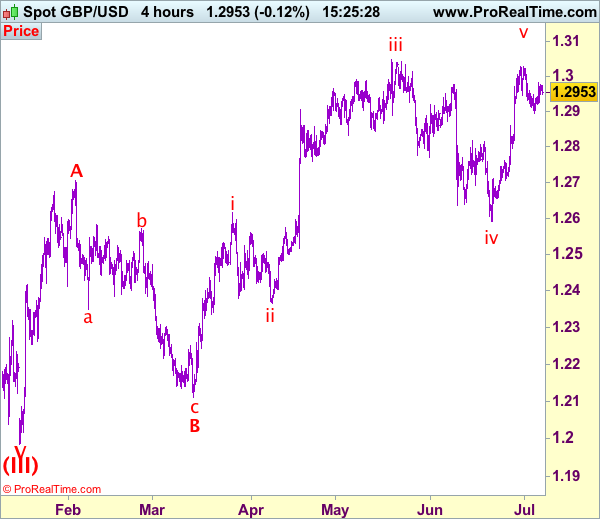
Trade Idea: GBP/USD – Buy at 1.2835
GBP/USD – 1.2959
Recent wave: Wave V of larger degree wave (III) has ended at 1.1986 and major correction has commenced from there for gain to 1.3000 and 1.3140-50
Trend: Near term up
Original strategy :
Buy at 1.2835, Target: 1.3000, Stop: 1.2800
Position: -
Target: -
Stop: -
New strategy :
Buy at 1.2835, Target: 1.3000, Stop: 1.2800
Position: -
Target: -
Stop:-
Although sterling found support at 1.2893 earlier this week and recovered, reckon upside would be limited to 1.2985-90 and near term downside risk remains for the retreat from 1.3030 to bring retracement of recent rise, below said support at 1.2893 would extend weakness to previous resistance at 1.2861 (now support), however, reckon 1.2830-35 (50% Fibonacci retracement of 1.2640-1.3030) would limit downside and bring another rise later, above 1.3000 would bring test of said resistance at 1.3030, break there would extend the rise from 1.2589 low towards recent high at 1.3048 but break there is needed to retain bullishness and bring subsequent headway towards 1.3090-00.
Our preferred count on the daily chart is that cable's rebound from 1.3500 (wave (A) trough) is unfolding as a wave (B) with A ended at 1.7043, followed by triangle wave B and wave C as well as wave (B) has ended at 1.7192, the subsequent selloff is the larger degree wave (C) which is still unfolding with minor wave (III) of larger degree wave 3 ended at 1.1986, hence wave (IV) correction is in progress which could either be a triangle wave (IV) of a complex formation but upside should be limited to 1.3500 and price should falter well below 1.4000, bring another decline in wave (V) of 3 for weakness to 1.1500, then 1.1200.
On the downside, whilst initial pullback to 1.2900 is likely, reckon 1.2861 (previous resistance turned support) would limi downside and 1.2830-35 should hold, bring such a rise. Below support at 1.2794 would abort and signal top is formed instead, risk further fall to 1.2750, then towards 1.2706 support.
Trade Idea: GBP/JPY – Buy at 145.15
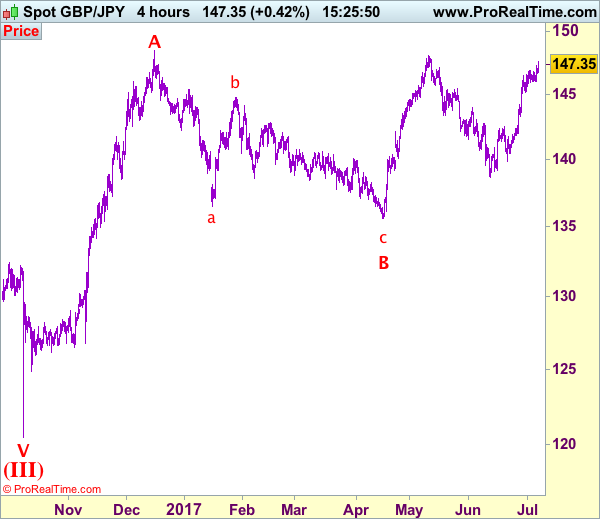
GBP/JPY - 147.35
Recent wave: Medium term low formed at 120.50 and (A)-(B)-(C) major correction has commenced with (A) leg ended at 148.45, hence wave (B) is unfolding for retreat to 131.00-10.
Trend: Near term up
Original strategy:
Buy at 145.15, Target: 147.15, Stop: 144.55
Position: -
Target: -
Stop: -
New strategy :
Buy at 145.15, Target: 147.15, Stop: 144.55
Position: -
Target: -
Stop:-
As sterling has surged again after brief pullback, adding credence to our bullish count that recent upmove is still in progress and upside bias remains for further gain to 147.50-60, then towards recent high at 148.10, having said that, loss of near term upward momentum should prevent sharp move beyond 148.50-60 and price should falter below 149.00-10, risk from there is seen for a retreat later.
In view of this, would not chase this rise here and we are looking to buy sterling on subsequent pullback as support at 145.15 should limit downside. Below 144.60-70 would defer and risk test of previous resistance at 144.20, break there would abort and signal a temporary top is formed, bring correction of recent rise to 143.90-00 but support at 143.30 should remain intact.
Our preferred count is that larger degree wave V with circle is unfolding from 251.12 with wave (I) 219.34, (II): 241.38 and wave (III) is subdivided into 1: 192.60, 2: 215.89 (23 Jul 2008) and wave 3 ended at 118.87 earlier in 2009. The correction from there to 162.60 is wave 4 which itself is a double three and is labeled as first a-b-c ended at 151.53, followed by wave x at 139.03, 2nd a ended at 162.60, 2nd b at 146.75 and 2nd c leg of wave 4 ended at 163.00. Therefore, the decline from 163.00 to 116.85 is now treated as wave 5 which also marked the end of larger degree wave (III), hence wave (IV) major correction has commenced for retracement of the wave (III) from 241.38 and upside target at 183.95-00 (50% Fibonacci retracement of the wave (II) from 241.38) had been met, a drop below 160.00 would suggest wave (IV) has ended at 195.85, bring decline in wave (V) for initial weakness to 130 (already met) and 120.
Data Clues
Data released on Thursday indicated that U.S. private employers hired fewer workers than expected in June and applications for unemployment benefits last week increased for a 3rd straight week. It would therefore appear that there is some 'cooling' in the US Labour Market as it approaches full employment.
The ADP National Employment Report indicated that private sector payrolls increased by 158K jobs in June, down from the 230K positions created in May and below many expectations for a gain of 185K. As a result of these lackluster figures, that are often correlated with Non-Farm Payroll data, USD was sold off during the day.
The G20 meeting starts today in Hamburg, Germany. Of note, will be the first meeting of President Trump and President Putin as well as his first meeting with his Chinese counterpart Xi Jinping. Trade discussions will be 'strained' as many have criticized the US's protectionism stance.
EURUSD gained nearly 0.7% on the day trading from 1.13294 to as high as 1.14244 and is currently trading at 1.1410.
After some early USD buying that saw USDJPY trade up to 113.468, the bears entered the market pushing USDJPY down to 112.882. Since hitting that low USDJPY has retraced to trade above yesterday's highs, currently trading at 113.70, as the Bank of Japan announced its first unlimited fixed-rate bond purchase since February.
GBP benefited from USD selling as it climbed from a low of 1.29192 to post a 0.3% gain on the day to reach a high of 1.2983. GBPUSD is currently trading at 1.2955.
CAD remains strong against USD as the markets have priced in a rise in Canadian interest rates sooner rather than later. USDCAD traded 0.2% lower to establish a low of 1.29227 on the day before retracing higher. Currently USDCAD is trading around 1.2990.
Gold seems to have stabilized above a technical support area around $1,219 and traded as high as $1.229.10 on Thursday before retracing back to currently trade at $1,220.50.
After falling 4% on Wednesday, as Russia claimed to be opposed to any additional production cuts, Oil recovered as the EIA reported Crude Oil inventories falling to 6.299 Million, significantly more than the expected draw of 2.283 Million. US strategic oil reserves are now at a 12-year low, but increased Shale production provides 'insurance' against potential shortages i.e. the US does not need to store as much Oil as it used to. The initial reaction to the report saw WTI trade up from $45.80pb to $46.62pb (a 1.5% gain on the day) before retracing back to close near $45.50pb. WTI has given up yesterday's gains to currently trades around $45.15
Today at 13:30 BST:
Markets have been waiting for today's Non-Farm Payroll release with much anticipation. The recent tightening by the Fed, and their less hawkish tone of late, ensures that market sentiment will change dramatically if this release is wildly outside of the market consensus of 179K. Following May's weak and disappointing release of 138K, the Fed will be looking to see if this release further indicates a weakening economy, which will further impact the Fed's economic 'strategy' for the remainder of this year.
US Unemployment rate (Jun) will also be released. The figure is expected to remain at 4.3%, however, if the US labour market is tightening, we can expect to see a higher release which will further impact US economic policy is the coming months.
Canadian Unemployment (Jun) is expected to remain at 6.6%. Any dramatic change from this expectation will impact Canadian economic policy as the markets are fully expecting an imminent rate rise, possibly as early as next week.
At 14:00 BST Bank of England Governor Carney is scheduled to speak which is likely to cause volatility in GBP.
Trade Idea: EUR/JPY – Buy at 128.00
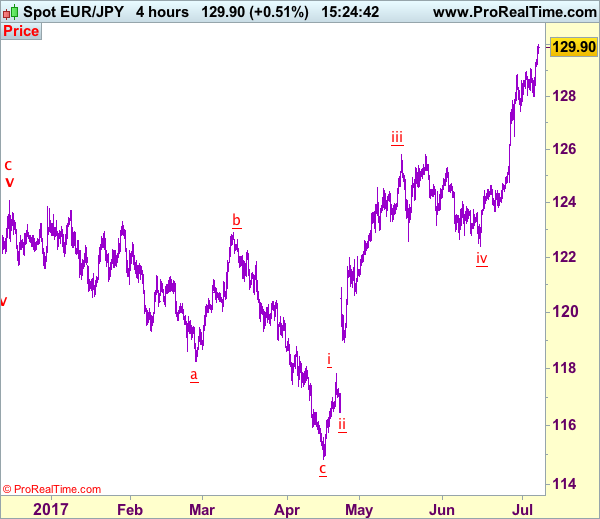
EUR/JPY - 129.90
Recent wave: wave v of (C) ended at 94.12 and major correction in wave A has ended at 149.79
Trend: Near term up
Original strategy:
Buy at 127.00, Target: 129.00, Stop: 126.40
Position: -
Target: -
Stop: -
New strategy :
Buy at 128.00, Target: 130.50, Stop: 127.40
Position: -
Target: -
Stop:-
As the single currency has surged again after brief pullback, adding credence to our bullish view that recent upmove is still in progress and upside bias remains for further gain to 130.40-50, then towards 131.00, however, near term overbought condition should prevent sharp move beyond 131.50-60, risk from there has increased for a retreat to take place later.
In view of this, would not chase this rise here and we are looking to reinstate long on pullback as 128.00-10 should limit downside. Below support at 127.44 would abort and signal a temporary top is formed instead, bring correction to 127.00, then towards another previous support 126.49.
Our latest preferred count is that wave (ii) is ABC-X-ABC which ended at 123.33 and wave (iii) is unfolding with wave iii ended at 100.77, followed by wave iv at 111.57 and wave v as well as the wave (iii) has ended at 97.04, followed by wave (iv) at 111.43 and wave (v) has ended at 94.12 which is also the end of the larger degree v, this also implied the major wave (C) has also ended there, hence major correction has commenced from there with (A) leg unfolding in its lower degree wave c which has possibly ended at 145.69. Under this count, A-B-C wave (B) has commenced with A leg ended at 136.23, wave B at 143.79 and wave C has possibly ended at 149.79.
Our larger degree count is that the decline from 139.26 is wave (C) and is sub-divided into a diagonal triangle i-ii-iii-iv-v with wave i - 105.44, wave ii- 123.33, wave iii - 97.03, wave iv - 111.43, followed by the final wave v as well as the end of wave (C) at 94.12, this also mark the bottom of larger degree wave B. Under this count, major rise in wave C has commenced as an impulsive wave with minor wave III ended at 145.69, wave V is still in progress for further gain to 150.00. Having said that, this so-called wave V could well be the first leg of larger degree 5-waver wave C and this wave C should bring at least a retest of wave A top at 169.97 (July 2008).
USD/CAD Daily Outlook
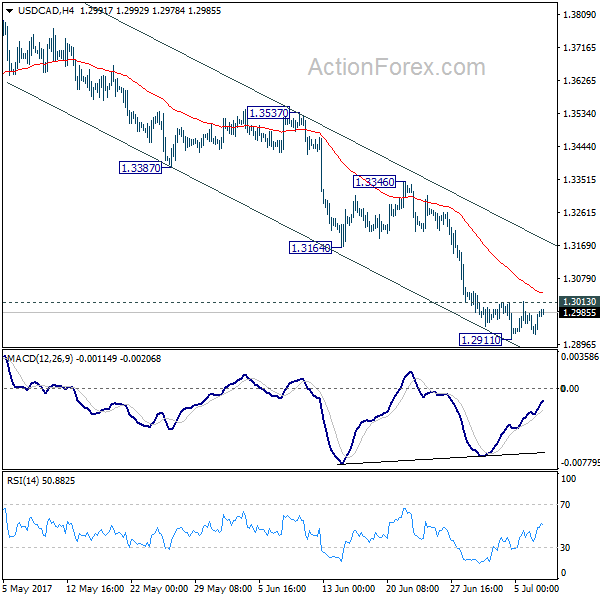
Daily Pivots: (S1) 1.2939; (P) 1.2961; (R1) 1.3000; More....
Intraday bias in USD/CAD remains neutral for the moment. Considering bullish convergence condition in 4 hour MACD, break of 1.3013 will indicate short term bottoming. In such case, stronger rebound would be seen back to 1.3164/3346 resistance zone first, before staging another fall. Overall, we'd expect decline from 1.3793 to extend later and sustained trading below 1.2968 cluster support, 61.8% retracement of 1.2460 to 1.3793 at 1.2969 will pave the way to retesting 1.2460 low.
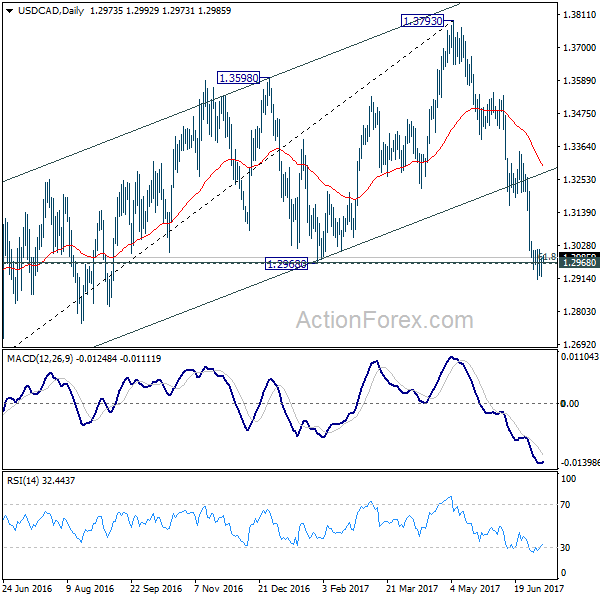
In the bigger picture, price actions from 1.4689 medium term top are seen as a correction pattern. The second leg should have finished at 1.3793. Break of 1.2460 will extend such correction to 50% retracement of 0.9406 to 1.4869 at 1.2048. At this point, we'd look for strong support from there to contain downside and bring rebound. However, firm break there will target 100% projection of 1.4689 to 1.2460 from 1.3793 at 1.1564.
Currencies: Will Payrolls Be Solid Enough To Put A Floor Under The Dollar?
Sunrise Market Commentary
- Rates: After the Bund sell-off, is it now the T-Note future?
Yesterday, a break below key support in the Bund changed sentiment. Today attention turns to a similar support area for the T-Note future. A strong payrolls report, our favourite, may at least test the area. A break would be a strong confirmation that the trend in yields is on a firm upward trajectory. . - Currencies: Will payrolls be solid enough to put a floor under the dollar?
Yesterday, the euro outperformed as European yields broke important technical levels. Today, the focus will be on the US payrolls. We expect a solid report. If so, the dollar could receive additional interest support. The G20 and the correction on the equity markets remain wildcards for global FX trading
The Sunrise Headlines
- The global equity selloff that started in Europe continued in the US with end-of-day losses of the S&P 500 at -0.94%. Asian equities are also losing ground, but the losses are moderate given yesterday’s correction on WS.
- The June US non-manufacturing ISM improved from 56.9 to 57.4, indicating ongoing solid growth in the sector.
- Germany industrial production printed at a strong 1.2 % M/M and 5.0 Y/Yin May against the April 0.7 % M/M (2.8% Y/Y) beating the consensus expectations of 0.2% M/M (4% Y/Y).
- The Bank of Japan said it would buy an unlimited amount of bonds, as it sought to end domestic interest rates being pushed higher by the broad sell-off in bonds. This signals the BoJ’s strong commitment to yield curve control policy.
- The four-nation Saudi bloc pledged it will take new political, economic and legal measures against Qatar after the latter rejected the demand list of the bloc that followed a closing of the ties between Qatar and Iran.
- The main event on the eco-calendar is the US payrolls report. May industrial production figures will also be released for the UK. The G-20 is a wildcard with political tensions at high levels
Currencies: Will Payrolls Be Solid Enough To Put A Floor Under The Dollar?
Solid payrolls to put a floor for the dollar?
Yesterday morning, one could have logically assumed that US data would drive USD trading. It turned out different. The German 10-year yield cleared the important 0.50% mark and interest rate differentials narrowed in favour of the euro. US data were mixed, but only of second tier importance for USD trading. EUR/USD rebounded north of 1.14 and closed the session at 1.1423 (from 1.1352). USD/JPY showed no clear trend as the rise in core yields was counterbalanced by a setback in global equities. The USD/JPY hovered sideways in the lower half of the 113 big figure and closed the session at 113.22.
This morning, Asian equities are joining the correction from WS yesterday, but the losses remain modest. Yesterday, USD/JPY showed no clear trading pattern. This morning, the pair again ignores the correction in equities. The pair profits from the rise in US and European bond yields and trades in the 113.65 area. EUR/JPY also extends its uptrend and is nearing the 130 barrier. The EUR/USD also remains well bid (1.1420 area).
Today, the developments in European bond and equity markets and the G20 still deserve attention as potential drivers for global FX trading but the US payrolls will take centre stage. We expect the payrolls to be solid (at least meeting the consensus estimate of 178 000 net additional jobs) despite yesterday’s disappointing ADP report. The average hourly earnings are expected to rise 0.3% M/M and 2.6% Y/Y. A gradual rise in wages could ease markets’ doubts on the Fed normalisation process. Such a scenario would give the US currency renewed interest rate support. Especially short-term interest rate differentials should re-widen than, which is USD supportive. If so, USD/JPY could rise further. Sentiment on the cross rate is improving as wider interest rate differentials have become at least as important as the swings in equities/sentiment on risk. The question is whether this pattern will continue in case of a ‘real’ risk-off correction. The recent high in EUR/USD should be confirmed as a solid resistance. Having said this, if we are wrong and the payrolls disappoint, the dollar remains very vulnerable.
Technical picture: USD looking for a bottom
A combination of hawkish ECB comments and weaker US eco data pushed EUR/USD above the 1.1300/66 resistance area last week with a new high at 1.1448. Next resistance is seen in the 1.15 area. LT-correction tops are coming in at 1.1616/1.1714. A break would end the long consolidation period that followed the sharp decline of EUR/USD in 2014/early 2015. Such a key area will be difficult to break for now. A return below the 1.13 area would be a first indication of a loss in upside momentum. 1.1119 is the next important support.
The USD/JPY rally ran into resistance in early May and the pair returned lower in the 108.13/114.37 range. The post-Fed USD rebound pushed the pair above the 112.13 correction top last week, but follow-through gains remain modest. So, the jury is still out. A sustained break above 114.37 would improve the ST-picture.
EUR/USD: will payrolls be strong enough to trigger a U-turn in favour of the dollar?
EUR/GBP
Sterling still driven by dollar and euro moves
Yesterday, there were no eco data in the UK today. So, sterling trading was driven by the overall rebound of the euro. The intraday gains of EUR/GBP remained modest though even as the pair regained the 0.88 barrier later in the session. The pair closed the session at 0.8806. Cable drifted cautiously higher yesterday, supported by the rise in EUR/USD. The pair closed the session at 1.2971. One shouldn’t draw firm conclusions from yesterday’s EUR/GBP price action. If anything, the modest rise of EUR/GBP suggests that underlying sentiment on sterling remained constructive short-term.
Today, the UK Halifax House Prices, the May production data and the trade balance data will be published. The data might have some intraday impact on sterling trading. However, data of the month of May are not that timely. So, they won’t change the market assessment on the BoE approach. Decent eco data might be a mildly supportive for sterling. However, we don’t expect them to help break key technical levels. The US payrolls might also trigger intraday volatility in the major sterling cross rates.
From a technical point of view, EUR/GBP set a minor top north of the 0.8854/66 resistance (2017 top). A sustained break didn’t occur, causing a correction on the recent EUR/GBP rebound. A return below the 0.8655 correction low would indicate easing pressure on sterling, but such a break lower will be difficult. A EUR/GBP buy-on-dips approach remains favoured.
EUR/GBP topside test rejected. Not clear trend for now
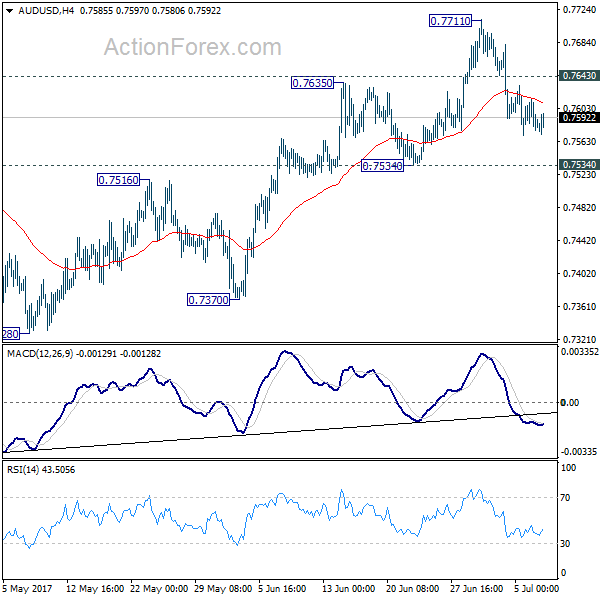
Trade Idea: AUD/USD – Sell at 0.7650
AUD/USD – 0.7593
Recent wave: Wave 5 ended at 1.1081 and major correction has commenced for fall to 0.7000 and then towards 0.6500-10
Trend: Near term up
Original strategy :
Sell at 0.7650, Target: 0.7500, Stop: 0.7690
Position: -
Target: -
Stop: -
New strategy :
Sell at 0.7650, Target: 0.7500, Stop: 0.7690
Position: -
Target: -
Stop:-
Although aussie found support at 0.7571 and recovered, if our view that top has been formed at 0.7712 is correct, upside should be limited to 0.7650-60 and bring another retreat later, below said support at 0.7571 would add credence to this view, bring retracement of recent rise to 0.7535 support, break there would extend further fall towards 0.7500 which is likely to hold from here..
In view of this, we are looking to sell aussie on recovery as 0.7650 should limit upside. Above 0.7683 resistance would abort and suggest the retreat from 0.7712 has ended instead, bring retest of this level first, then towards 0.7750.
On the 4-hour chart, the move from 0.8066 is the wave 5 with i: 0.8860, ii: 0.8315, wave iii is an extended move ended at 1.0183, iv: 0.9706 and wave v has ended at 1.1081 (also the top of entire wave 5). The subsequent selloff is the major correction which is unfolding as ABC-X-ABC and 2nd A leg has ended at 0.8848, followed by a-b-c wave B which ended at 0.9758, hence, 2nd C wave is now in progress and indicated downside target at 0.7000 and 0.6950 had been met, so further fall to 0.6710-20 cannot be ruled out.

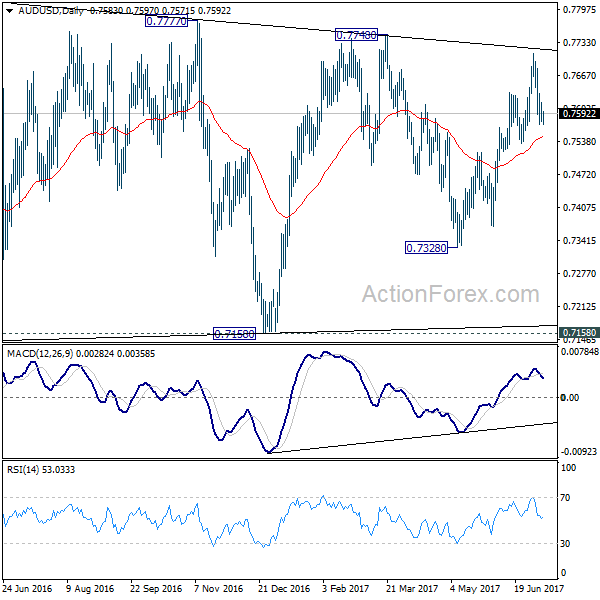
AUD/USD Daily Outlook
Daily Pivots: (S1) 0.7569; (P) 0.7591; (R1) 0.7607; More...
No change in AUD/USD's outlook as price actions from 0.7711 are viewed as a corrective move so far. Intraday bias remains neutral at this point. With 0.7534 support intact, another rise is in favor. Above 0.7643 will bring retest of 0.7711. Break will extend the rally from 0.7328 to 0.7748 resistance and above. At this point, there is no clear sign of range breakout yet. Hence, we'd be cautious on topping again as it approaches medium term fibonacci level at 0.7849. On the downside, break of 0.7534 will indicate near term reversal and turn bias back to the downside for 0.7370 support.
In the bigger picture, we're still treating price actions from 0.6826 low as a corrective pattern. And, as long as 38.2% retracement of 0.9504 to 0.6826 at 0.7849 holds, long term down trend from 1.1079 is expected to resume sooner or later. Break of 0.6826 low will target 0.6008 key support level. However, firm break of 0.7849 will indicate that rise from 0.6826 is developing into a medium term rebound, rather than a sideway pattern. In such case, stronger rise should be seen to 55 month EMA (now at 0.8096) and above.