Sample Category Title
Trade Idea : EUR/USD – Buy at 1.1355
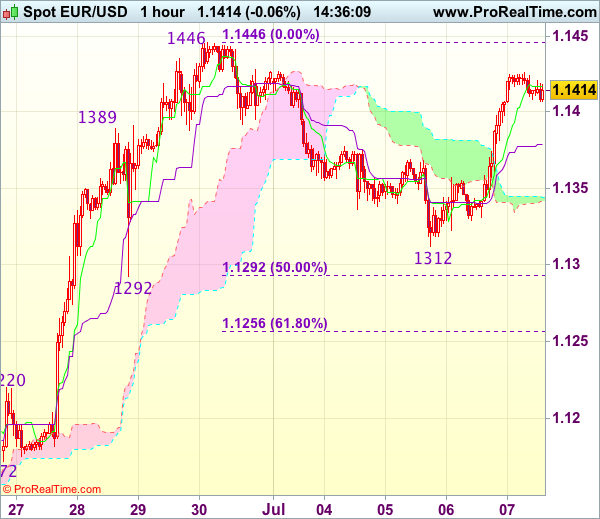
EUR/USD - 1.1415
Most recent candlesticks pattern : N/A
Trend : Near term up
Tenkan-Sen level : 1.1417
Kijun-Sen level : 1.1379
Ichimoku cloud top : 1.1344
Ichimoku cloud bottom : 1.1341
Original strategy :
Buy at 1.1355, Target: 1.1455, Stop: 1.1320
Position : -
Target : -
Stop : -
New strategy :
Buy at 1.1355, Target: 1.1455, Stop: 1.1320
Position : -
Target : -
Stop : -
As the single currency staged a strong rebound after finding renewed buying interest at 1.1312, suggesting the pullback from last week’s high of 1.1446 has ended there and retest of this level would be seen, however, break there is needed to confirm recent upmove has resumed for headway to 1.1475-80 but price should falter below 1.1500.
In view of this, we are looking to buy euro on dips but one should exit on subsequent rally. Below 1.1325-30 would abort and signal the rebound from 1.1312 has ended, bring another test of this level, then 1.1292 (previous support as well as 50% Fibonacci retracement of 1.1139-1.1446).
Trade Idea : USD/JPY – Stand aside
USD/JPY - 113.75
Most recent candlesticks pattern : N/A
Trend : Near term up
Tenkan-Sen level : 113.47
Kijun-Sen level : 113.42
Ichimoku cloud top : 113.22
Ichimoku cloud bottom : 113.19
New strategy :
Stand aside
Position : -
Target : -
Stop : -
Although the greenback has risen again and broke above resistance at 113.69 and initial upside risk remains for recent upmove to extend gain to 114.00, loss of momentum should prevent sharp move beyond 114.25-30 and reckon 114.50-55 would hold from here, risk from there has increased for a retreat to take place later.
In view of this, would not chase this rise here and would be prudent to stand aside ahead of US opening. Below the Kijun-Sen (now at 113.42) would bring pullback to 113.10-15 but only break of support at 112.74-88 would signal top is formed, bring correction of recent rise to 112.60, then 112.40.

Daily Technical Outlook And Review: EUR/USD, GBP/USD, AUD/USD, USD/JPY, USD/CAD, USD/CHF, DOW 30, GOLD
A note on lower timeframe confirming price action...
Waiting for lower timeframe confirmation is our main tool to confirm strength within higher timeframe zones, and has really been the key to our trading success. It takes a little time to understand the subtle nuances, however, as each trade is never the same, but once you master the rhythm so to speak, you will be saved from countless unnecessary losing trades. The following is a list of what we look for:
- A break/retest of supply or demand dependent on which way you're trading.
- A trendline break/retest.
- Buying/selling tails ... essentially we look for a cluster of very obvious spikes off of lower timeframe support and resistance levels within the higher timeframe zone.
- Candlestick patterns. We tend to only stick with pin bars and engulfing bars as these have proven to be the most effective.
We typically search for lower-timeframe confirmation between the M15 and H1 timeframes, since most of our higher-timeframe areas begin with the H4. Stops are usually placed 1-3 pips beyond confirming structures.
EUR/USD
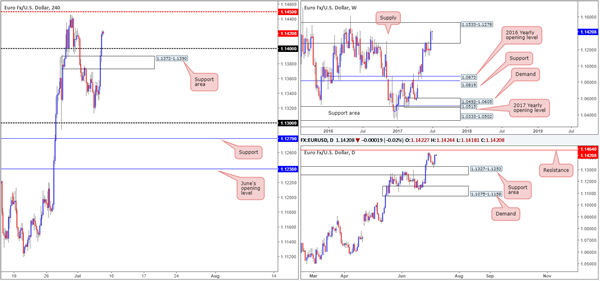
The EUR/USD bulls went on the offensive during yesterday's segment, running through both the H4 resistance area at 1.1372-1.1390, as well as the 1.14 handle. Influenced by lower-than-expected US ADP non-farm employment numbers and weekly unemployment figures, the major managed to end the day forming a nice-looking daily full-bodied bullish candle.
While we agree that the bulls look incredibly aggressive at this time, traders may want to note that weekly flow remains loitering within the walls of a major supply zone drawn from 1.1533-1.1278 that has capped upside since May 2015. Furthermore, we also see a strong-looking daily resistance level overhead at 1.1468. Therefore, the bears still clearly have a hand in this fight!
Our suggestions: Based on the above findings, our desk has their eye on a H4 supply zone positioned just above the 1.1450 mid-level line at 1.1529-1.1484 (seen higher on the screen) for potential shorts. Why this area? Well, we can see that it's located within the upper boundary of the said weekly supply zone, thus should we trade it, we can place stops above the weekly supply. What's more, it is positioned just above the aforementioned daily resistance line, and also of interest is how fresh the H4 supply zone is!
In addition, stop-loss orders above 1.1450 and the daily resistance line at 1.1464 will, should price strike our H4 supply, likely provide enough liquidity for the big boys to sell, and this is exactly where we want to be!
Data points to consider: US Employment figures at 1.30pm, US Fed Monetary policy report at 4pm GMT+1.
Levels to watch/live orders:
- Buys: Flat (stop loss: N/A).
- Sells: 1.1529-1.1484 ([waiting for a H4 bear candle – preferably a full, or near full-bodied candle –to form is advised] stop loss: ideally beyond the candle's wick).
GBP/USD
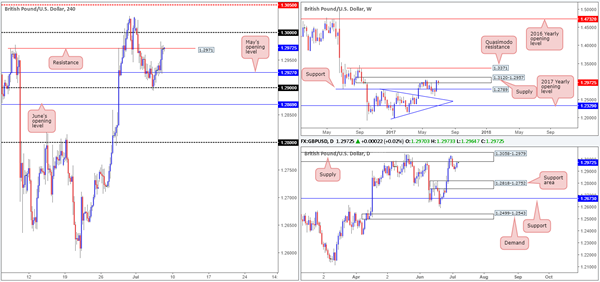
Cable struck the 1.29 handle on Wednesday and, as you can see, has remained in a bullish state since. Using May's opening level at 1.2927 to bolster price yesterday, the pair managed to lock horns with a H4 resistance level at 1.2971 going into the close. This level, and the nearby 1.30 psychological band located above, are of interest to our team this morning.
Looking over to the bigger picture, weekly price remains teasing a supply pegged at 1.3120-1.2957 and daily action is also seen kissing the underside of a supply base coming in at 1.3058-1.2979.
Now, looking at how the H4 candles have responded to the resistance line at 1.2971, we feel that the 1.30 boundary will likely be seeing some action today. This number – coupled with it being sited within both of the above said weekly and daily supply areas, is of interest to our desk this morning. However, one has to take into account that should the bears react from 1.30, there's a chance that 1.2971 could halt selling as it will effectively be a support at that stage.
Our suggestions: To confirm bearish intent from 1.30, we would need to see price close back below 1.2971. This, for us, would be enough evidence to suggest that the H4 candles are likely going to retest May's opening level at 1.2927, and possibly the 1.29 handle lurking just beneath it.
Data points to consider: UK manufacturing production at 9.30am, BoE Gov. Carney is also speaking sometime today. US Employment figures at 1.30pm, US Fed Monetary policy report at 4pm GMT+1.
Levels to watch/live orders:
- Buys: Flat (stop loss: N/A).
- Sells: 1.30 region ([waiting for a H4 bearish close to form below 1.2971 is advised before pulling the trigger] stop loss: ideally beyond the candle's wick).
AUD/USD
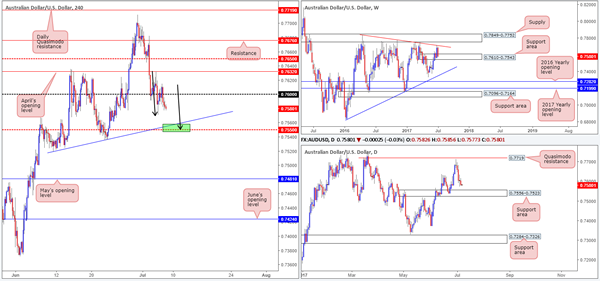
The AUD/USD charts are certainly interesting this morning! Over on the weekly chart, the bears continue to dig their way into a support area marked at 0.7610-0.7543. Stepping down a level to the daily chart, however, the unit shows space for price to continue pushing lower until we reach the support area formed at 0.7556-0.7523, which happens to be glued around the lower edge of the current weekly support area.
Now, this is where it gets exciting! As mentioned in Thursday's report, we are currently watching to see if H4 price can shake hands with the mid-level support at 0.7550 for potential longs. Here's our reasoning:
By and of itself, 0.7550 is a watched psychological band.
0.7550 merges with a H4 trendline support etched from the low 0.7519.
Should the H4 candles continue pressing lower, the approach will have formed a beautiful-looking AB=CD bullish formation terminating at 0.7550 (see black arrows).
0.7550 is also located within both of the above said weekly and daily support areas.
Our suggestions: So, put simply, we are going to be watching for price to strike 0.7550 today and hold firm. Should we spot H4 bulls coming into the picture from here in the shape of a (preferably) full-bodied bull candle, we would have no hesitation buying this market and targeting 0.76 as an initial take-profit zone.
Data points to consider: US Employment figures at 1.30pm, US Fed Monetary policy report at 4pm GMT+1.
Levels to watch/live orders:
- Buys: 0.7550 region ([waiting for a H4 bull candle – preferably a full, or near full-bodied candle –to form is advised] stop loss: ideally beyond the candle's tail).
- Sells: Flat (stop loss: N/A).
USD/JPY
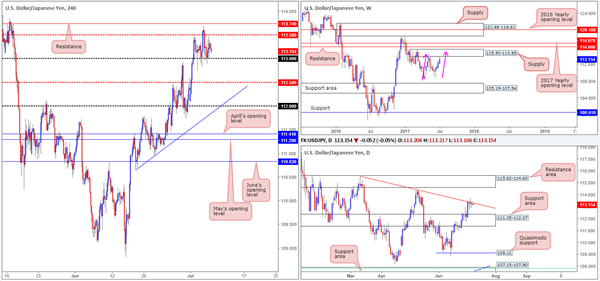
Over the past few days, the USD/JPY has been somewhat subdued. H4 action remains capped between the mid-level resistance at 113.50 and the 113 handle. Directly above this area sits a resistance level drawn from 113.74, and below 113, we do not see much in the way of support until the mid-level number 112.50.
Recent developments on the weekly timeframe show price came within a cat's whisker of connecting with the underside of supply pegged at 115.50-113.85. Assuming that the unit connects with this area, it could also form a possible AB=CD correction completing around 115 (see pink arrows). Sliding down to the daily timeframe, nonetheless, we can see that the candles remain capped by the trendline resistance taken from the high 115.50. What's also notable from a technical perspective is this has formed back-to-back indecision candles here.
Our suggestions: Seeing as the overall structure of this market remains unchanged, we still do not want to risk trading short until we know that the market is located within the aforementioned weekly supply. What would be ideal here, however, is for the said weekly AB=CD formation to complete, but that could be sometime before we see this come to fruition!
Data points to consider: US Employment figures at 1.30pm, US Fed Monetary policy report at 4pm GMT+1.
Levels to watch/live orders:
- Buys: Flat (stop loss: N/A).
- Sells: Flat (stop loss: N/A).
USD/CAD
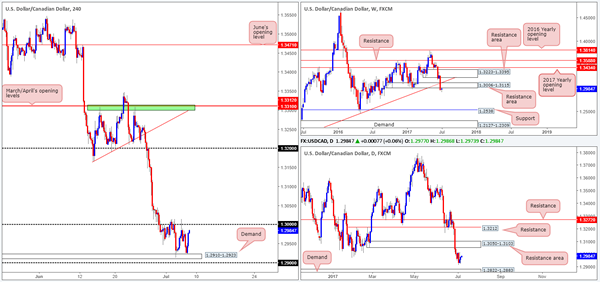
As can be seen from the H4 chart this morning, the unit remains consolidating between demand at 1.2910-1.2923 and the 1.30 boundary.
As highlighted in yesterday's report, we do not expect the bulls to breach the top edge of this range for the following reasons:
1.30 is a line watched by the majority of the market and seeing as it already held as resistance on Monday; we believe it is likely to continue holding firm.
Secondly, 1.30 also denotes the underside of a recently broken weekly demand base at 1.3006 (now acting as a resistance area).
The underlying trend is strongly pointing to the downside at the moment, and daily price shows space for the unit to continue lower until we reach demand pegged at 1.2822-1.2883.
Our suggestions: The desk has come to a general consensus that 1.30 could, if retested for a third time today, be an area we may consider a sell from. To decide this, however, we would require a H4 bearish candle to form following the retest, preferably in the shape of a full, or near-full-bodied candle. The first take-profit target, assuming that a sell comes to fruition, would be the aforementioned H4 demand, followed closely by the 1.29 handle.
Data points to consider: US Employment figures at 1.30pm, US Fed Monetary policy report at 4pm. Canadian employment figures at 1.30pm GMT+1.
Levels to watch/live orders:
- Buys: Flat (Stop loss: N/A).
- Sells: 1.30 region ([waiting for a H4 bear candle – preferably a full, or near full-bodied candle –to form is advised] stop loss: ideally beyond the candle's wick).
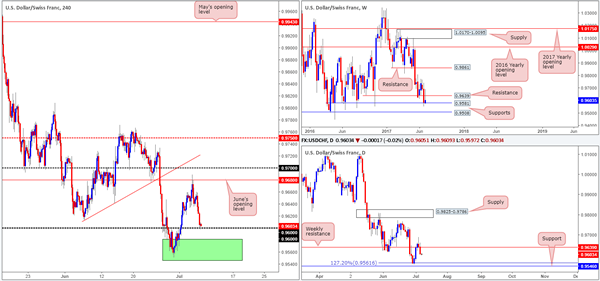
USD/CHF
Kicking this morning's report off with a look at the weekly timeframe, we can see that the resistance level at 0.9639 is holding firm for the time being. With that said, the bears have certainly not got it easy right now! Not only have they got to overcome the nearby support at 0.9581, but also the support level seen below it at 0.9508. Looking down to the daily timeframe, the next area of support can be seen at 0.9561, a 127.2% Fib ext. taken from the high 0.9808, followed closely by support at 0.9546.
Bouncing across to the H4 timeframe, the pair has recently crossed swords with the 0.96 handle and is, for now, holding firm. Personally, we do not feel 0.96 is going to hold for much longer though. The reason is simply because of the green area planted below (comprised of the weekly support level at 0.9581 and the daily support level pegged at 0.9546) being far more attractive.
Our suggestions: In the event that our analysis is correct and H4 price connects with the aforementioned green zone, our team will, once again, be looking to buy from here. Should a H4 bull candle, preferably a full-bodied candle, take shape, a long from here is high probability. The first area of trouble would obviously be the 0.96 line, so we'd be looking for price to overcome this before considering reducing risk to breakeven and taking some profits off the table.
Data points to consider: US Employment figures at 1.30pm, US Fed Monetary policy report at 4pm GMT+1.
Levels to watch/live orders:
- Buys: 0.9546-0.9581 ([waiting for a H4 bull candle – preferably a full, or near full-bodied candle –to form is advised] stop loss: ideally beyond the candle's tail).
- Sells: Flat (stop loss: N/A).
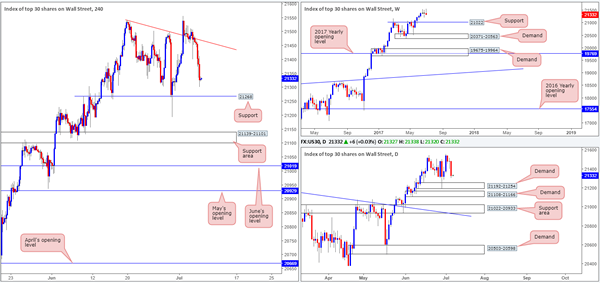
DOW 30
In recent trading, US equities took a turn for the worse and traded to a low of 21300 by the closing bell. What the move also did was tap our breakeven stop at 21323 for a reasonable profit as we already took 50% off the table upon striking the H4 trendline resistance extended from the high 21541.
With H4 price now lurking nearby a support level at 21268, where do we go from here? Well, 21268 hovers just ahead of a daily demand base coming in at 21192-21254, so if you're thinking of going long from the H4 level, be ready for a possible fakeout to take place! On the weekly timeframe, there's little stopping the unit from pulling all the way back to 21022: a support level which has relatively sound history as a resistance.
Our suggestions: We will be watching for H4 price to whipsaw through the current H4 support and touch gloves with the said daily demand. Should this come to fruition, our team would likely look to enter long again, with stops planted below the fakeout candle's tail, targeting the said H4 trendline resistance as an initial take-profit zone.
Data points to consider: US Employment figures at 1.30pm, US Fed Monetary policy report at 4pm GMT+1.
Levels to watch/live orders:
- Buys: 21323 region ([watching for H4 price to fake through this number and touch daily demand before looking to go long here] stop loss: ideally beyond the fakeout candle's tail).
- Sells: Flat (stop loss: N/A).
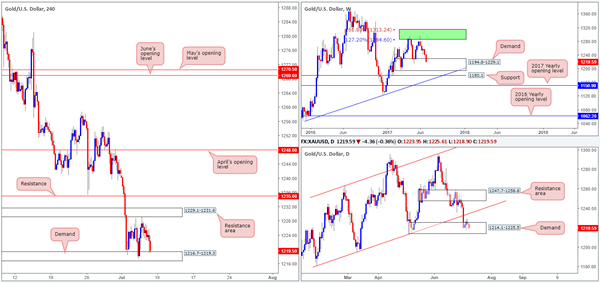
GOLD
(Much of the following gold report echoes similar thoughts to Thursday's analysis since structure remains unchanged).
As we noted in Thursday's report, H4 price continues to put together a consolidation zone formed by a resistance area penciled in at 1229.1-1231.6 and a demand base coming in at 1216.7-1219.3.
While traders who only focus on one timeframe may feel that this market is likely headed south due to the medium-term downtrend that we are currently in on the H4 timeframe, the higher-timeframe picture would suggest otherwise!
Scrolling over to the weekly timeframe, the buyers and sellers are seen battling for position within a demand zone at 1194.8-1229.1. This demand has held price higher once already back in early May, so there's a solid chance that history may repeat itself here. In conjunction with the weekly timeframe, daily price also shows the yellow metal trading from within a demand at 1214.1-1225.5, which happens to be positioned within the said weekly demand area.
While the H4 candles could remain bouncing from the H4 range extremes this week, we do not believe this consolidation will give way to the downside for reasons stated above. And, even if it does, we don't feel price will manage to get far beyond the lower edge of the daily demand at 1214.1.
As mentioned in yesterday's analysis, a level that has sparked some interest is the H4 resistance base penciled in at 1235.0, due to its connection with the daily trendline resistance seen extended from the low 1180.4. Still, shorting from this line would still entail one going against potential weekly buying power.
With that in mind, it would not be until a decisive H4 close above 1235.0 is seen, would our team consider buying as an option.
Our suggestions: Typically, we try to avoid trading against higher-timeframe flow. And selling 1235.0 would place us against potential weekly flow! Therefore, our desk is going to remain on the sidelines and wait and see if the H4 bulls can close above 1235.0 for possible longs up to April's opening level at 1248.0.
Levels to watch/live orders:
- Buys: Watching for 1235.0 to be consumed on the H4 chart before buying becomes an option.
- Sells: Flat (stop loss: N/A).
Daily Technical Analysis: EUR/USD Wave 3 Momentum After 1.13 Bounce And Trend Line Break
Currency pair EUR/USD
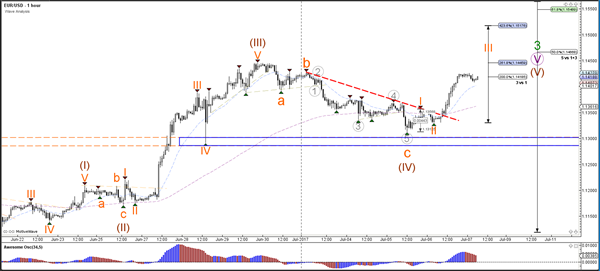
The EUR/USD used the broken top and support zone (blue box) to bounce up. Price then broke above the resistance trend line (dotted red) and is now heading towards the Fibonacci target of wave 5 vs 1+3 and the round level of 1.15.
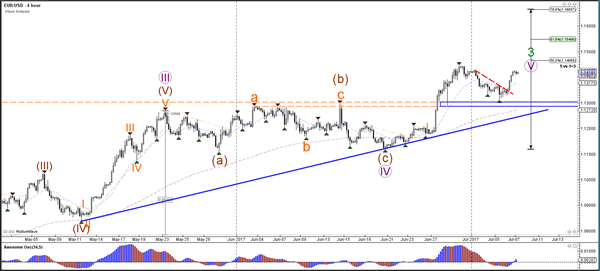
The EUR/USD is showing strong bullish momentum as part of a wave 3 (orange). Once price makes a correction, there could be a wave 4 and 5 before completing wave 5 (brown).
Currency pair USD/JPY
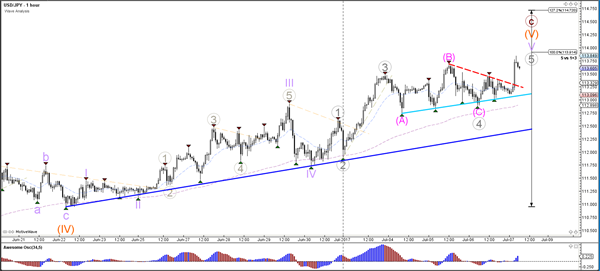
The USD/JPY extended the uptrend by showing a bullish break above the resistance trend line (dotted red). Price is now moving towards the Fibonacci targets of wave 5 vs 1+3.
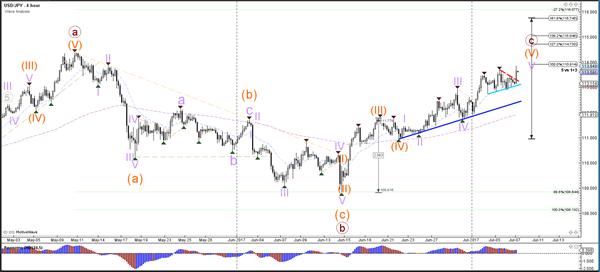
The USD/JPY failed to break the local support trend line (light blue) and bounced at support. A break above 114 could price move towards 115.
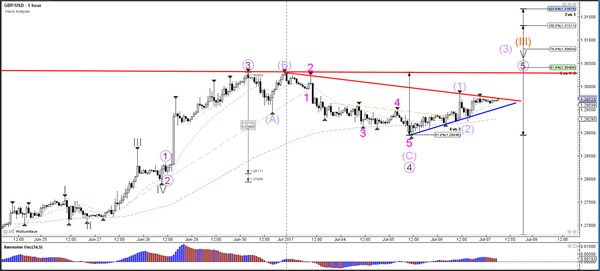
Currency pair GBP/USD
The GBP/USD bounced back up after strong bullish momentum. The Cable is now approaching a strong resistance trend line (red). A break above it could see price extend the uptrend.
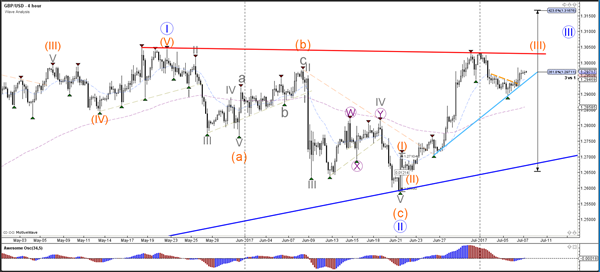
The GBP/USD broke above the resistance trend line (dotted orange) after bouncing to complete a wave 4 (purple). A break above the next resistance trend line (red) could see price start a wave 3 (purple).
European Open Briefing: Markets Were Mostly Quiet As Traders Are Waiting For The NFP
Global Markets:
- Asian stock markets: Nikkei down 0.50 %, Shanghai Composite fell 0.20 %, Hang Seng declined 0.45 %, ASX 200 lost 0.90 %
- Commodities: Gold at $1220 (-0.25 %), Silver at $15.89 (-0.60 %), WTI Oil at $45.00 (-1.20 %), Brent Oil at $47.55 (-1.15 %)
- Rates: US 10-year yield at 2.38, UK 10-year yield at 1.32, German 10-year yield at 0.57
News & Data
- Japanese Labour Cash Earnings (Y/Y) May: 0.7% (exp 0.4%; prev 0.5%)
- Australian AiG Perf of Construction Index Jun: 56.0 (prev 56.7)
- PBoC Fixes USDCNY Reference Rate At 6.7914 (prev fix 6.7953 prev close 6.8035)
- Asia hit by Wall St. stumble, debt yields spike after ECB minutes – RTRS
- Oil prices slump over 1 percent on rise in U.S. output – RTRS
Markets Update:
Markets were mostly quiet as traders are waiting for the NFP. The largest move overnight was seen in the JPY pairs. USD/JPY rallied to 113.85 despite Asian stock markets being under pressure. However, breakout above 114 seems unlikely prior to the US employment data at 1330 BST. To the downside, support is noted at 113.30 and 112.75.
EUR/USD consolidated between 1.1410 and 1.1425 in Asia. Strong resistance is seen around 1.1450. Should US data disappoint, EUR/USD will likely clear the resistance without much struggle. Above 1.1450, there is little resistance until 1.16.
Large moves were seen in precious metals overnight. Silver had a flash crash and collapsed more than 3 %. It quickly recovered, but remains under $16. The technical outlook is negative, and the downtrend is likely to continue in the near-term. Support is seen at $15.60, but the next major level is $15.00.
In Gold, there was no reaction to the Silver flash crash, but the metal had a weak performance as well. The break below $1220 support suggests it could test $1200 soon. Further, Gold is struggling despite the recent USD weakness, which indicates that selling interest on rallies remains high.
Upcoming Events:
- 07:00 BST – German Industrial Production
- 08:30 BST – UK Halifax House Price Index
- 09:30 BST – UK Manufacturing Production
- 09:30 BST – UK Industrial Production
- 09:30 BST – UK Trade Balance
- 13:30 BST – US NFP
- 13:30 BST – US Unemployment Rate
- 13:30 BST – Canadian Unemployment Rate
- 13:30 BST – Canadian Employment Change
- 15:00 BST – Canadian Ivey PMI
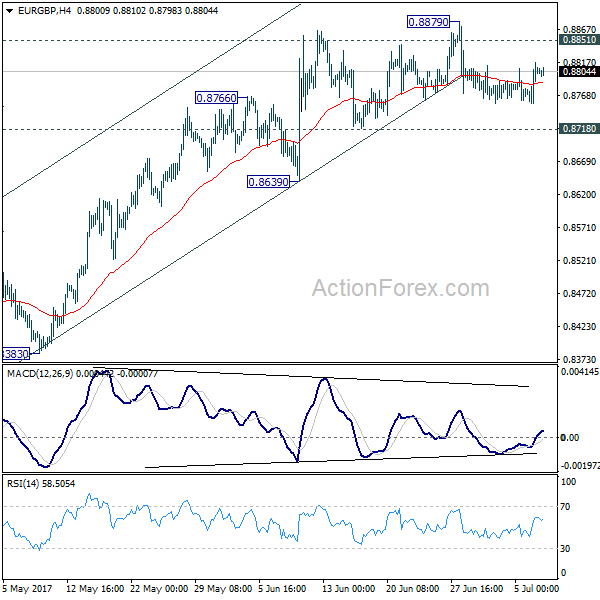
EUR/GBP Daily Outlook
Daily Pivots: (S1) 0.8769; (P) 0.8793; (R1) 0.8831; More...
Intraday bias in EUR/GBP remains neutral for consolidation below 0.8879. On the downside, break of 0.8718 support will argue that rise from 0.8312 has completed. In that case, intraday bias with be turned back to the downside for lower side of the range at 0.8312. Meanwhile, break of 0.8879 and sustained trading above 0.8851 will pave the way to retest 0.9304 high.
In the bigger picture, price actions from 0.9304 are viewed as a medium term corrective pattern. It's uncertain whether it is finished yet. But in case of another fall, we'd expect strong support from 0.8116 cluster support (50% retracement of 0.6935 to 0.9304 at 0.8120) to contain downside and bring rebound. Whole up trend from 0.6935 is expected to resume after consolidation from 0.9304 completes.

Market Update – Asian Session:Yen Weakens As BoJ Acts To Slow JGB Yield Rise
Asia Summary
Following the negative leads out of the US session and rise in European bond yields, Asian equities generally opened modestly lower. The Nikkei225 opened down by 0.7%, but has since pared losses. This came as the Bank of Japan (BOJ) announced that it would increase purchases of 5-10 year JGBs to ¥500B from ¥450B at its upcoming QE operation. The BoJ acted as earlier during the session the 10-yr JGB yield moved above 0.10% and hit the highest level since February.
The Australian S&P ASX 200, which is lower by over 1%, was the biggest mover, amid declines in the banking sector. This tracked the weakness in US banks. South Korean tech giant Samsung Electronics has traded marginally lower, after guiding its Q2 results above estimates. It was, however, speculated back in early June that the operating profit for the company's chip unit would total KRW7.0T.
Fed members Mester and Vice Chair Fischer did not have any noticeable impact on currency markets. Looking ahead, traders are focused on the later US June payrolls report and start of the G20 meeting, including the speculated sideline meeting between Russia's President Putin and US President Trump.
Key economic data
(JP) BoJ announces amounts to buy in upcoming QE operation: Increases regular purchases of 5-10 yr JGBs to ¥500B from ¥450B prior; To purchase 10-yr JGBs at 0.110%; Offers to buy unlimited amount in fixed-rate bond operation
(JP) JAPAN MAY LABOR CASH EARNINGS Y/Y: 0.7% V 0.4%E; REAL +0.1% V -0.1%E; Government said the May, regular pay (base wages) had the largest annual gain since March 2000.
(JP) JAPAN JUNE OFFICIAL RESERVE ASSETS: $1.249T V $1.257TE
(CN) PBoC skips open market operations (11th straight session)
(AU) AUSTRALIA JUNE CONSTRUCTION INDEX: 56.0 V 56.7 PRIOR
Speakers and Press
China
(CN) PBOC China Financial Market Development Report: Market orientated interest rate formation, regulation and transmission mechanism will be improved to enhance PBOC's regulatory capacity on interest rates; Will also raise the efficiency of the central bank operations, including standing lending facility, medium-term lending facility and reverse repos.
Japan
(JP) BoJ Official: Carried out increased JGB purchases and fixed-rate operations given 'big' rise in long-term yields
South Korea
(KR) South Korea confirms considering Red Cross talks and military meeting with North Korea; Also says may consider sending envoy to North Korea to discuss peace; However, says North Korea did not respond to civil contact request.
US
(US) Fed's Mester (hawkish, non-voter): Fed should launch portfolio runoff sooner rather than later; Expects inflation to resume climb toward 2%, but recent slowdown requires attention.
(US) Fed Vice Chair Fischer: US may be in 'productivity lull'; No comment on monetary policy; Debt ceiling debate is a 'dangerous game of chicken'
Asian Equity Indices/Futures (00:30ET)
Nikkei -0.5%, Hang Seng -0.50%, Shanghai Composite -0.2%, ASX200 -1.1%, Kospi -0.3%
Equity Futures: S&P 500 flat, Nasdaq +0.1%, DAX flat, FTSE 100 -0.1%
FX ranges/Commodities/Fixed Income (00:30ET)
EUR 1.1408-1.1425 ; JPY 113.11-113.84; 0.7572-0.7588; NZD 0.7274-0.7293
In the currency markets, the volatility has been driven by USD/JPY which has risen over 0.4% to trade above ¥113.70, following the BoJ's bond buying announcement. Other pairs have shown less volatility ahead of the US payrolls report.
(CN) PBOC SETS YUAN REFERENCE RATE: 6.7914 V 6.7953 PRIOR
Asian government bond yields track rise in global yields: Australia 3-year yield +6bps, 10-year +8bps. Despite the BoJ's bond buying announcement, the 40-yr JGB yield traded to highs not seen since Feb 2016, near 1.090%. US 10-yr Treasury yield rises 2bps to above 2.380%. In terms of corporate supply, Wal-Mart priced ¥170B in 5,7 and 10-year bonds.
US corporate high-yield funds had outflows of $1.16B in the week ended July 5th, according to Lipper.
In sovereigns, Australia sold A$600M in Dec 2021 bonds at an average yield of 2.1693% (1.980% prior) and bid to cover of 5.46x (3.48x prior). The country also announced a syndicated tap of the June 2039 bonds, which is scheduled for next week.
Some volatility has been seen with regards to the precious metals ahead of US payrolls. Notably, Silver Futures have declined by over 0.7%. In the energy space, WTI and Brent Crude are lower by over 1%
Asia equities notable movers
Australia
Mount Gibson Iron, MGX.AU Announced settlement agreement; +8.5%
China
COSCO Shipping, 1919.HK Profit guidance +11%
Vanke, 2002.HK Resumed trading following acquisition of CNY55.1B in assets from Guangdong International Trust +0.6%
Japan
Canon, 7751.JP EU fine -2.5%
New Zealand
Steel & Tube Holdings, STU.NZ Cut FY17 guidance -5%
Singapore
Noble Group, NOBL.SG Shares rose over 36% on prior session on speculation of debt waiver request -1.5%
South Korea
Samsung Electronics, 005930.KR Guided Q2 results above estimates -0.2%
US Session Highlights
(US) JUN ADP EMPLOYMENT CHANGE: 158K V 188KE; Prior revised lower from +253K to 230K
(US) DOE CRUDE: -6.3M V -2.5ME
US markets on close: Dow -0.7%, S&P500 -0.9%, Nasdaq -1.0%, Russell -1.5%***
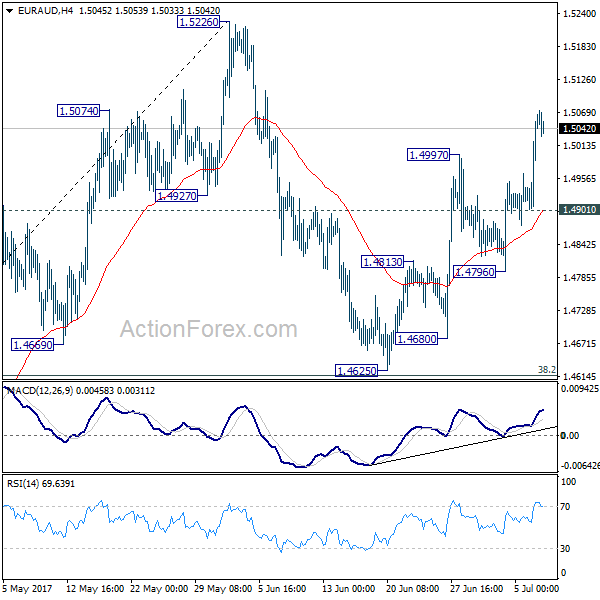
EUR/AUD Daily Outlook
Daily Pivots: (S1) 1.4953; (P) 1.5009; (R1) 1.5115; More...
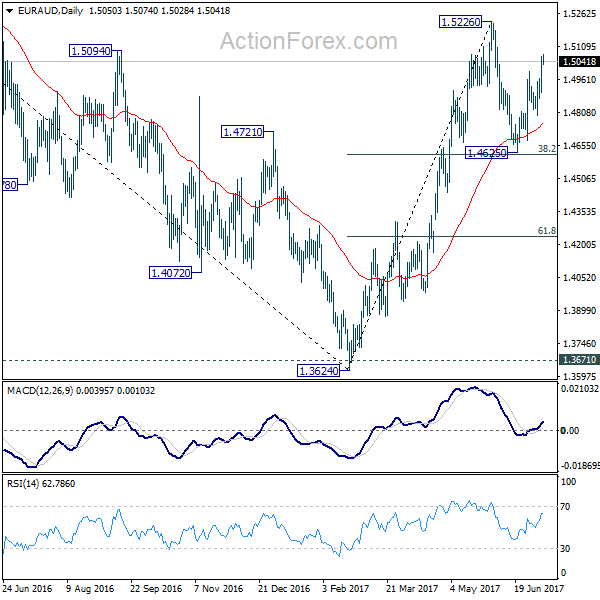
EUR/AUD's rise from 1.4625 resumed by taking out 1.4997 and reaches as high as 1.5074 so far. Intraday bias is back on the upside for 1.5226 resistance. Rise from 1.3624 is possibly resuming. Break of 1.5226 will confirm and target 1.5455 fibonacci level next. On the downside, however, break of 1.4901 minor support will dampen this bullish view and turn bias back to the downside.
In the bigger picture, price actions from 1.6587 medium term top are viewed as a corrective pattern. Such correction should be completed at 1.3624 after defending 1.3671 key support. Rise from 1.3642 would extend to 61.8% retracement of 1.6587 to 1.3624 at 1.5455. Sustained break there will pave the way to retest 1.6587. However, sustained break of 1.4669 support will dampen this bullish view. We'll assess the outlook later after looking at the structure and depth of the pull back.
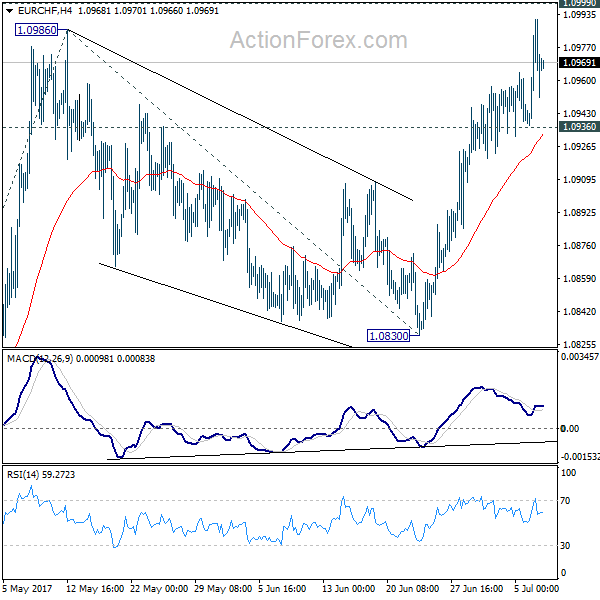
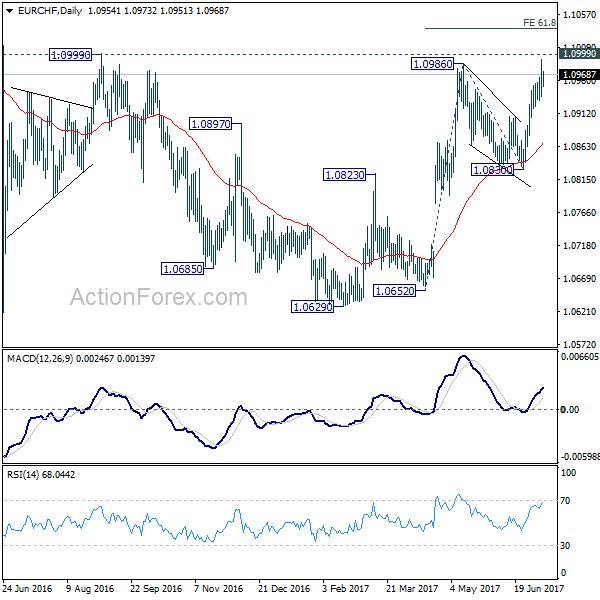
EUR/CHF Daily Outlook
Daily Pivots: (S1) 1.0942; (P) 1.0967; (R1) 1.0995; More...
Despite relatively unconvincing upside momentum, EUR/CHF's rally extended through 1.0986, which confirms resumption of rise from 1.0629. Intraday bias is back on the upside for 1.0999 and then 61.8% projection of 1.0652 to 1.0986 from 1.0830 at 1.1036. On the downside, break of 1.0936 support is needed to indicate short term topping. Otherwise, outlook will remain bullish in case of retreat.
In the bigger picture, the price actions from 1.1198 are seen as a corrective move. Such correction could have completed after defending 38.2% retracement of 0.9771 to 1.1198 at 1.0653. Decisive break of 1.0999 resistance will target a test on 1.1198 high. For now, this will be the preferred case as long as 1.0830 support holds.
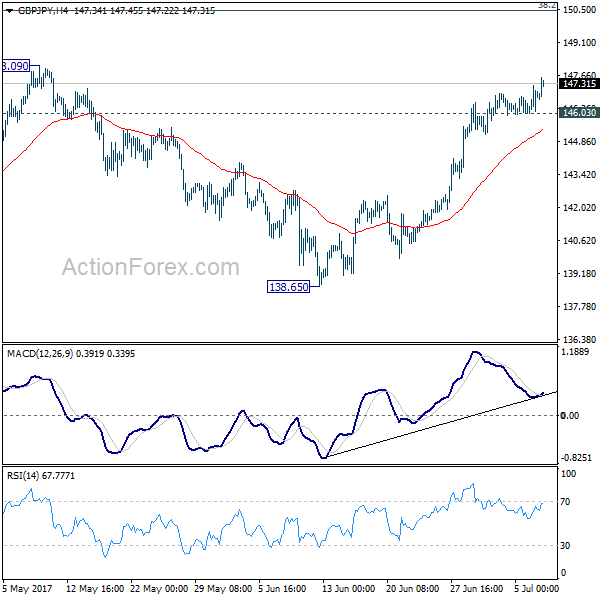
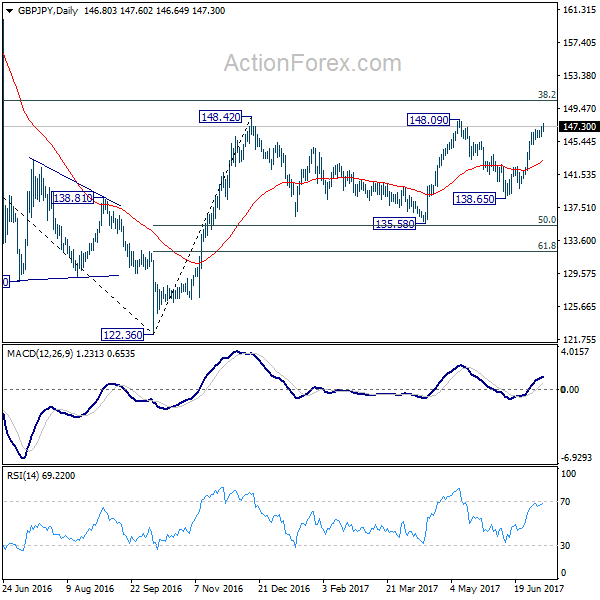
GBP/JPY Daily Outlook
Daily Pivots: (S1) 146.15; (P) 146.71; (R1) 147.39; More....
GBP/JPY's rally continues to as high as 147.60 and intraday bias stays on the upside for 148.09/42 resistance zone. Decisive break there will extend whole rally from 122.36 to long term fibonacci level at 150.43 next. On the downside, break of 146.03 support is needed to indicate short term topping. Otherwise, outlook will remains bullish in case of retreat.
In the bigger picture, rise from medium term bottom at 122.36 is expected to continue to 38.2% retracement of 196.85 to 122.36 at 150.43. Decisive break there will carry long term bullish implications and pave the way to 61.8% retracement at 167.78. In case the sideway pattern from 148.42 extends, we'd be looking for strong support from 135.58 and 50% retracement of 122.36 to 148.42 at 135.39 to contain downside.