
Sample Category Title
USD/CAD Daily Outlook
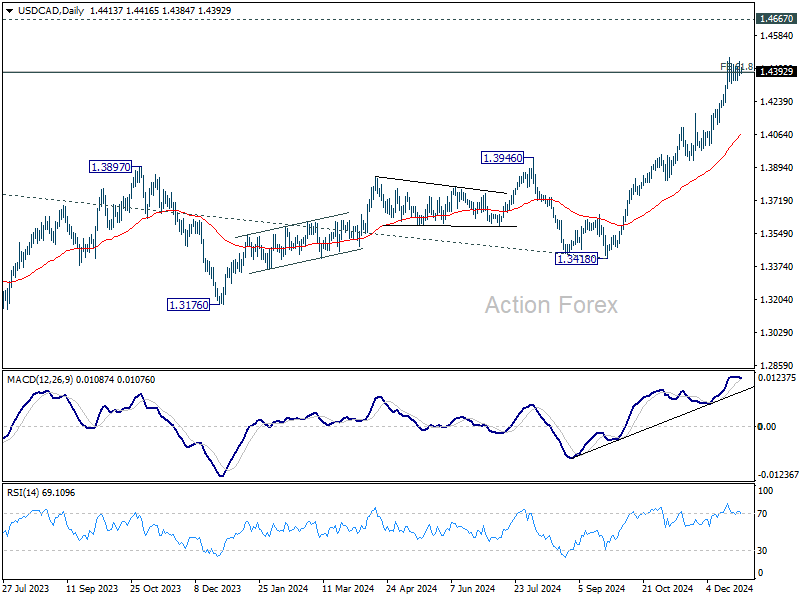
Daily Pivots: (S1) 1.4377; (P) 1.4413; (R1) 1.4452; More...
USD/CAD is still extending the consolidations from 1.4466 and intraday bias remains neutral. While deeper pull back cannot be ruled out, outlook will stay bullish as long as 1.4177 resistance turned support holds. On the upside, break of 1.4466 and sustained trading above 1.4391 will pave the way to retest 1.4667/89 long term resistance zone.
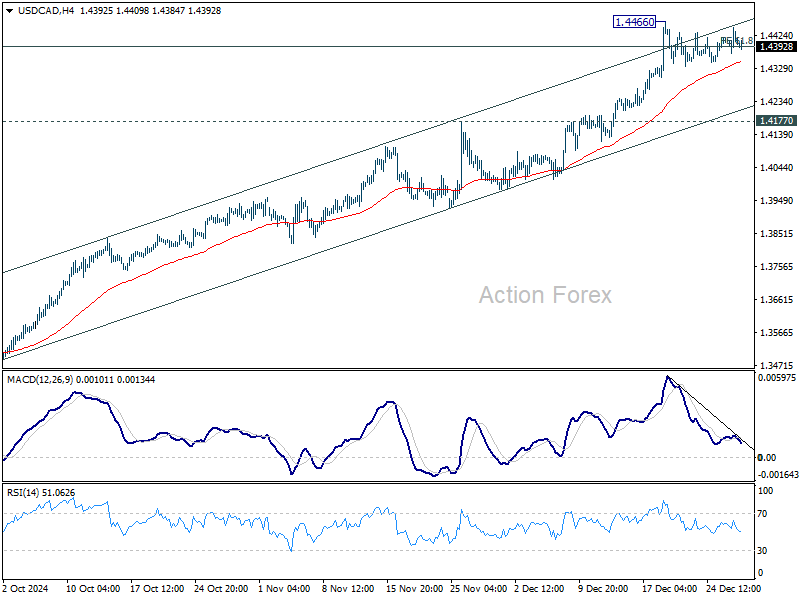
In the bigger picture, up trend from 1.2005 (2021) is in progress and met 61.8% projection of 1.2401 to 1.3976 from 1.3418 at 1.4391 already. Sustained trading above there will pave the way to 1.4667/89 key resistance zone (2020/2015 highs). Medium term outlook will remain bullish as long as 55 W EMA (now at 1.3729) holds, even in case of deep pullback.
EUR/USD Stuck in Range Despite Stronger Bullish Bias
- EUR/USD edges higher for third straight day.
- But unable to break past range ceiling.
- Upside momentum gathers some strength.
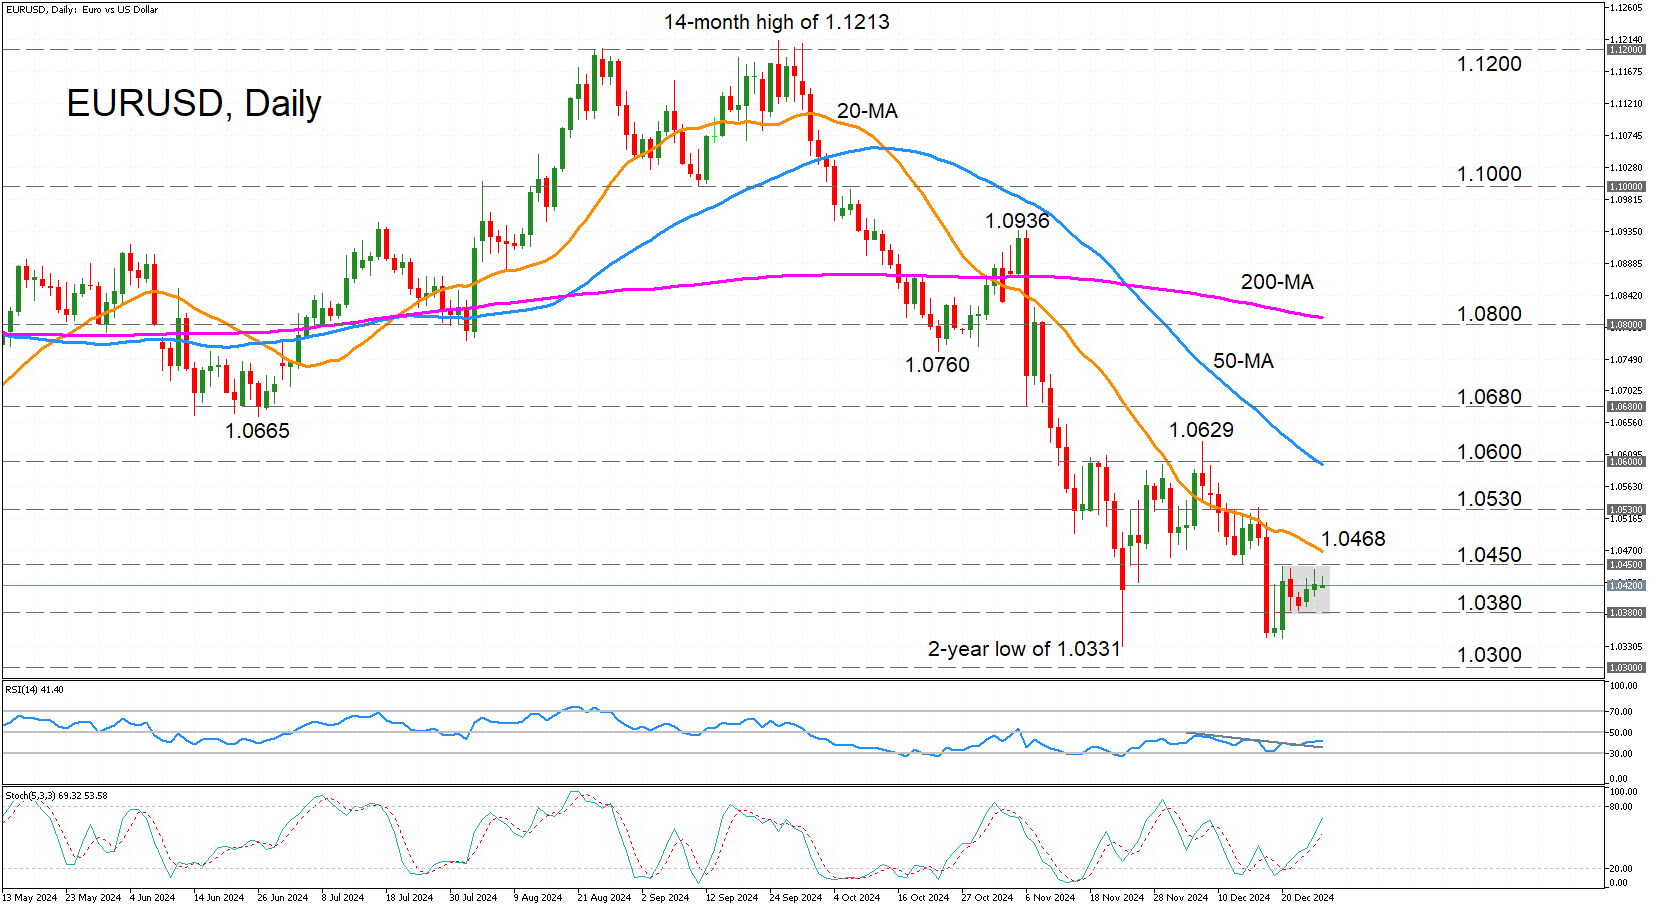
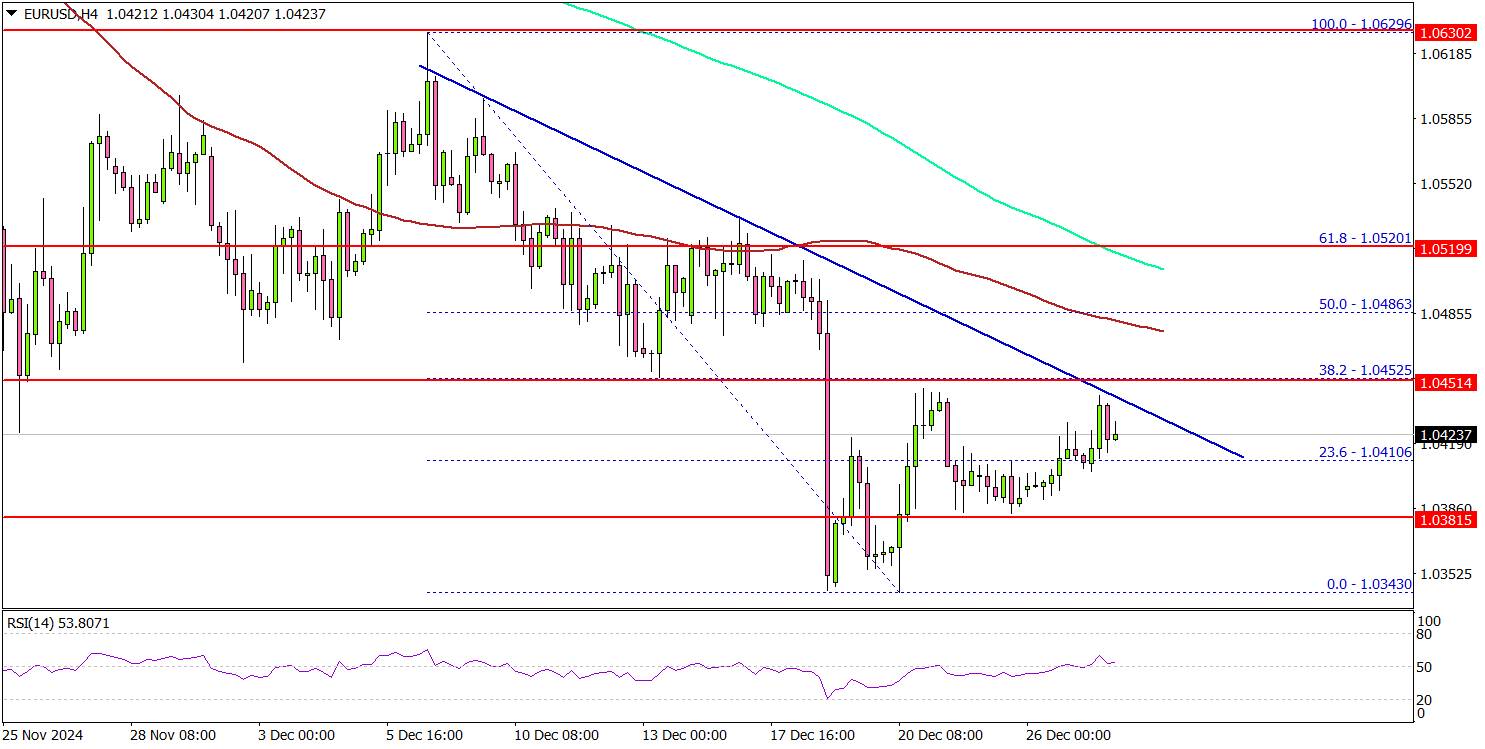
EUR/USD has been trading sideways ever since its rebound attempt on December 20 faltered. The range ceiling can be found just below 1.0450, while the floor has been formed slightly above 1.0380. The momentum indicators suggest that an upside breakout is more likely than a downside one as the RSI has snapped the series of lower highs and is inching higher and the stochastic oscillator is headed towards the overbought region.
However, the strengthening positive bias is only mildly reflected in the price action and the short-term sideways range doesn’t seem under threat just yet.
Should EUR/USD manage to rise above the range ceiling, there’s likely to be some resistance around the 20-day simple moving average (SMA) at 1.0468. Surpassing it would put the pair on a more convincing upward path, bringing into view the recently congested 1.0530 region. Higher up, the next big test for the bulls would be the 50-day SMA just beneath the 1.0600 level.
On the flip side, the range floor of 1.0380 is the immediate support that needs to be tackled by the bears before revisiting the November 22 low of 1.0331. Breaching that too would reinforce the medium-term downtrend, turning the attention to the 1.0300 level.
In brief, the current positive momentum is too feeble to push the price above the short-term sideways range and the medium-term outlook remains decisively bearish. Only a climb above the 50-day SMA can weaken the negative picture.
Dollar Index Rises by 6.7% in 2024
Throughout 2024, the US dollar traded with mixed dynamics but showed consistent strengthening over the past three months.
According to WSJ and Reuters, the following factors contributed to this growth:
→ Reports of a strong US economy and expectations that further interest rate cuts by the Federal Reserve will be limited.
→ Projections of policies under President-elect Donald Trump, which are anticipated to focus on tax reductions, increased tariffs, and stricter immigration controls.
During the low-volatility holiday trading period, the US Dollar Index—a tool measuring the dollar's strength against a basket of major currencies—hovered around a two-year high, where it may close a strong year.
Meanwhile, the euro remains near two-year lows, but bulls hold onto hope.
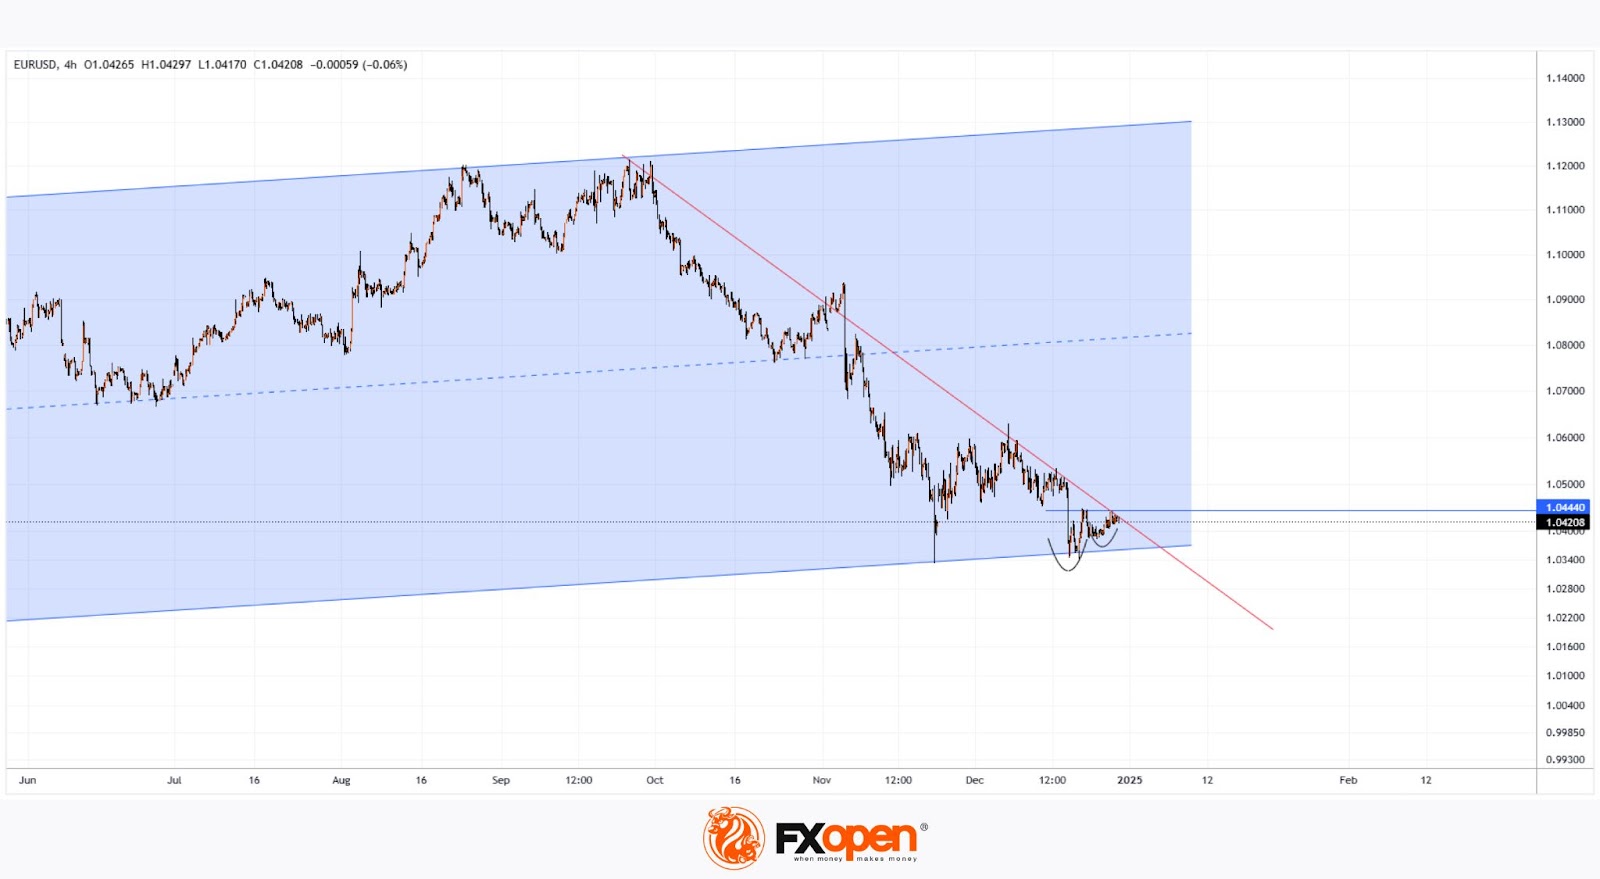
As technical analysis of the EUR/USD chart indicates today:
→ The price is near a support level formed by an ascending channel (marked in blue).
→ Simultaneously, price fluctuations are shaping a bullish “cup and handle” pattern below the 1.0444 level—signalling growing interest among buyers.
A breakout above the red descending trendline could help bulls start 2025 confidently, potentially pushing the price higher from the lower boundary of the channel.
Trade over 50 forex markets 24 hours a day with FXOpen. Take advantage of low commissions, deep liquidity, and spreads from 0.0 pips. Open your FXOpen account now or learn more about trading forex with FXOpen.
This article represents the opinion of the Companies operating under the FXOpen brand only. It is not to be construed as an offer, solicitation, or recommendation with respect to products and services provided by the Companies operating under the FXOpen brand, nor is it to be considered financial advice.
Nikkei 225 Struggles to Hold Above the Psychological Level
The Nikkei 225 (Japan 225 on FXOpen) has risen nearly 20% in 2024, marking its best performance since 1989, according to Trading Economics. This impressive gain is especially noteworthy considering the market plunge in early August, triggered partly by the Bank of Japan’s historic interest rate hike.
According to today's chart of the Japanese stock market index Nikkei 225 (Japan 225 on FXOpen):
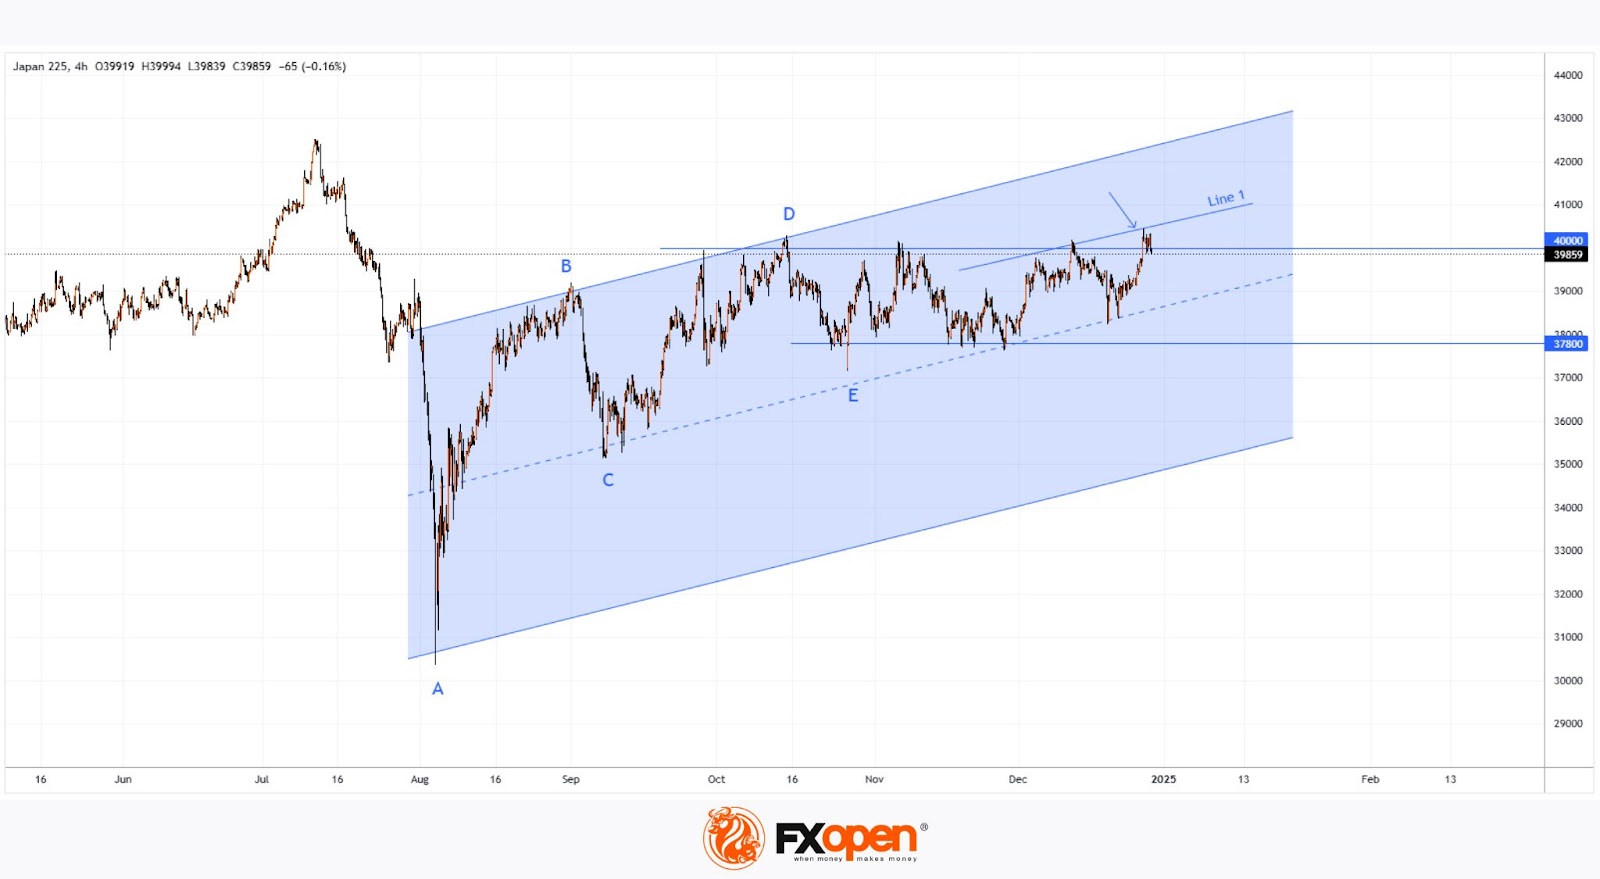
→ Late last week (marked with an arrow), the index surpassed the psychological 40,000 level, reaching a 5-month high.
→ However, as this week began, the Nikkei 225 dropped below 40,000, failing to sustain its position above this key level.
Potential influencing factors:
→ Portfolio adjustments as the new year begins.
→ News about a potential merger between Nissan and Honda.
→ A weakening yen, which supports Japan’s export-driven industries.
Technical analysis of the Japan 225 (Japan 225 on FXOpen) chart shows that:
→ Bulls have been forming an A-B-C-D-E structure of higher highs, outlining an ascending channel (shown in blue). Despite this, the 40,000 level remains a strong resistance point.
→ The bears are gaining an edge with Line 1, which splits the channel into quarters and signals increasing resistance.
Given these dynamics, Friday’s peak could be a false bullish breakout. The Nikkei 225 (Japan 225 on FXOpen) might retreat towards the median line or drop further to test support around 37,800.
Trade global index CFDs with zero commission and tight spreads. Open your FXOpen account now or learn more about trading index CFDs with FXOpen.
This article represents the opinion of the Companies operating under the FXOpen brand only. It is not to be construed as an offer, solicitation, or recommendation with respect to products and services provided by the Companies operating under the FXOpen brand, nor is it to be considered financial advice.
AUD/USD Daily Report
Daily Pivots: (S1) 0.6199; (P) 0.6218; (R1) 0.6236; More...
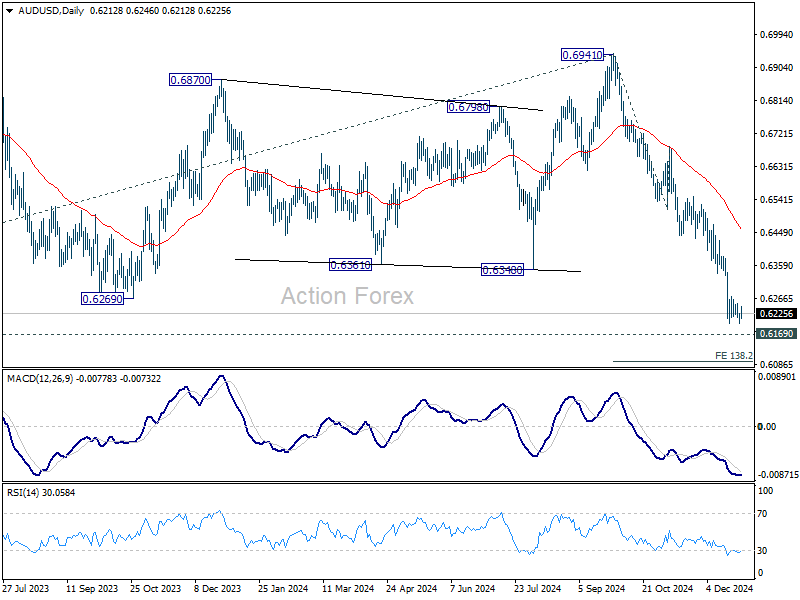
AUD/USD recovers mildly today but overall outlook is unchanged. Intraday bias stays neutral first, and consolidations from 0.6198 should be relatively brief as long as 0.6336 support turned resistance holds. On the downside, break of 0.6198 will resume the fall from 0.6941 to 0.6169 long term support, and then 138.2% projection of 0.6941 to 0.6511 from 0.6687 at 0.6074. Nevertheless, firm break of 0.6336 will bring stronger rebound lengthier correction before staging another decline.
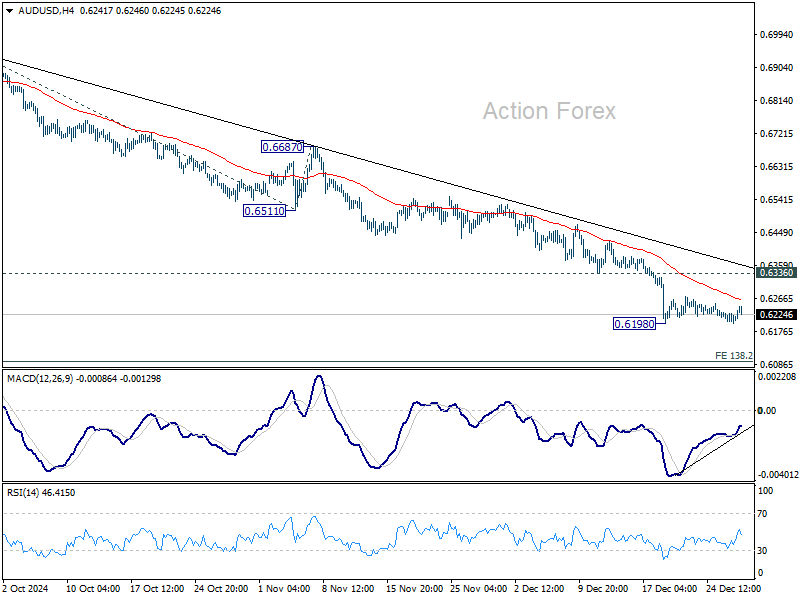
In the bigger picture, price actions from 0.6169 (2022 low) are seen as a medium term consolidation to the down trend from 0.8006. Firm break of 0.6169 support will confirm down trend resumption for 61.8% projection of 0.8006 to 0.6169 from 0.6941 at 0.5806 next. In any case, outlook will stay bearish as long as 55 W EMA (now at 0.6588) holds.
Commodity Currencies Recover as Markets Eye China Data, NZD/USD Presses Key Fibonacci Level
Commodity currencies are starting the week with a modest recovery as Aussie, Kiwi, and Loonie attempt to pare steep losses from earlier in the month. Gains remain limited in the subdued holiday trading environment, but these currencies could see further upside if China’s NBS PMIs due tomorrow deliver an improved outlook for 2025. However, any significant moves are expected to materialize only after trading volumes normalize post-New Year.
Adding to the focus on China, the World Bank last week raised its GDP growth forecasts for the country. The 2024 GDP growth forecast was revised up slightly to 4.9%, from June’s projection of 4.8%, though it remains below Beijing's target of around 5%. For 2025, growth was upgraded more notably, from 4.1% to 4.5%. Yet, the World Bank also warned that slower household income growth and the negative wealth effect of falling home prices could continue to weigh on consumption, posing challenges to sustained growth.
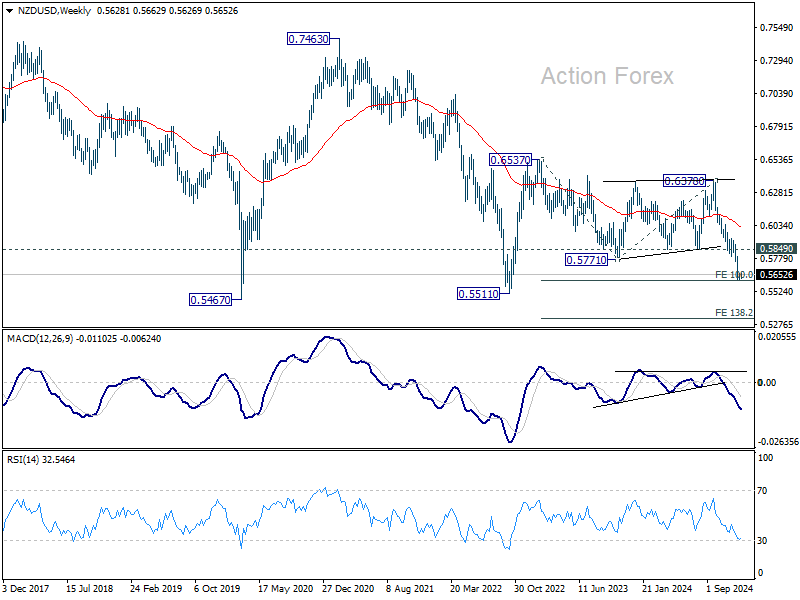
Overall, Dollar remains the best performer for the month, while New Zealand Dollar sits as the second weakest. Technically, NZD/USD is now pressing an important fibonacci level, 100% projection of 0.6537 to 0.5771 from 0.6378 at 0.5612. Strong bounce from current level, followed by firm break of 0.5849 support turned resistance, will be the first sign that decline from 0.6537 has completed as a corrective move. Stronger rebound should then be seen back to 55 W EMA (now at 0.6012) at least. However, decisive break of 0.5612 will argue that large down trend is resuming with further downside acceleration through 0.5468/5511.
In Asia, Nikkei fell -0.96%. Hong Kong HSI fell -0.09%. China Shanghai SSE rose 0.21%. Singapore Strait Times rose 0.37%. Japan 10-year JGB yield fell -0.0132 to 1.091.
Swiss KOF falls below average, signals dampened outlook
Swiss KOF Economic Barometer fell to 99.5 in December, down from 102.9 in November and below market expectations of 101.1. This decline brings the indicator slightly below its medium-term average, signaling a "dampened" outlook for the Swiss economy .
KOF Economic Institute attributed the drop to weaker performance across multiple sectors. In particular, indicators for manufacturing, other services, the hospitality industry, foreign demand, and private consumption showed significant declines, collectively driving the overall decrease.
Japan's PMI manufacturing finalized at 49.6, nears stabilization and cost pressures persist
Japan's Manufacturing PMI for December was finalized at 49.6, an improvement from November's 49.0, indicating a gradual move toward stabilization in the sector.
According to Usamah Bhatti of S&P Global Market Intelligence, the data "painted a picture of a near-stabilization" in manufacturing conditions as declines in both production and new orders softened.
Encouraged by these improvements, firms increased hiring, partly to address existing labor shortages and in anticipation of future demand recovery.
However, price pressures remained elevated, with input costs rising at their fastest pace since August due to higher raw material and labor costs, compounded by Yen’s weakness. To manage these cost burdens, manufacturers passed on higher prices to clients, resulting in the strongest output charge increases in five months.
AUD/USD Daily Report
Daily Pivots: (S1) 0.6199; (P) 0.6218; (R1) 0.6236; More...
AUD/USD recovers mildly today but overall outlook is unchanged. Intraday bias stays neutral first, and consolidations from 0.6198 should be relatively brief as long as 0.6336 support turned resistance holds. On the downside, break of 0.6198 will resume the fall from 0.6941 to 0.6169 long term support, and then 138.2% projection of 0.6941 to 0.6511 from 0.6687 at 0.6074. Nevertheless, firm break of 0.6336 will bring stronger rebound lengthier correction before staging another decline.
In the bigger picture, price actions from 0.6169 (2022 low) are seen as a medium term consolidation to the down trend from 0.8006. Firm break of 0.6169 support will confirm down trend resumption for 61.8% projection of 0.8006 to 0.6169 from 0.6941 at 0.5806 next. In any case, outlook will stay bearish as long as 55 W EMA (now at 0.6588) holds.
Swiss KOF falls below average, signals dampened outlook
Swiss KOF Economic Barometer fell to 99.5 in December, down from 102.9 in November and below market expectations of 101.1. This decline brings the indicator slightly below its medium-term average, signaling a "dampened" outlook for the Swiss economy .
KOF Economic Institute attributed the drop to weaker performance across multiple sectors. In particular, indicators for manufacturing, other services, the hospitality industry, foreign demand, and private consumption showed significant declines, collectively driving the overall decrease.
Japan’s PMI manufacturing finalized at 49.6, nears stabilization and cost pressures persist
Japan's Manufacturing PMI for December was finalized at 49.6, an improvement from November's 49.0, indicating a gradual move toward stabilization in the sector.
According to Usamah Bhatti of S&P Global Market Intelligence, the data "painted a picture of a near-stabilization" in manufacturing conditions as declines in both production and new orders softened.
Encouraged by these improvements, firms increased hiring, partly to address existing labor shortages and in anticipation of future demand recovery.
However, price pressures remained elevated, with input costs rising at their fastest pace since August due to higher raw material and labor costs, compounded by Yen’s weakness. To manage these cost burdens, manufacturers passed on higher prices to clients, resulting in the strongest output charge increases in five months.
A Quiet Monday
Last week ended on a positive note for the European stocks and negative note for the US stocks. Friday saw the S&P 500 dive more than 1%, while the Stoxx 600 closed 0.67% higher. We can’t drive major conclusions in a holiday-shortened and thin-trading-volume week, but last week’s price action looked pretty close to the narrative of rotation from tech to non-tech stocks that many investors expect to be the theme of next year.
And they could be right! The US stocks will end the year with the biggest gains since 1997 and the expectations have probably gotten too high for the AI related companies to satisfy. In numbers, the big tech stocks are expected to eke out a 30% earnings growth next year, but Bloomberg economists warn that the pricing of the S&P 500 implies a growth figure closer to 40%. Tech investors are already out looking for the next big thing, and the word ‘quantum’ is increasingly pronounced in discussions. Defiance’s Quantum ETF has broken above its long-term ascending channel top and gained up to 30% since the beginning of the month. One of the main catalyzers of the quantum rally was Google’s announcement that it made a significant progress in quantum computing with its new chip, Willow, at the start of the month, that demonstrated the capability to solve complex problems in under five minutes—a task that would take current supercomputers an estimated 10 septillion years. One issue with the quantum space is that the technology is not ready to be broadly commercialized, meaning that the market rally won’t be backed by impressive earnings reports, as with Nvidia.
Anyway, we will see. Coming back to our Magnificent 7 stocks, they lost more than 2% on Friday. Netflix wasn’t an exception to the trend as the new Squid Game made a less-than-ideal debut with just 64% rating on popcornmeter on rotten tomatoes – very low for a show that’s first season saw a historical attention from watchers around the world, became the platform's most-watched show at its launch, with over 142 million member households viewing it within the first 28 days, and helped Netflix add millions of new subscribers to its platform. The disappointment of the second season not only weighed on Netflix shares, but pulled the related Korean shares lower as well. Dexter studios for example sank 24% on Friday and is down by another 5% today in Seoul.
And South Korea continues to sit on the headlines beyond a lacklustre attention for its Squid Game 2. The political shenanigans are now topped by a deadly airplane crash that costed the lives of 179 people. Jeju air tumbled at the open, even though the losses were partially recovered at the time of writing.
Beyond Korea, Asian markets opened the week on a negative note. The Japanese Nikkei index and Australian stocks were offered this Monday with trading volumes nearly 20% lower the Japanese market, and 55% lower for their Australian peers (Bloomberg). Futures point at an unappetizing start for the last Monday of the year both in Europe and in the US, and the price moves could be exaggerated with low trading volumes.
In the FX, the US dollar is flat. The EURUSD sees resistance into 1.0435, while Cable is offered into 1.26 level. The USDJPY continues to flirt with the 158 resistance as traders and government officials are getting caught up in heated debates. The country’s finance minister for example said that the government will take appropriate steps against excessive moves in the yen, whereas the Bank of Japan (BoJ) members kept the possibility of a rate hike on the table for January during a live discussion. Funnily, the latest remarks from this live session weren’t fully in line with what the Governor Ueda suggested during the announcement of the latest BoJ decision, where he said that the BoJ needs time to understand the implications of Trump policies and that the latter could take until March-April to become clearer. Note that some economists highlight that if the BoJ didn’t take action this month, it wasn’t only because of Trump, but also because of domestic concerns over political backlash between Ishiba’s minority government and the opposition on budget and tax reforms. It’s unclear if those uncertainties will be lifted in time for the BoJ’s next policy meeting but the Trump excuse will certainly hold for a few more months! Until then, the USDJPY will probably continue pushing higher with increased risk of a direct intervention approaching the 160 level – which will probably be the line in the sand set by the Japanese officials to halt the yen’s selloff.
EUR/USD At Risk of Another Slide, Can Bulls Survive?
Key Highlights
- EUR/USD started a recovery wave from the 1.0340 zone.
- A major bearish trend line is forming with resistance at 1.0450 on the 4-hour chart.
- GBP/USD is consolidating above the 1.2500 support zone.
- USD/JPY might continue to rise if it clears the 158.00 resistance zone.
EUR/USD Technical Analysis
The Euro found support near the 1.0340 zone against the US Dollar. EUR/USD formed a base and started a recovery wave above 1.0400.
Looking at the 4-hour chart, the pair settled below the 1.0450 level, the 100 simple moving average (red, 4-hour), and the 200 simple moving average (green, 4-hour). The pair is now attempting to gain pace above the 1.0450 level.
There is also a major bearish trend line forming with resistance at 1.0450 on the same chart. The next major resistance is near the 1.0485 level and the 100 simple moving average (red, 4-hour).
A close above the 1.0485 level could set the tone for another increase. In the stated case, the pair could rise toward the 1.0530 resistance.
On the downside, immediate support sits near the 1.0380 level. The next key support sits near the 1.0340 level. Any more losses could send the pair toward the 1.0300 level.
Looking at GBP/USD, the pair is consolidating losses above 1.2500 and might aim for a move above the 1.2650 resistance.
Upcoming Economic Events:
- US Pending Home Sales for Nov 2024 (MoM) - Forecast +0.7%, versus +2.0% previous.