Sample Category Title
EUR/USD Mid-Day Outlook
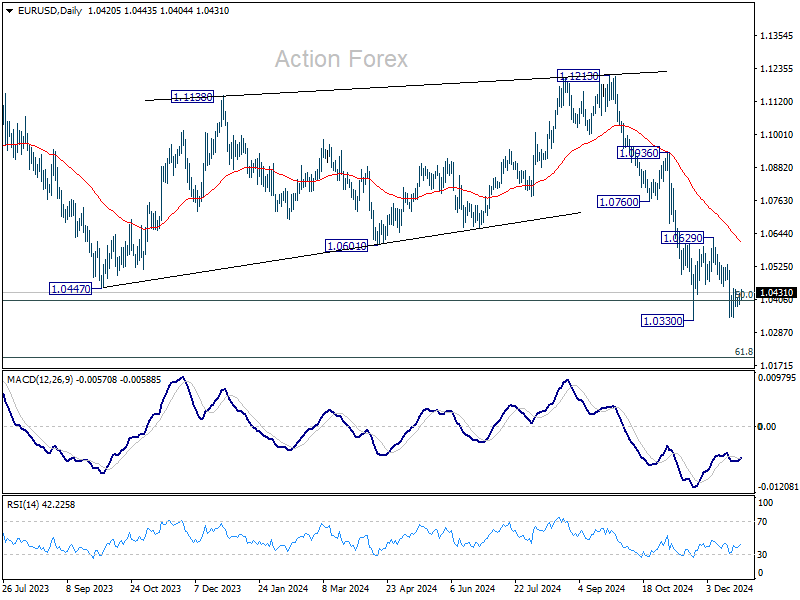
Daily Pivots: (S1) 1.0399; (P) 1.0414; (R1) 1.0439; More...
EUR/USD recovers mildly today but stays in range of 1.0330/0629 and intraday bias stays neutral. Stronger recovery cannot be ruled out, but outlook will remain bearish as long as 1.0629 resistance holds. Firm break of 1.0330 will confirm resumption of whole decline from 1.1213. Sustained trading below 1.0404 fibonacci level will carry larger bearish implications.
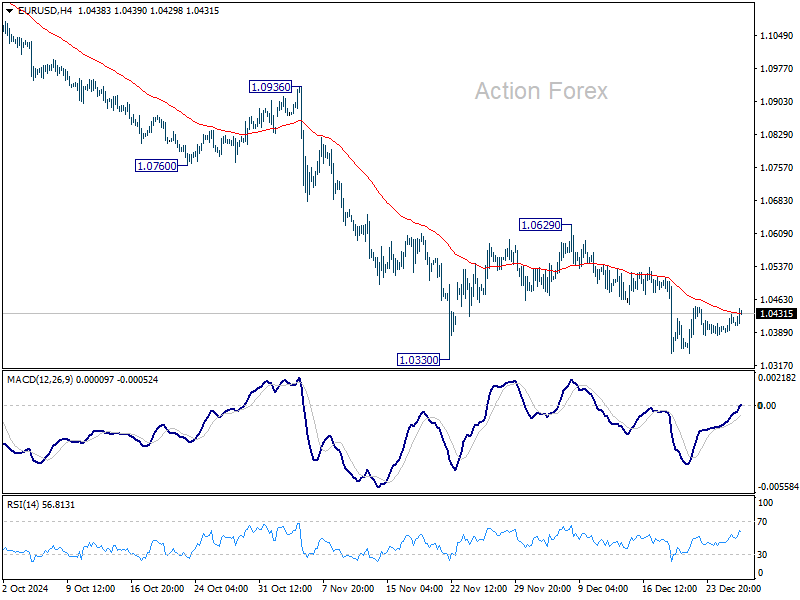
In the bigger picture, focus stays on 50% retracement of 0.9534 (2022 low) to 1.1274 at 1.0404. Strong rebound from this level will keep price actions from 1.1273 (2023 high) as a medium term consolidation pattern only. However, sustained break of 1.0404 will raise the chance that whole up trend from 0.9534 has reversed. That would pave the way to 61.8% retracement at 1.0199 first. Firm break there will target 0.9534 low again.
Euro Finds Mild Strength Amid German Bond Selloff, Aussie Dips on China Trade Concerns
Euro is having a modest rebound as markets enter the final US session of the holiday week, supported by a notable rise in Germany’s 10-year benchmark yield. Investors dumped German bonds after President Frank-Walter Steinmeier dissolved the lower house of parliament, paving the way for snap elections on February 23. The move follows the collapse of Chancellor Olaf Scholz's three-way coalition government, which lost a confidence vote earlier this month, leaving Scholz to head a caretaker government until a new one is formed.
Germany has narrowly avoided a technical recession this year, but its GDP growth has been volatile, alternating between positive and negative quarters over the past year. The stagnation has been exacerbated by political uncertainty, which has deterred business investment. However, some economists see room for positive surprises in 2025 if the snap elections deliver a stable government, paving the way for consistent and predictable economic policies that could restore business and investor confidence.
In contrast, Australian Dollar edged lower on news that China is set to launch an investigation into beef imports, raising concerns about trade restrictions. Australia accounted for 12% of China’s USD 14.2B in beef imports in 2023. While China claims the investigation isn’t targeting specific countries, Australia, along with Argentina and Brazil, could face significant impacts if trade measures are imposed.
In Europe, at the time of writing, FTSE is down -0.09%. DAX is up 0.43%. CAC is up 0.60%. Germany 10-year yield is up 0.059 at 2.383. UK 10-year yield is up 0.051 at 4.623. Earlier in Asia, Nikkei rose 1.80%. Hong Kong HSI fell -0.04%. China Shanghai SSE rose 0.06%. Singapore Strait Times rose 0.27%> Japan 10-year JGB yield rose 0.0164 to 1.104.
US goods exports rise 6.1% yoy in Nov, imports surge 9.6% yoy
US goods exports rose 6.1% yoy to USD 176.4B in November. Goods imports rose 9.6% yoy to USD 279.2B. Trade deficit widened from October's USD -98.3B to USD 102.9B. larger than expectation of USD -100.9B.
Wholesale inventories fell -0.2% mom to USD 901.6B. Retail inventories rose 0.3% mom to USD 827.5B.
BoJ summary highlights division on timing of rate hikes
BoJ Summary of Opinions from its December 18–19 meeting revealed a divided board on the timing of monetary policy normalization. While some members advocated for action soon, citing upside risks to prices, others expressed caution due to slow wage growth, soft overseas demand, and heightened uncertainties.
One member emphasized that with economic activity and prices aligning with BoJ’s outlook, risks to inflation were becoming "skewed to the upside." The member argued for a "forward-looking, timely, and gradual" adjustment of monetary policy. Similarly, another member noted that the sustained increase in prices over the past three years, partly driven by Yen's depreciation, would likely contribute to higher underlying inflation, warranting "preemptive" rate hikes.
Conversely, more dovish members maintained that the current risks to prices "do not suggest a pressing need" for rate hike. One member cited uncertainties surrounding tax and fiscal policies in Japan and the stance of the incoming US administration as reasons to maintain the current policy stance, emphasizing a risk management approach.
Overall, the BoJ board appears focused on assessing the outcomes of next year’s spring wage negotiations and the impact of US policy shifts before making further moves toward policy normalization.
Japan's Tokyo CPI core rises to 2.4% in Dec, but core-core dips to 1.8%
Japan's Tokyo core CPI (excluding food) rose from 2.2% yoy to 2.4% yoy in December, marking its highest level since August but falling short of expectations for 2.5%. The increase was largely driven by a 13.5% yoy surge in energy prices, reflecting the phase-out of government subsidies for gas and electricity bills. However, when excluding utility costs, inflation pressures appear steady.
Core-core CPI (excluding food and energy) softened to 1.8% yoy from 1.9% yoy, while services inflation edged up slightly from 0.9% to 1.0%. Meanwhile, headline inflation accelerated to 3.0% yoy from 2.6% yoy, with energy and food prices, including rice, contributing significantly to the increase too.
The uptick in Tokyo inflation highlights lingering pressures from rising utility and food costs, which may weigh on consumer spending and deter firms from implementing further price hikes. These factors, coupled with broader signs of economic weakness, could delay BoJ ’s timeline for raising interest rates.
Japan's industrial output slips -2.3% mom in Nov, indecisive fluctuation continues
Japan's industrial production declined -2.3% mom in November, outperforming expectations of a -3.4% mom drop, but marking the first contraction in three months.
The decrease was driven by weaker exports of semiconductor manufacturing devices and cars, highlighting challenges in external demand. Out of 15 industrial sectors, 11 recorded declines, while 3 sectors reported gains.
Production machinery saw a significant -9.1% drop, largely due to falling exports of chip-making equipment to China and Taiwan, while motor vehicle output fell -4.3%, and fabricated metal products dropped -5.7%.
Despite the slump, the Ministry of Economy, Trade, and Industry maintained its view that industrial production "fluctuates indecisively," while warning of risks tied to the economic outlooks of the US and China.
Looking ahead, METI's poll of manufacturers predicts a rebound, with output expected to rise 2.1% in December and an additional 1.3% in January.
Separately, retail sales posted a robust 2.8% yoy gain, exceeding expectations of 1.5%, signaling resilience in domestic demand.
EUR/USD Mid-Day Outlook
Daily Pivots: (S1) 1.0399; (P) 1.0414; (R1) 1.0439; More...
EUR/USD recovers mildly today but stays in range of 1.0330/0629 and intraday bias stays neutral. Stronger recovery cannot be ruled out, but outlook will remain bearish as long as 1.0629 resistance holds. Firm break of 1.0330 will confirm resumption of whole decline from 1.1213. Sustained trading below 1.0404 fibonacci level will carry larger bearish implications.
In the bigger picture, focus stays on 50% retracement of 0.9534 (2022 low) to 1.1274 at 1.0404. Strong rebound from this level will keep price actions from 1.1273 (2023 high) as a medium term consolidation pattern only. However, sustained break of 1.0404 will raise the chance that whole up trend from 0.9534 has reversed. That would pave the way to 61.8% retracement at 1.0199 first. Firm break there will target 0.9534 low again.
US goods exports rise 6.1% yoy in Nov, imports surge 9.6% yoy
US goods exports rose 6.1% yoy to USD 176.4B in November. Goods imports rose 9.6% yoy to USD 279.2B. Trade deficit widened from October's USD -98.3B to USD 102.9B. larger than expectation of USD -100.9B.
Wholesale inventories fell -0.2% mom to USD 901.6B. Retail inventories rose 0.3% mom to USD 827.5B.
JP225: Rising Triangle
JP225, Daily
In the Daily timeframe, JP225 has formed an ascending triangle pattern, and the price is testing the upper boundary. Parabolic SAR indicates the beginning of the upside, which makes it possible to expect a rise.
- It is possible to consider buying JP225 on consolidation above 40000 and the nearest fractal with a target to 41200 and further to 42500;

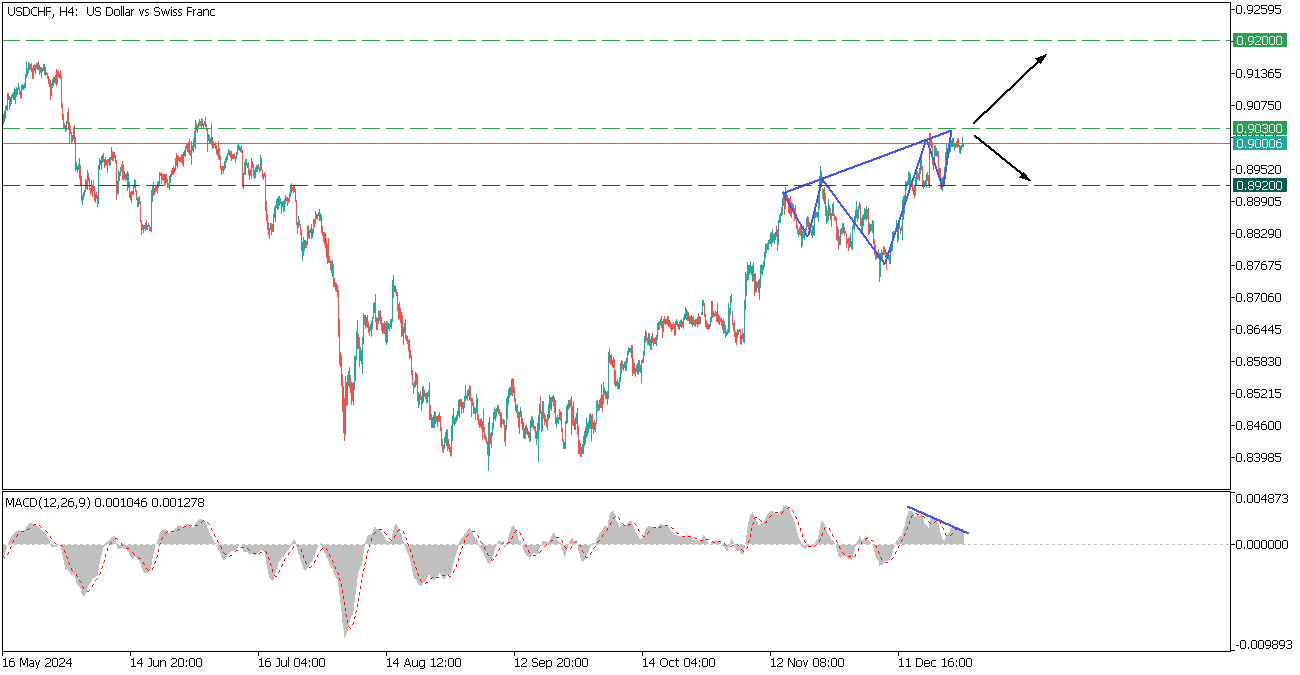
USDCHF: Reversed Head-And-Shoulders
USDCHF, H4
USDCHF navigates within a reversed head and shoulders patter and aims to test the 0.9030 resistance.
- The pattern is bullish, however, the MACD shows a bearish divergence, giving a signs of further decline for the asset which gives us mixed sentiment.
- If the price breaks above the 0.9030 it may skyrocket the USDCHF to 0.9200.
However, failing of surpassing the resistance, will trigger a decline toward 0.8920.
USD/JPY Analysis: Pair Reaches 5-Month High
The Japanese yen remains under pressure, trading near a five-month low against the US dollar. This trend is primarily driven by differences in monetary policy approaches.
On one side, the Federal Reserve maintains a hawkish stance, signalling a gradual slowing of monetary easing in 2025.
On the other, the Bank of Japan continues its cautious approach to policy tightening, as confirmed by a Reuters report published today. Although Japan’s Finance Minister issued warnings this week about potential market interventions, these statements have had little immediate impact.
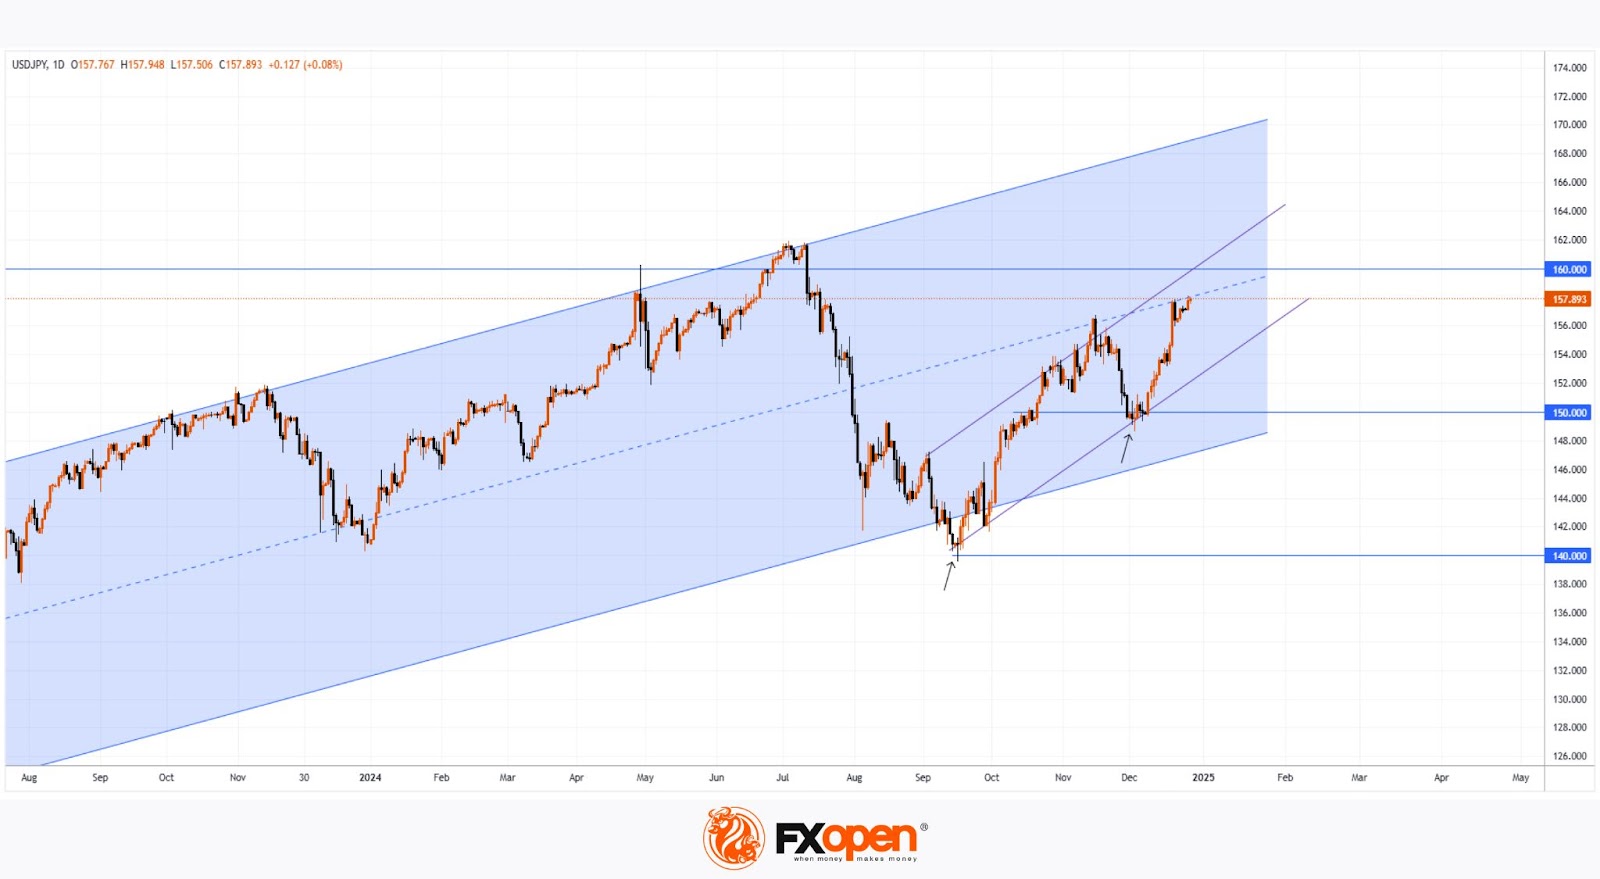
According to technical analysis of the USD/JPY chart, the pair is trending within a well-defined upward channel (marked in blue) with the following notable developments:
→ In September, the psychological level of 140 yen per dollar served as strong support for bulls, while in December, this shifted to 150 yen per dollar (as indicated by arrows).
→ Since September, price movements have established a steeper upward channel (highlighted in purple).
→ The pair has now reached the median line of the longer-term blue channel, suggesting a potential for more stable trading. This stability may also be supported by reduced trading activity during the holiday season.
The current price action mirrors the conditions seen in summer 2024, when the pair steadily rose toward the critical level of 160 yen per dollar. As we enter early 2025, bulls may once again test this key threshold, seeking to push the pair higher.
Trade over 50 forex markets 24 hours a day with FXOpen. Take advantage of low commissions, deep liquidity, and spreads from 0.0 pips. Open your FXOpen account now or learn more about trading forex with FXOpen.
This article represents the opinion of the Companies operating under the FXOpen brand only. It is not to be construed as an offer, solicitation, or recommendation with respect to products and services provided by the Companies operating under the FXOpen brand, nor is it to be considered financial advice.
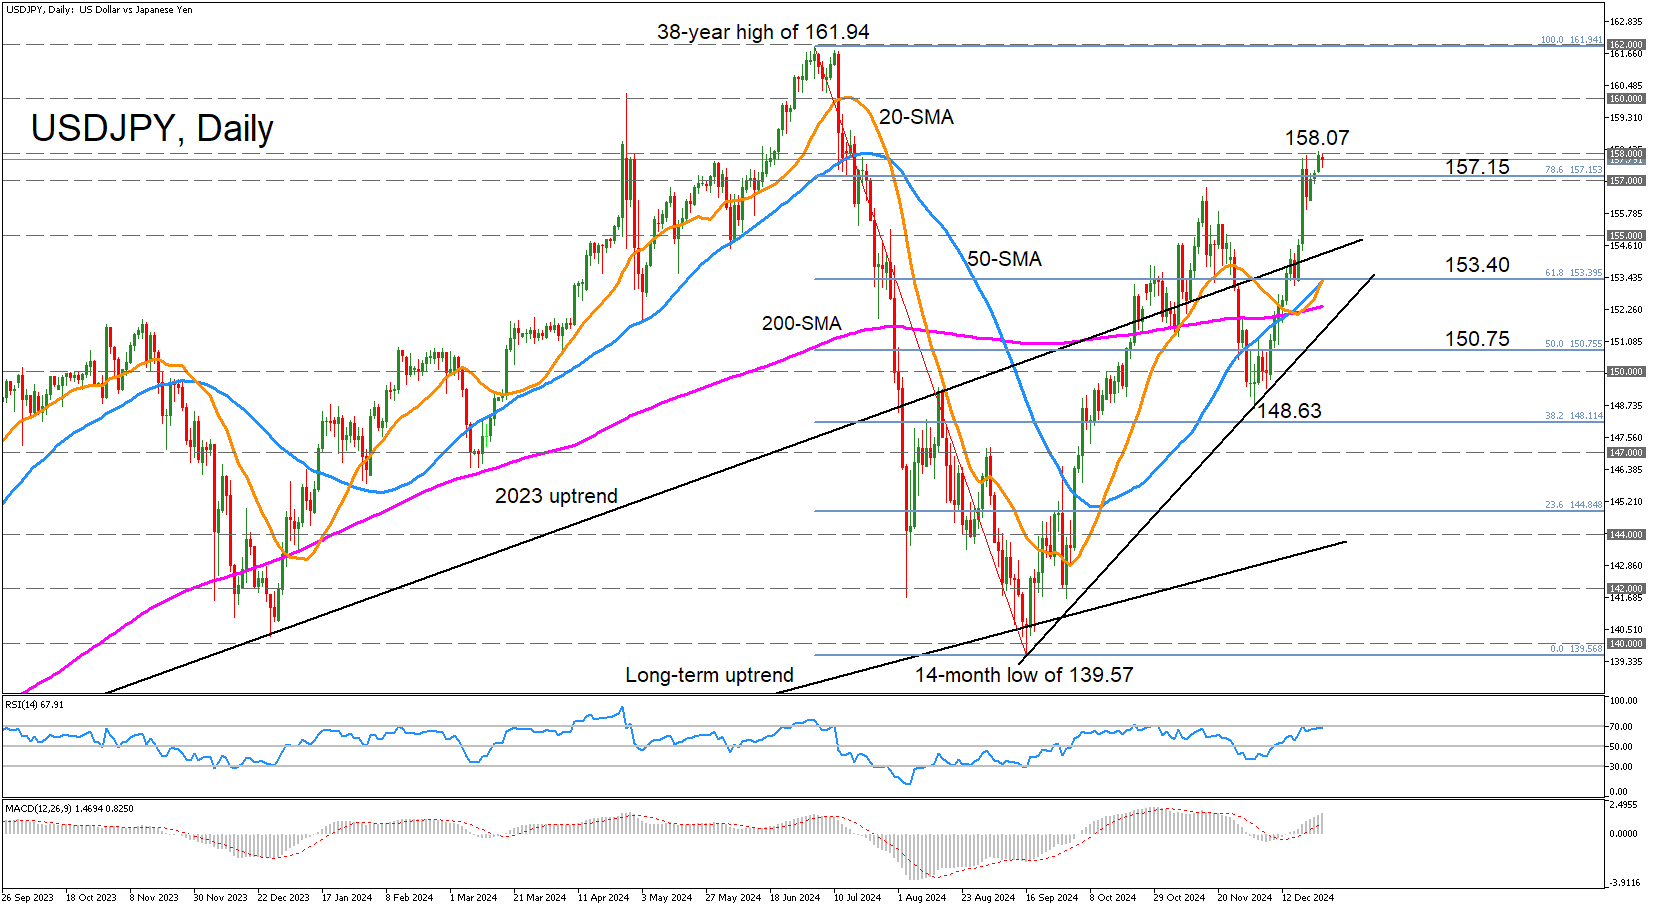
USD/JPY Tests 158.00 Level for First Time in Five Months
- USD/JPY extends uptrend to 5-month highs, reaches 158.00.
- But positive momentum may be waning.
USD/JPY crossed above the 158.00 mark on Thursday for the first time since July, but the price is trading slightly below that significant level on Friday. The RSI is reflecting the weaker upside momentum as it appears to be plateauing just below the 70 overbought area. But the MACD continues to climb higher and remains well above its red signal line.
The bulls would need to successfully overcome the resistance in the 158.00 region if the upside momentum is to strengthen or even last. A break above it would bring into focus the psychologically important 160.00 milestone, and an even more crucial level awaits at 162.00, where prices failed to breach it in early July. Nevertheless, rising above 162.00 would reinforce the pair’s long-term bullish outlook.
However, if the 158.00 resistance proves difficult to crack and the price reverses lower, there’s likely to be immediate support around the 78.6% Fibonacci retracement of the July-September downtrend at 157.15. A drop below it would bring into scope the 155.00 level, which acted as strong support during May and June. Further down, the 61.8% Fibonacci is another strong obstacle for the bears as it is being fortified by the 20- and 50-day simple moving average (SMA) in the 153.40 region.
Should the losses stretch all the way until the December low of 148.63, the bullish structure would come into question, at least in the medium term.
In brief, USDJPY faces a potentially tough battle at 158.00 and surpassing it is essential to maintaining the current bullish phase. Failure to do so would risk shifting the medium-term picture to a more neutral one.
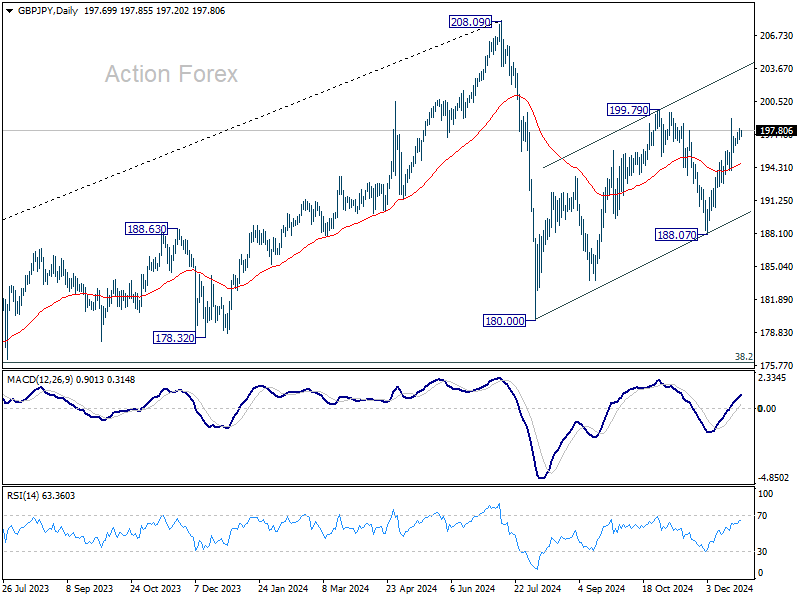
GBP/JPY Daily Outlook
Daily Pivots: (S1) 197.31; (P) 197.66; (R1) 198.30; More...
GBP/JPY is staying in range below 198.93 and intraday bias stays neutral. As noted before, corrective pattern from 180.00 is extending with another rising leg. Further rise is expected as long as 194.04 support holds. On the upside, above 1999.79 will will target channel resistance (now at 203.58).
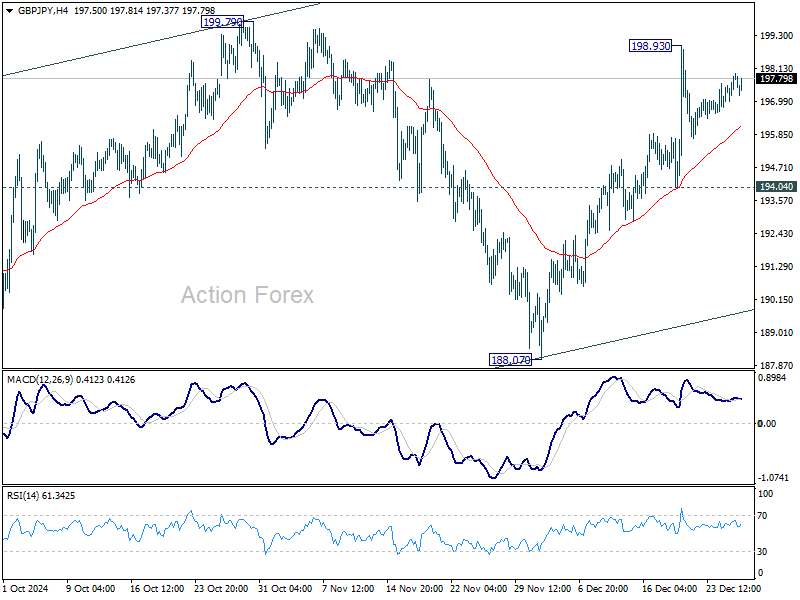
In the bigger picture, price actions from 208.09 are seen as a correction to whole rally from 123.94 (2020 low). The range of consolidation should be set between 38.2% retracement of 123.94 to 208.09 at 175.94 and 208.09. However, decisive break of 175.94 will argue that deeper correction is underway.
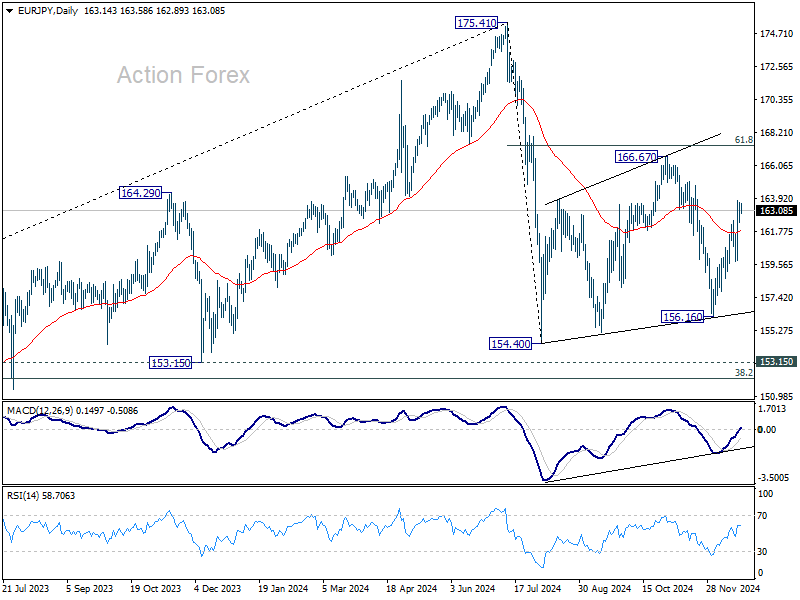
EUR/JPY Daily Outlook
Daily Pivots: (S1) 163.77; (P) 164.26; (R1) 165.20; More...
EUR/JPY's rally from 156.16 continues today and intraday bias stays on the upside. As noted before, corrective from 154.04 is extending with another rising leg. Further rise should be seen to 166.67 resistance next. On the downside, below 163.01 minor support will turn intraday bias neutral first.

In the bigger picture, price actions from 175.41 are seen as correction to rally from 114.42 (2020 low). The range of consolidation should have been set between 38.2% retracement of 114.42 to 175.41 at 152.11 and 175.41 high. However, decisive break of 152.11 would argue that deeper correction is underway.
EUR/GBP Daily Outlook
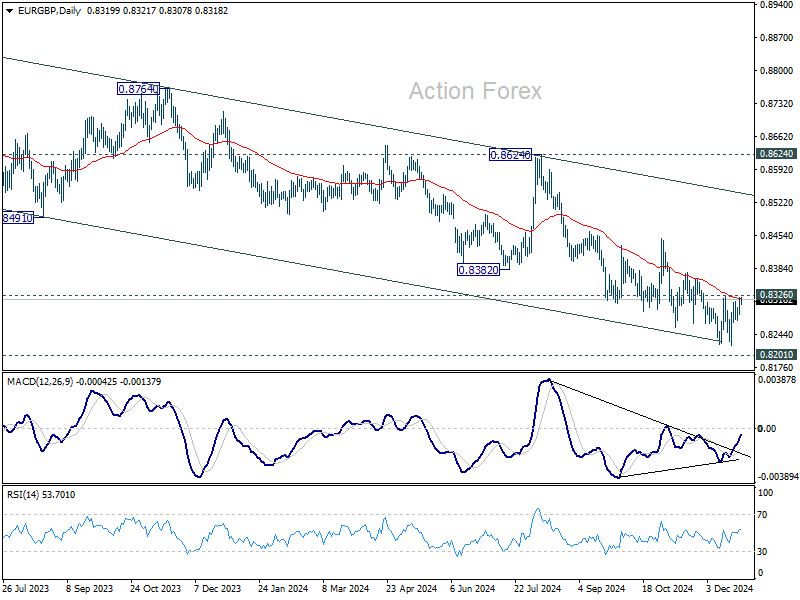
Daily Pivots: (S1) 0.8293; (P) 0.8309; (R1) 0.8337; More...
No change in EUR/GBP's outlook and intraday bias stays neutral. On the upside, break of 0.8326 resistance will confirm short term bottoming at 0.8221, ahead of 0.8201 key support, on bullish convergence condition in 4H MACD. Intraday bias will be turned back to the upside for 0.8446 structural resistance next.
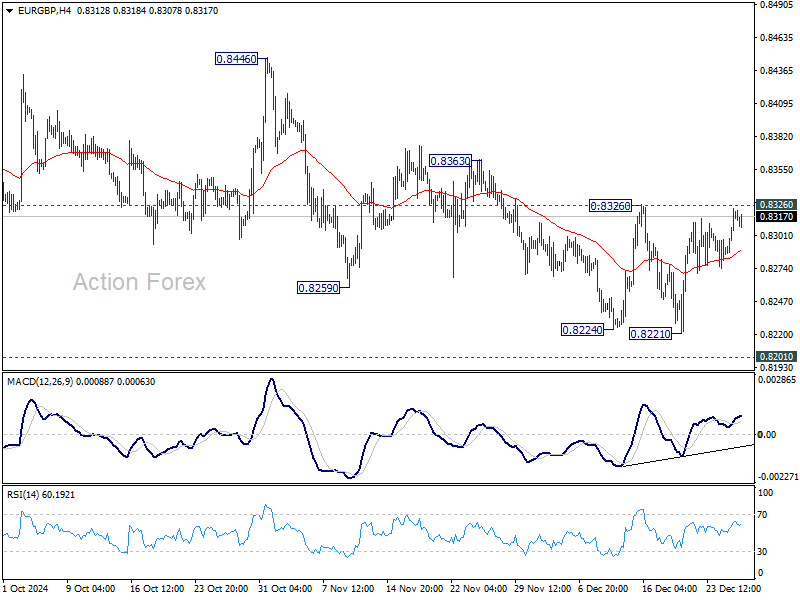
In the bigger picture, focus is now on whether 0.8201 key support (2022 low) is strong enough to complete the whole down trend from 0.9267 (2022 high). In any case, medium term outlook will be neutral at best until decisive break of 0.8624 key resistance. Otherwise, risk will stay on the downside even in case of strong rebound.