Sample Category Title
Yen Slides on BoJ Caution and Soft Inflation, Verbal Intervention Curbs Losses
Yen saw broad declines during Asian session, briefly falling below 158 against Dollar, but the selloff was quickly mitigated by verbal intervention, as least partially.
The decline was triggered by weaker-than-expected Tokyo inflation data. Stripping out energy and food prices, core-core inflation remained relatively stable, signaling limited urgency for BoJ to proceed with further rate hikes in the near term.
This aligns with the cautious tone seen in the BoJ’s December meeting summary, which revealed deep divisions among policymakers. While a minority of hawks pushed for "forward-looking" and "preemptive" actions, the majority seemed favoring a measured approach, citing concerns over wage growth and external risks.
Verbal intervention from Japanese officials helped limit losses in Yen, nevertheless. Finance Minister Katsunobu Kato reiterated the government’s commitment to addressing excessive currency movements, stating, "The Japanese government has been alarmed by foreign exchange developments, including those driven by speculators, and will take appropriate action against excessive moves." While this provided temporary relief, it was insufficient to reverse Yen's broader weakness.
For the week so far, Dollar is currently the strongest, supported by lingering strength from Fed’s recent hawkish outlook. However, the greenback's momentum remains constrained, with gains capped below last week’s highs amid thin year-end holiday trading. Euro has emerged as the second-strongest currency, followed by Loonie. Yen has taken the weakest spot, followed by Swiss Franc and Aussie. Both Kiwi and Sterling are positioning in the middle.
Looking ahead, market activity is expected to remain subdued through the rest of the week, with an ultra-light economic calendar offering little to stir volatility. The sole notable release is US goods trade balance, which is unlikely to prompt significant moves. Barring surprises, trading volumes are expected to remain low until after the New Year holiday next week.
BoJ summary highlights division on timing of rate hikes
BoJ Summary of Opinions from its December 18–19 meeting revealed a divided board on the timing of monetary policy normalization. While some members advocated for action soon, citing upside risks to prices, others expressed caution due to slow wage growth, soft overseas demand, and heightened uncertainties.
One member emphasized that with economic activity and prices aligning with BoJ’s outlook, risks to inflation were becoming "skewed to the upside." The member argued for a "forward-looking, timely, and gradual" adjustment of monetary policy. Similarly, another member noted that the sustained increase in prices over the past three years, partly driven by Yen's depreciation, would likely contribute to higher underlying inflation, warranting "preemptive" rate hikes.
Conversely, more dovish members maintained that the current risks to prices "do not suggest a pressing need" for rate hike. One member cited uncertainties surrounding tax and fiscal policies in Japan and the stance of the incoming US administration as reasons to maintain the current policy stance, emphasizing a risk management approach.
Overall, the BoJ board appears focused on assessing the outcomes of next year’s spring wage negotiations and the impact of US policy shifts before making further moves toward policy normalization.
Japan's Tokyo CPI core rises to 2.4% in Dec, but core-core dips to 1.8%
Japan's Tokyo core CPI (excluding food) rose from 2.2% yoy to 2.4% yoy in December, marking its highest level since August but falling short of expectations for 2.5%. The increase was largely driven by a 13.5% yoy surge in energy prices, reflecting the phase-out of government subsidies for gas and electricity bills. However, when excluding utility costs, inflation pressures appear steady.
Core-core CPI (excluding food and energy) softened to 1.8% yoy from 1.9% yoy, while services inflation edged up slightly from 0.9% to 1.0%. Meanwhile, headline inflation accelerated to 3.0% yoy from 2.6% yoy, with energy and food prices, including rice, contributing significantly to the increase too.
The uptick in Tokyo inflation highlights lingering pressures from rising utility and food costs, which may weigh on consumer spending and deter firms from implementing further price hikes. These factors, coupled with broader signs of economic weakness, could delay BoJ ’s timeline for raising interest rates.
Japan's industrial output slips -2.3% mom in Nov, indecisive fluctuation continues
Japan's industrial production declined -2.3% mom in November, outperforming expectations of a -3.4% mom drop, but marking the first contraction in three months.
The decrease was driven by weaker exports of semiconductor manufacturing devices and cars, highlighting challenges in external demand. Out of 15 industrial sectors, 11 recorded declines, while 3 sectors reported gains.
Production machinery saw a significant -9.1% drop, largely due to falling exports of chip-making equipment to China and Taiwan, while motor vehicle output fell -4.3%, and fabricated metal products dropped -5.7%.
Despite the slump, the Ministry of Economy, Trade, and Industry maintained its view that industrial production "fluctuates indecisively," while warning of risks tied to the economic outlooks of the US and China.
Looking ahead, METI's poll of manufacturers predicts a rebound, with output expected to rise 2.1% in December and an additional 1.3% in January.
Separately, retail sales posted a robust 2.8% yoy gain, exceeding expectations of 1.5%, signaling resilience in domestic demand.
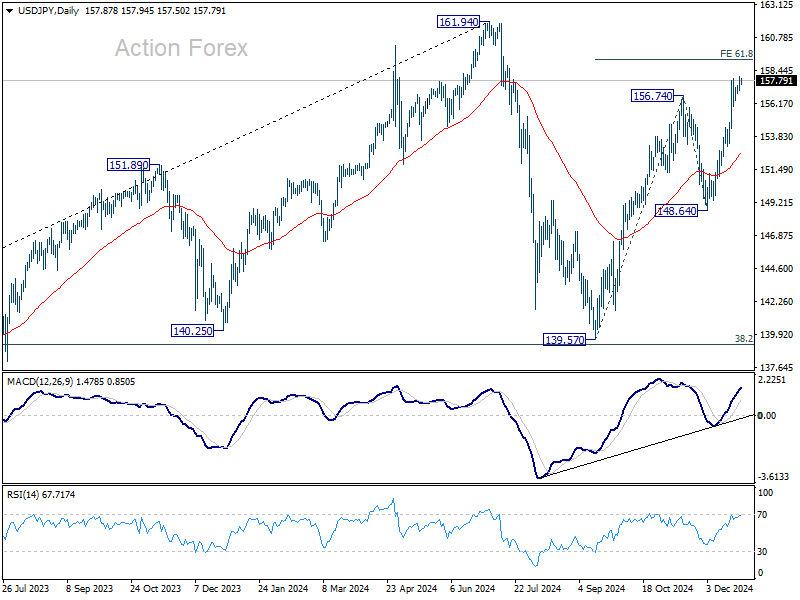
USD/JPY Daily Outlook
Daily Pivots: (S1) 157.32; (P) 157.70; (R1) 158.42; More...
USD/JPY's rally is trying to resume by breaching 157.91 temporary top and intraday bias is back on the upside. Rise from 139.57 is extending to 61.8% projection of 139.57 to 156.74 from 148.64 at 159.25 next. Firm break there will pave the way back to 161.94 high. On the downside, though, below 156.88 minor support will turn intraday bias neutral again.
In the bigger picture, price actions from 161.94 are seen as a corrective pattern to rise from 102.58 (2021 low). The range of medium term consolidation should be set between 38.2% retracement of 102.58 to 161.94 at 139.26 and 161.94. Nevertheless, sustained break of 139.26 would open up deeper medium term decline to 61.8% retracement at 125.25.
Santa in Japan
Those glued to their screens, hoping for Santa’s arrival, were left disappointed. The major US indices weren’t in good shape yesterday even after a mixed bag of US jobs data showed that the continuing jobless claims in the US advanced to the highest levels in more than 3 years – a sign that it takes longer for people in the US to find a new job. But alas, the bad news did little to boost the Federal Reserve (Fed) doves and support the equity rally. The US 2-year yield fluctuated between 4.30-4.35% range, the S&P500 was slightly down on Thursday, Nasdaq 100 retreated 0.13% and even Bitcoin gave back the Xmas day gains and is settling near the $96K level this morning. But the Dow Jones – which has been going against its tech-heavy major peers lately was very slightly up – by 0.07%, and the mid and small caps eked out better performances. The Russell 2000 gained up to 90% - as a sign of rotation toward smaller and less technology heavy pockets of the market.
In China, equities are better bid since Chinese authorities pledge on Tuesday to sell a record amount of 3 trillion yuan worth of special treasury bonds next year to give support to the economy. The money would be used to boost consumption and investment. But China’s path to recovery will be bumpy. The data released a few hours earlier showed that the industrial profits continue to plunge. They have been almost 5% lower y-o-y last month. And the workforce in finance and property shrank over the past years for the first time on record; the number of people working for developers dived by 27% since the end of 2023.
Santa is in Japan this Xmas
The Nikkei index surged past the 40’000 mark on the back of a weakening yen as the bears are out and selling the yen since the Bank of Japan (BoJ) bypassed a rate hike earlier this month, and more importantly, said that they would wait until next March/April to have more clarity on how the Trump policies will play out. As such, the USDJPY spent Xmas bumping its head against the 158 offers. Today, the yen looks stronger on the back of a freshly released set of stronger-than-expected economic data showing that inflation in Tokyo rose to 3% in December, while retail sales in the country jumped to 2.8% in November, and the contraction in industrial production unexpectedly slowed during the same month. But the BoJ hawks are hard to convince. As it has been the case for most of 2024, the only thing that cools down the yen selloff is the threat from the Japanese officials to intervene and buy the yen. Therefore, buying the dips in the USDJPY is still interesting, and buying the Japanese stocks remains a popular thing to do.
Elsewhere, in the FX, the US dollar index was mostly steady this week – as most traders in major economies were busy dining and wining in Xmas parties. But the latter didn’t prevent the EURUSD from gently pushing lower on rising – and funded - worries that the newly formed French government will face the same faith than the previous one: a divided government that will unlikely approve a reasonable budget proposal to bring the ballooning deficit toward 5%. And the deficits that spiral higher is generally not great news for the euro as the French-German 10-year spread is preparing to close the year near 80bp – the highest since the European sovereign debt crisis a decade ago.
Across the Channel, hope that 2025 will bring good health to the UK economy - ideally with improved relations with once-loved and cherished ones - persists, but the path remains shaky. Cable has been testing the 1.25 support with a greater chance to break the latter to the downside than otherwise. Elsewhere, the AUDUSD is testing the 62 cents support while the USDCAD is trying to find support near the 1.44 this morning – it looks like Trump’s proposal to make Canada the 51st state of the United States didn’t improve sentiment... The rising political risks in Canada, combined to unsupportive oil prices continue to back a further advance in the USDCAD.
Speaking of oil, it’s the same, old narrative. The barrel makes an attempt above the 50-DMA, but remains topped by offers before reaching the 100-DMA – which currently stands near the $71.30pb level. Yesterday’s API data showed a more than 3-mio barrel retreat in US oil inventories. But the drawback barely vacuumed the bulls in, and the weekly data has little power to reverse the bearish trend that will stay intact below the $72.85pb level, which is the major 38.2% Fibonacci retracement on the latest selloff. Crude is set to close the year in the bearish consolidation zone, still waiting for China to get better and to narrow the global supply glut that’s expected to average near 1mbpd in 2025, according to the IEA.
BoJ summary highlights division on timing of rate hikes
BoJ Summary of Opinions from its December 18–19 meeting revealed a divided board on the timing of monetary policy normalization. While some members advocated for action soon, citing upside risks to prices, others expressed caution due to slow wage growth, soft overseas demand, and heightened uncertainties.
One member emphasized that with economic activity and prices aligning with BoJ’s outlook, risks to inflation were becoming "skewed to the upside." The member argued for a "forward-looking, timely, and gradual" adjustment of monetary policy. Similarly, another member noted that the sustained increase in prices over the past three years, partly driven by Yen's depreciation, would likely contribute to higher underlying inflation, warranting "preemptive" rate hikes.
Conversely, more dovish members maintained that the current risks to prices "do not suggest a pressing need" for rate hike. One member cited uncertainties surrounding tax and fiscal policies in Japan and the stance of the incoming US administration as reasons to maintain the current policy stance, emphasizing a risk management approach.
Overall, the BoJ board appears focused on assessing the outcomes of next year’s spring wage negotiations and the impact of US policy shifts before making further moves toward policy normalization.
Japan’s industrial output slips -2.3% mom in Nov, indecisive fluctuation continues
Japan's industrial production declined -2.3% mom in November, outperforming expectations of a -3.4% mom drop, but marking the first contraction in three months.
The decrease was driven by weaker exports of semiconductor manufacturing devices and cars, highlighting challenges in external demand. Out of 15 industrial sectors, 11 recorded declines, while 3 sectors reported gains.
Production machinery saw a significant -9.1% drop, largely due to falling exports of chip-making equipment to China and Taiwan, while motor vehicle output fell -4.3%, and fabricated metal products dropped -5.7%.
Despite the slump, the Ministry of Economy, Trade, and Industry maintained its view that industrial production "fluctuates indecisively," while warning of risks tied to the economic outlooks of the US and China.
Looking ahead, METI's poll of manufacturers predicts a rebound, with output expected to rise 2.1% in December and an additional 1.3% in January.
Separately, retail sales posted a robust 2.8% yoy gain, exceeding expectations of 1.5%, signaling resilience in domestic demand.
Japan’s Tokyo CPI core rises to 2.4% in Dec, but core-core dips to 1.8%
Japan's Tokyo core CPI (excluding food) rose from 2.2% yoy to 2.4% yoy in December, marking its highest level since August but falling short of expectations for 2.5%. The increase was largely driven by a 13.5% yoy surge in energy prices, reflecting the phase-out of government subsidies for gas and electricity bills. However, when excluding utility costs, inflation pressures appear steady.
Core-core CPI (excluding food and energy) softened to 1.8% yoy from 1.9% yoy, while services inflation edged up slightly from 0.9% to 1.0%. Meanwhile, headline inflation accelerated to 3.0% yoy from 2.6% yoy, with energy and food prices, including rice, contributing significantly to the increase too.
The uptick in Tokyo inflation highlights lingering pressures from rising utility and food costs, which may weigh on consumer spending and deter firms from implementing further price hikes. These factors, coupled with broader signs of economic weakness, could delay BoJ ’s timeline for raising interest rates.
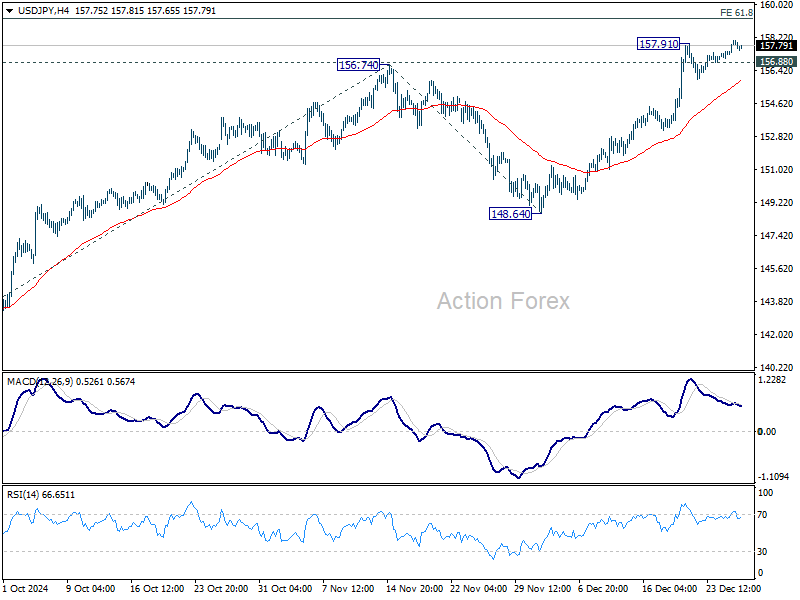
USD/JPY Sets Sights on Fresh Gains: Bulls In Control
Key Highlights
- USD/JPY started a fresh increase above the 156.00 resistance zone.
- A major bullish trend line is forming with support at 156.80 on the 4-hour chart.
- EUR/USD is still consolidating below the 1.0450 resistance zone.
- Bitcoin failed to regain traction and declined from $100,000.
USD/JPY Technical Analysis
The US Dollar started a fresh increase above the 155.50 and 156.00 resistance levels. USD/JPY cleared the 157.00 level to move further into a positive zone.
Looking at the 4-hour chart, the pair settled well above the 156.50 level, the 100 simple moving average (red, 4-hour), and the 200 simple moving average (green, 4-hour). The bulls remained in control and might aim for more gains.
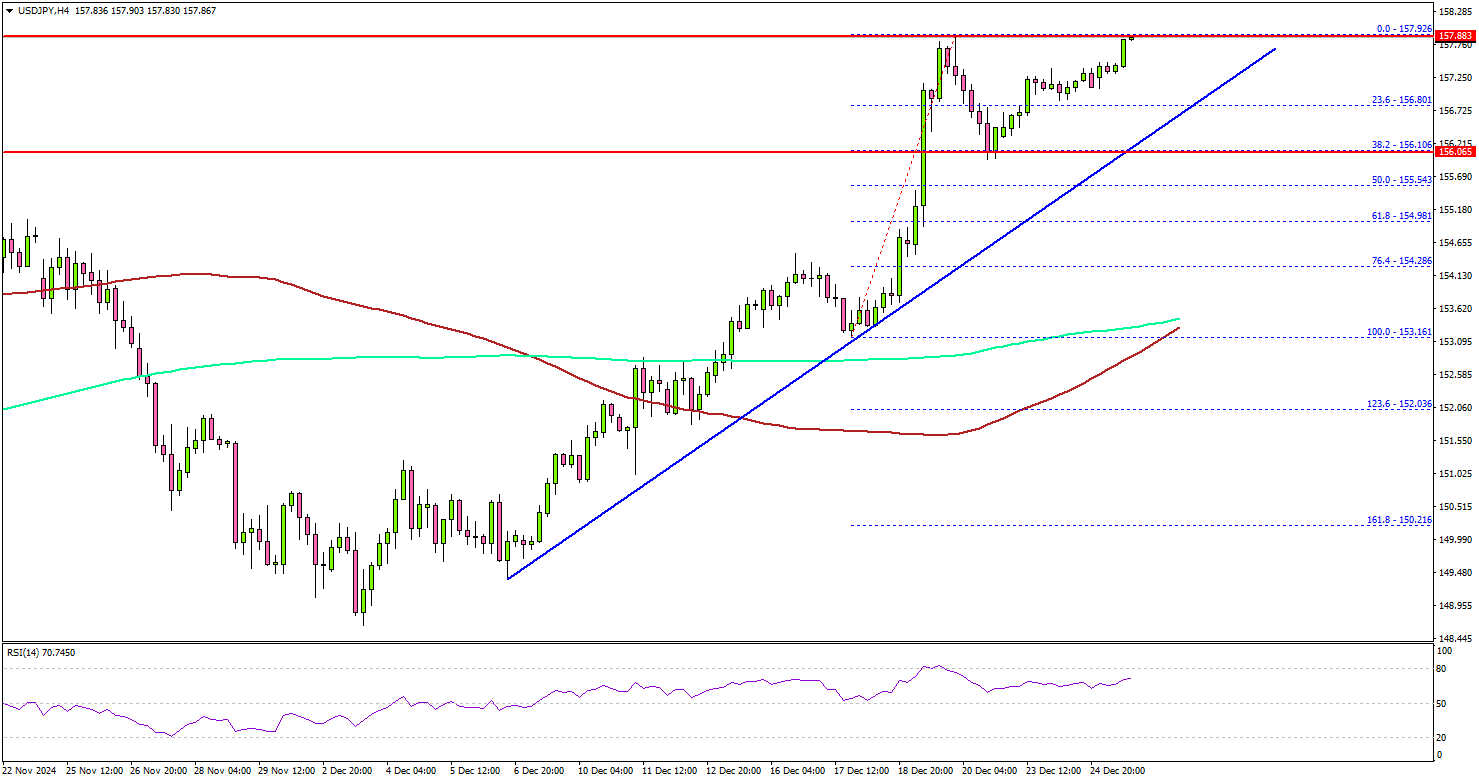
On the upside, the pair could face resistance near the 158.20 level. The next major resistance is near the 158.80 level. A close above the 158.80 level could set the tone for another increase.
In the stated case, the pair could rise toward the 160.00 resistance. On the downside, immediate support sits near the 156.80 level. There is also a major bullish trend line forming with support at 156.80 on the same chart.
The next key support sits near the 155.50 level. Any more losses could send the pair toward the 154.80 level. Any more losses might send the pair toward the 154.00 level.
Looking at Bitcoin, the bulls failed to push the price above $100,000 and there was a fresh bearish reaction.
Upcoming Economic Events:
- US Wholesale Inventories for Nov 2024 (preliminary) – Forecast +0.2%, versus +0.2% previous.
Elliott Wave View: EURGBP Rally Expected to Fail
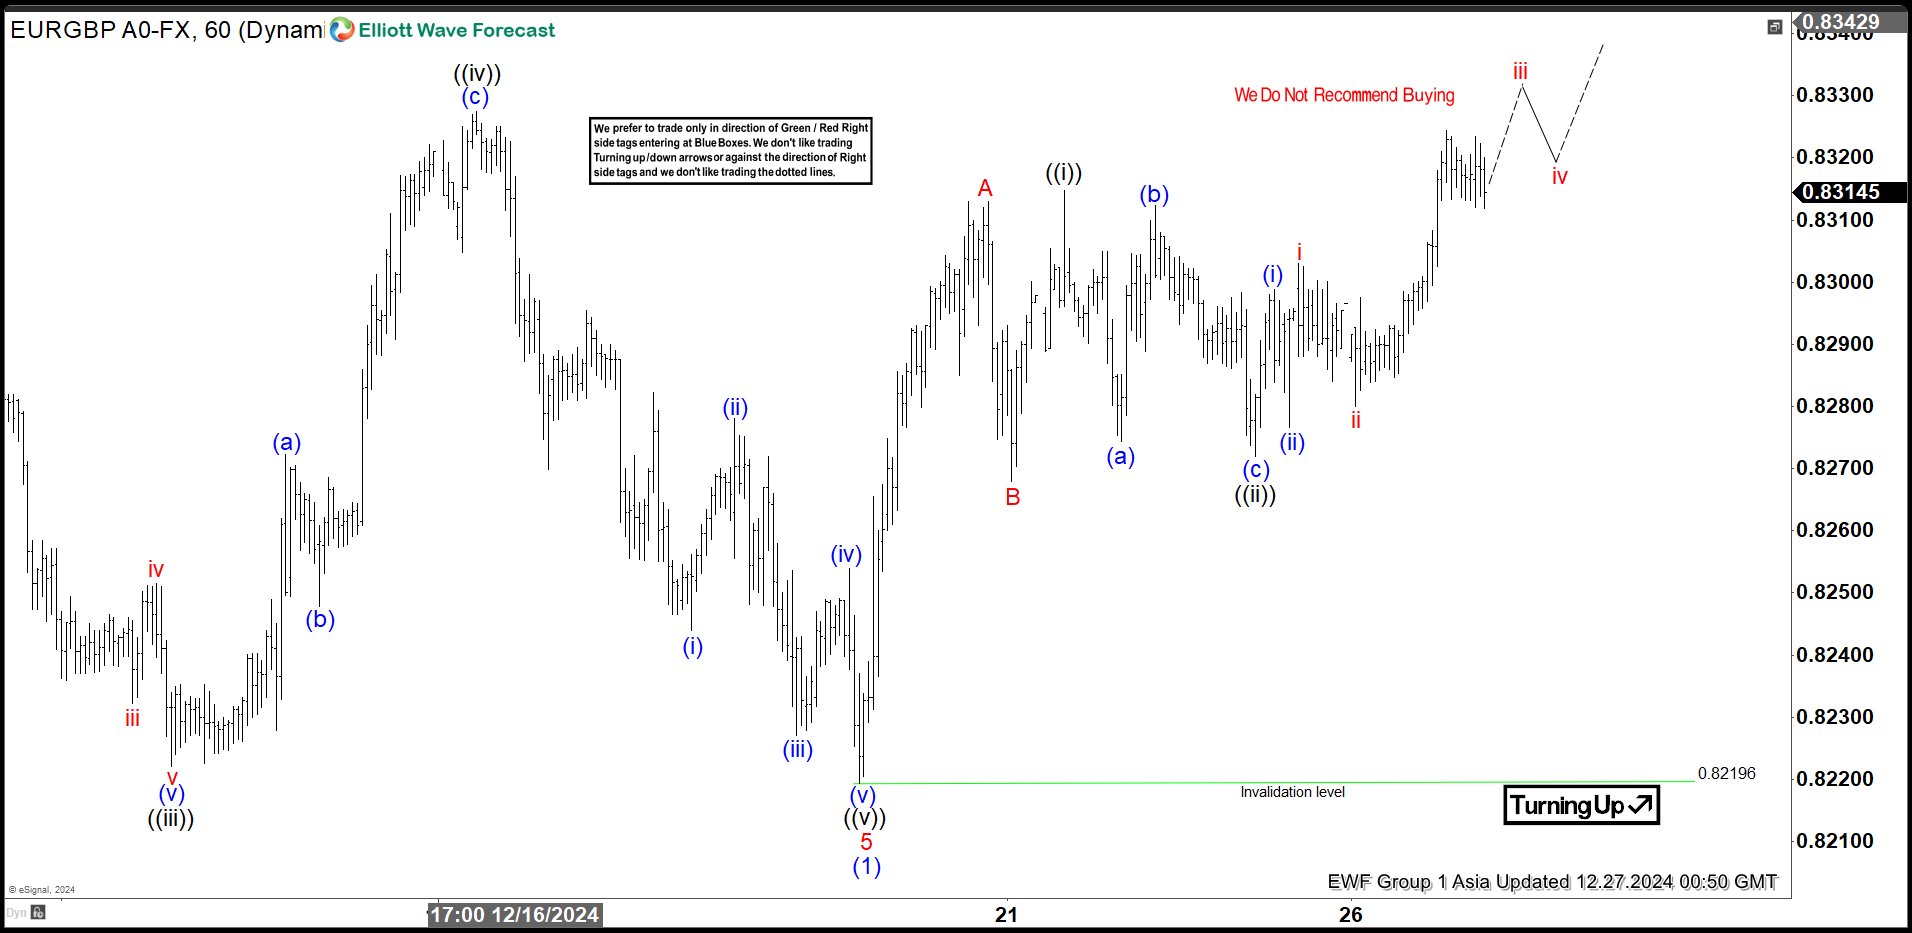
Short Term Elliott Wave view of EURGBP suggests decline from 8.8.2024 high ended as wave (1) at 0.8219 as an impulse. Down from 8.8.2024 high, wave 1 ended at 0.8295 and rally in wave 2 ended at 0.844. Wave 3 lower ended at 0.826 and rally in wave 4 ended at 0.8375. Down from there, wave ((i)) of 5 ended at 0.8268 and wave ((ii)) of 5 ended at 0.8364. Wave ((iii)) of 5 lower ended at 0.8225 and wave ((iv)) of 5 ended at 0.8327. Final wave ((v)) of 5 ended at 0.8222. This completed wave (1) in higher degree.
Wave (2) corrective rally is in progress with internal subdivision as a zigzag Elliott Wave structure. Up from wave (1), wave A ended at 0.8313 and pullback in wave B ended at 0.8268. Wave C higher is in progress as an impulse structure. Up from wave B, wave ((i)) ended at 0.8314 and pullback in wave ((ii)) ended at 0.8272. Near term, as far as pivot at 0.8219 low stays intact, expect pullback to find support in 3, 7, 11 swing for further upside. Target higher for wave (2) is 100% – 161.8% Fibonacci extension of wave A. This area comes at 0.836 – 0.8419 where sellers can appear for 3 waves pullback at least.
EURGBP 60 Minutes Elliott Wave Chart
EURGBP Elliott Wave Video
https://www.youtube.com/watch?v=CMXDHJK1wpY
AUDUSD Wave Analysis
- AUDUSD reversed from resistance level 0.6270
- Likely to fall to support level 0.6200
AUDUSD currency pair recently reversed down from the resistance level 0.6270 (former multi-month support from the start October of 2023, acting as the resistance after it was broken yesterday).
The downward reversal from the resistance level 0.6270 stopped the previous minor correction iv – which belongs to sharp sub-impulse 3 of the higher impulse wave (3) from September.
AUDUSD can be expected to fall to the next support level 0.6200, which stopped the previous impulse wave iii earlier this month.

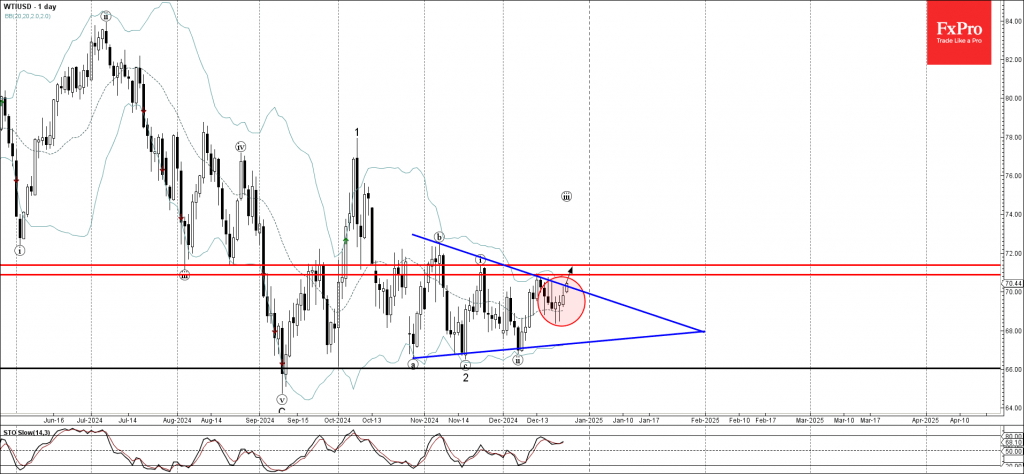
WTI Wave Analysis
- WTI broke daily Triangle
- Likely to rise to resistance level 70.90
WTI crude oil today broke the resistance trendline of the daily Triangle from the end of October, inside which the price has been moving from October.
The breakout of this Triangle continues the active short-term impulse wave (iii) of the higher order impulse wave 3 from the middle of November.
WTI crude oil can be expected to rise to the next resistance level 70.90, the breakout of which can lead to further gains toward 71.40.