
Sample Category Title
Canadian Dollar Eyes GDP
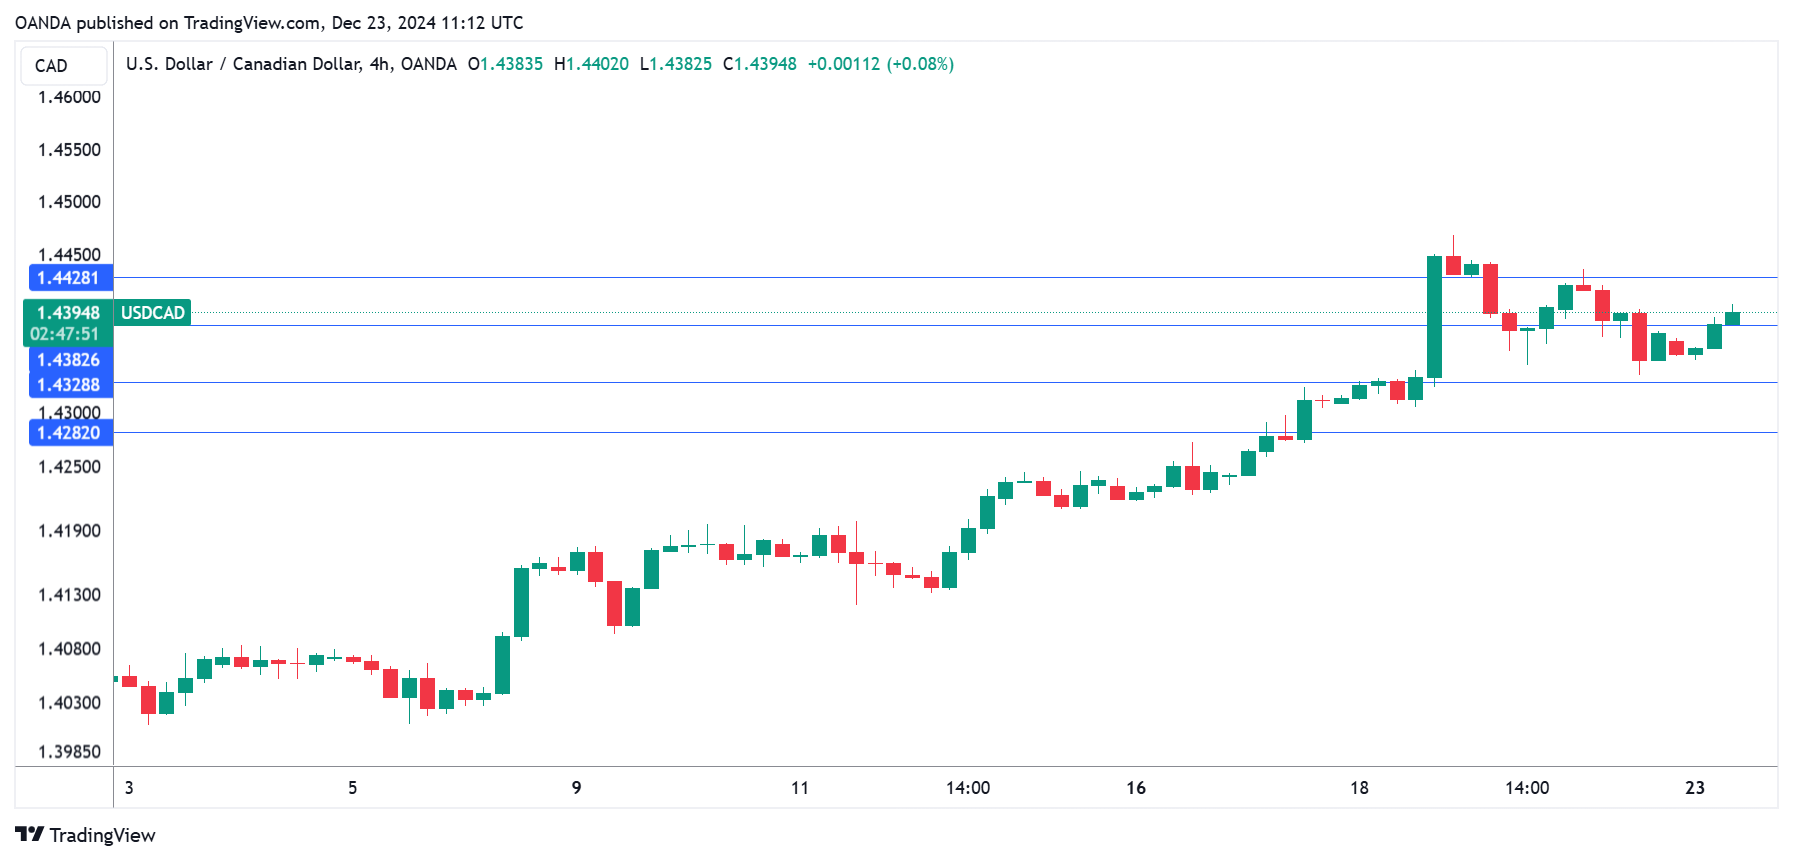
The Canadian dollar posted its fourth straight losing week, declining about 1%. In Monday’s European session, USD/CAD is trading at 1.4397, up 0.16% at the time of writing.
Canada’s GDP expected to remain at 0.1%
The market is keeping expectations low for today’s GDP report, with a forecast of 0.1% m/m for October after a 0.1% gain in September. The economy grew at annualized rate of 1% in the third quarter, which was below the Bank of Canada’s forecast of 1.5%.
The economy outlook remains weak and the Bank of Canada is expected to continue lowering rates in order in order to kick-start the economy. The BoC has been aggressive, cutting rates five times since June for a total of 175 basis points. The central bank slashed the benchmark rate by 50 basis points to 3.25% earlier this month, the first time since the covid pandemic that the BoC has delivered back-to-back jumbo cuts of 50 basis points. We can expect a dovish shift in rate policy, however, as Governor Macklem said that the BoC would take a “more gradual approach to monetary policy”. This is likely to mean rate cuts in increments of 25 bp, provided that inflation and employment data comes in as expected.
The New Year could bring be marked by political instability in Canada. Finance Minister Chrystia Freeland quit the government last week and Prime Minister Trudeau could face a non-confidence motion from his coalition partner in January. Trudeau has plummeted in popularity and increasingly it appears that his days as prime minister are numbered.
The US wrapped up the week with the personal consumption expenditures price index, the Fed’s preferred inflation indicator. Headline PCE dropped to 0.1% in November from 0.2% in October but annually ticked higher to 2.4%, up from 2.3%.
Core PCE was unchanged at 2.8% y/y. Monthly, core CPI rose 0.1% from 0.3% in October. The data indicated that inflation showed limited movement in November but remains above the Fed’s 2% target.
USD/CAD Technical
- USD/CAD is testing resistance at 1.4382. Above, there is resistance at 1.4428
- 1.4328 and 1.4282 are the next support levels
CADJPY: Symmetrical triangle
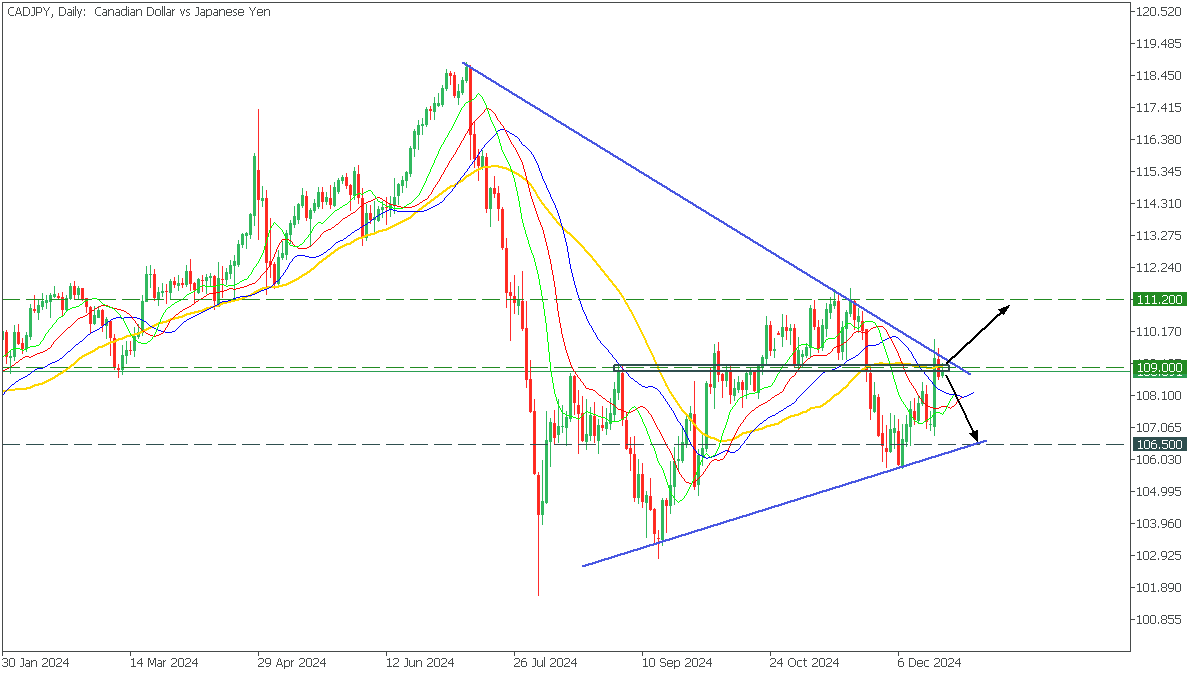
CADJPY, Daily
In the Daily timeframe, CADJPY formed a symmetrical triangle pattern. The price is testing the upper trend line and MA50. At the same time, the lips crossed the jaw of the Alligator, indicating a possible upside.
- If the bulls push the price above the trend line and 109.000, the upside to 111.200 will start;
- A bounce off the upper trendline will drop the price to the lower trendline of 106.500;
USDCHF: Symmetrical Triangle
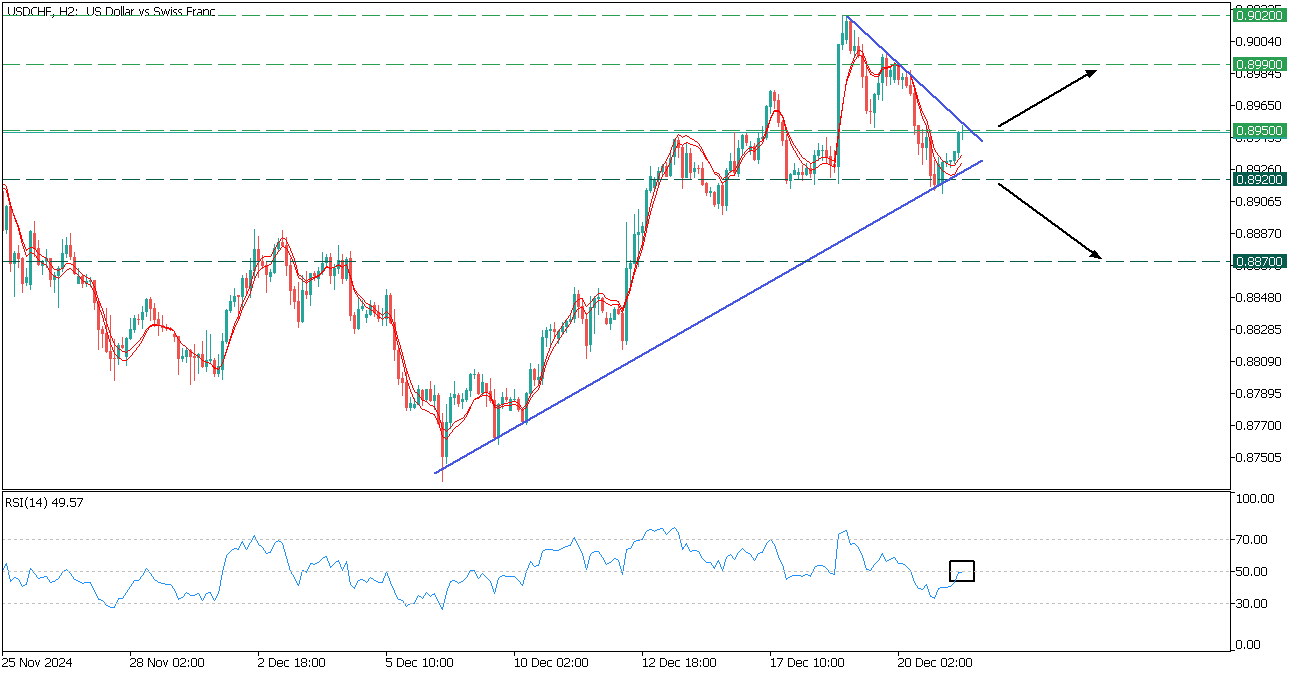
USDCHF, H2
USDCHF is navigating within a symmetrical triangle, sandwiched between the 0.8950 resistance and the 0.8920 support.
- The price breaks above the DEMA and TEMA, while the RSI breaks below the 50-line.
- If the price breaks above the upper trendline, the next target will be at the 0.8990 resistance.
- However, breaching below the 0.8920 support will trigger a decline toward the 0.8870.
Bitcoin Fell Back to Local Support
Market Picture
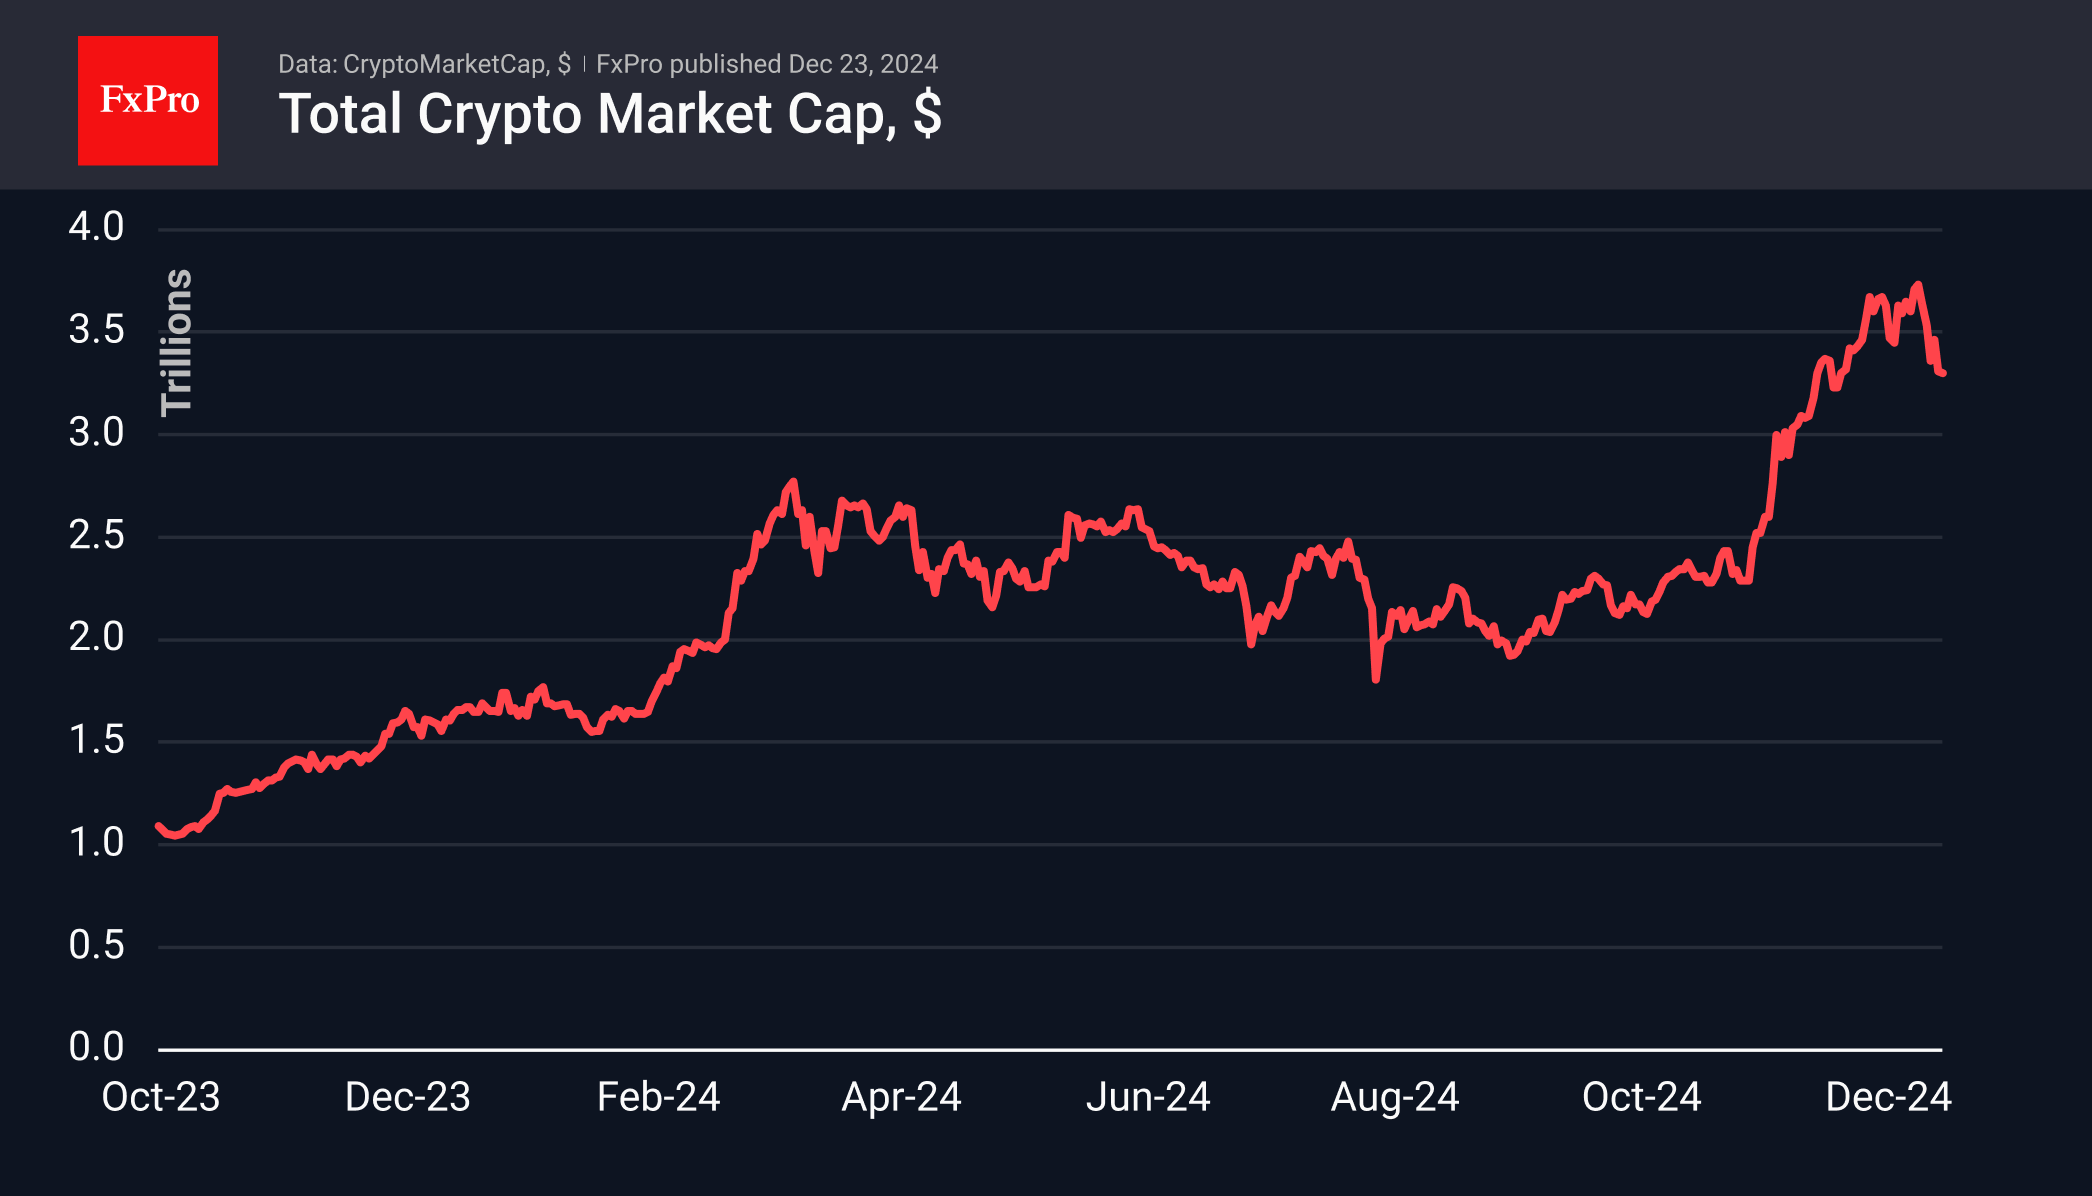
The crypto market retreated last week and is in no hurry to recover, remaining at $3.31 trillion, roughly where it was 30 days ago. The sharp dip below $3.2 trillion was also quickly bought back, but a full-blown rebound is yet to be seen. Markets continue to digest the Fed’s tougher tone, reinforced by the accumulated urge to lock in profits after a strong year.
The Crypto Market Sentiment Index is in neutral territory, compared to the shuttling between fear and extreme fear in US stocks.
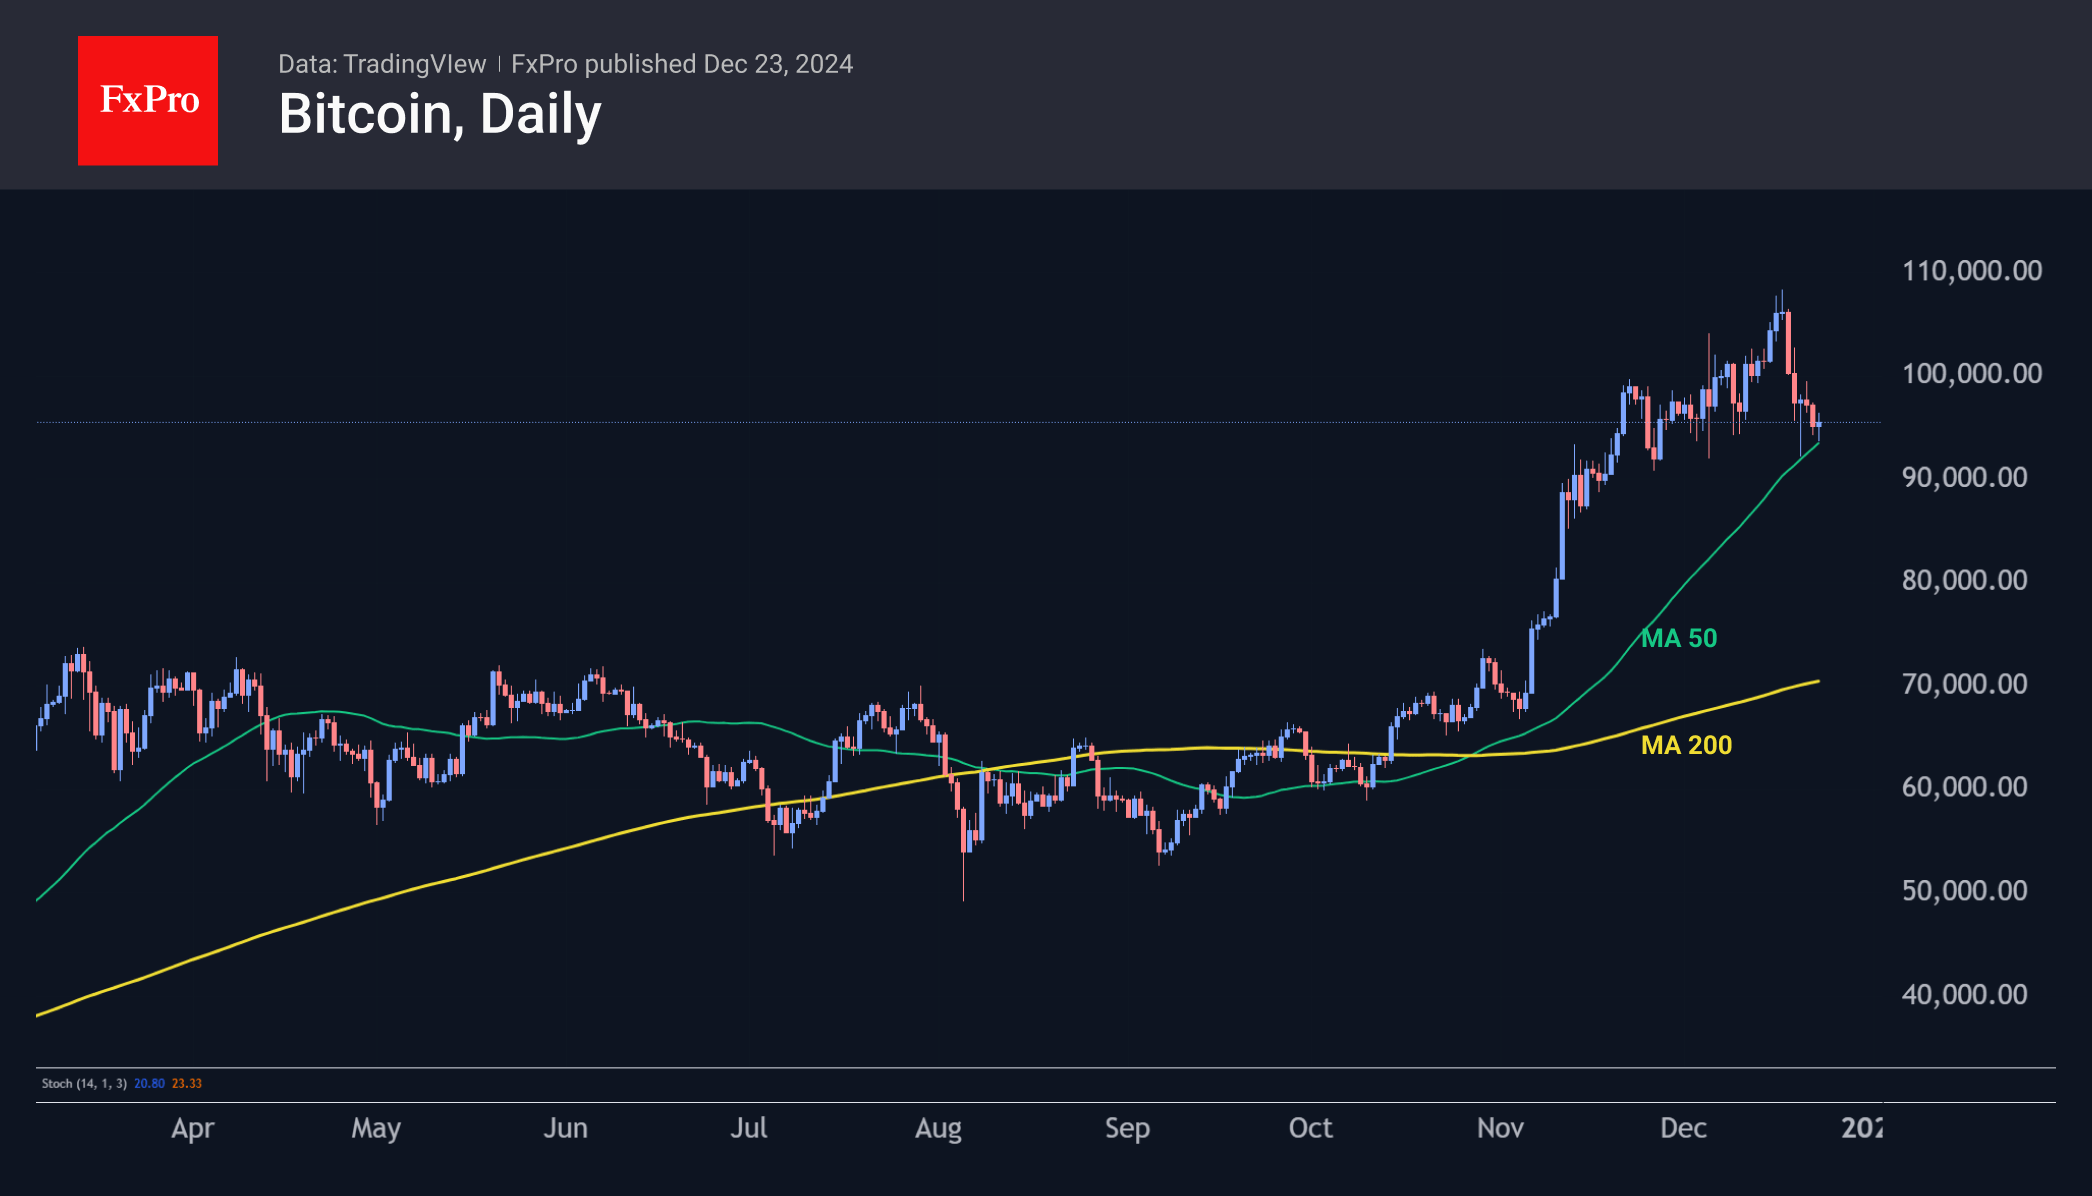
Bitcoin is trading around $95.5K, receiving support near the 50-day moving average on Friday and Monday. While we expected to see the market decline here, it’s too early to say this is the end of the correction. Further declines in the stock market, of which there are many in Bitcoin and Ethereum, could trigger institutional investors, launching a deeper pullback.
Reduced holiday liquidity has the potential to amplify this amplitude. In a potential shock scenario, they see a dip into the $70K area. However, there are more chances that a pullback to $90K in the next couple of weeks will be attractive enough for buyers to stop the sell-off.
News Background
Matrixport expects that the first cryptocurrency could see a strong start in early 2025. Messari predicts that Bitcoin and real-world tokenised assets (RWAs) will be the focus of investor attention in 2025.
The average duration between Bitcoin’s first and last all-time high (ATH) in a cycle is 318 days, K33 Research noted. If the pattern repeats, the next global peak will be reached on 17 January, before the inauguration of US President-elect Donald Trump. Analysts noted an increase in coins available on the market to the highest since 2021 (22% of supply), driven by Mt. Gox proceeds and government sales.
The US SEC approved the first spot ETFs combining Bitcoin and Ethereum, issued by Hashdex and Franklin Templeton.
El Salvador will expand BTC purchases in defiance of the IMF deal. El Salvador’s National Bitcoin Office said the country will continue to buy the first cryptocurrency and possibly at an ‘accelerated pace’.
US mining company MARA has launched a second project in Finland to use the heat generated by cryptocurrency mining for home heating. With this latest initiative, 80,000 residents of the country will be provided with heat generated by mining equipment.
GBP/JPY Daily Outlook
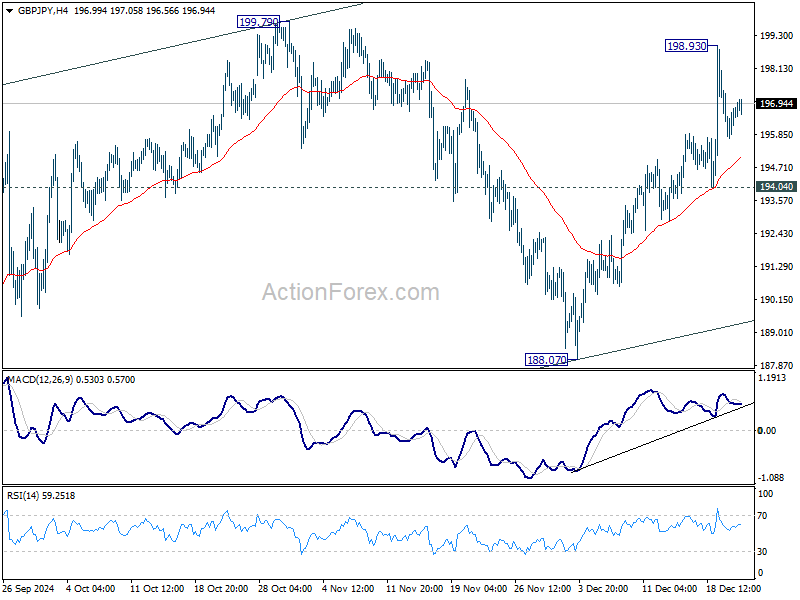
Daily Pivots: (S1) 195.79; (P) 196.55; (R1) 197.34; More...
Intraday bias in GBP/JPY remains neutral at this point. As noted before, corrective pattern from 180.00 is extending with another rising leg. Further rise is expected as long as 194.04 support holds. On the upside, above 1999.79 will will target channel resistance (now at 203.19).
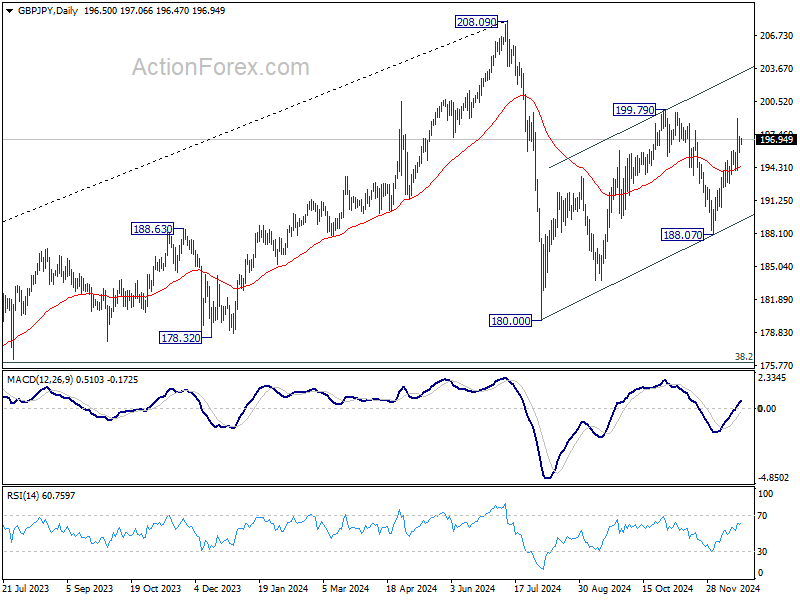
In the bigger picture, price actions from 208.09 are seen as a correction to whole rally from 123.94 (2020 low). The range of consolidation should be set between 38.2% retracement of 123.94 to 208.09 at 175.94 and 208.09. However, decisive break of 175.94 will argue that deeper correction is underway.
EUR/JPY Daily Outlook
Daily Pivots: (S1) 162.42; (P) 163.04; (R1) 163.73; More...
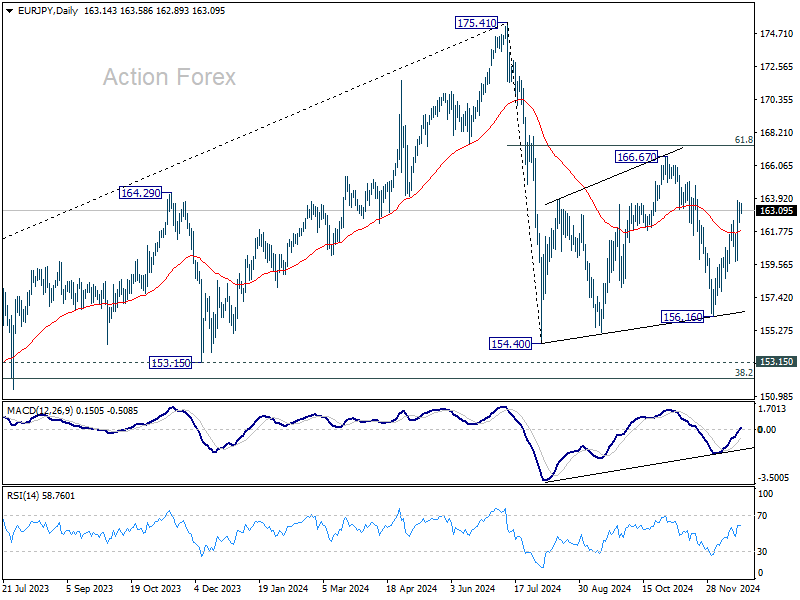
Intraday bias in EUR/JPY stays on the upside for the moment. Corrective pattern from 154.04 is extending with another rising leg. Further rise should be seen to 166.67 resistance next. For now, risk will stay on the upside as long as 159.79 support holds, in case of retreat.
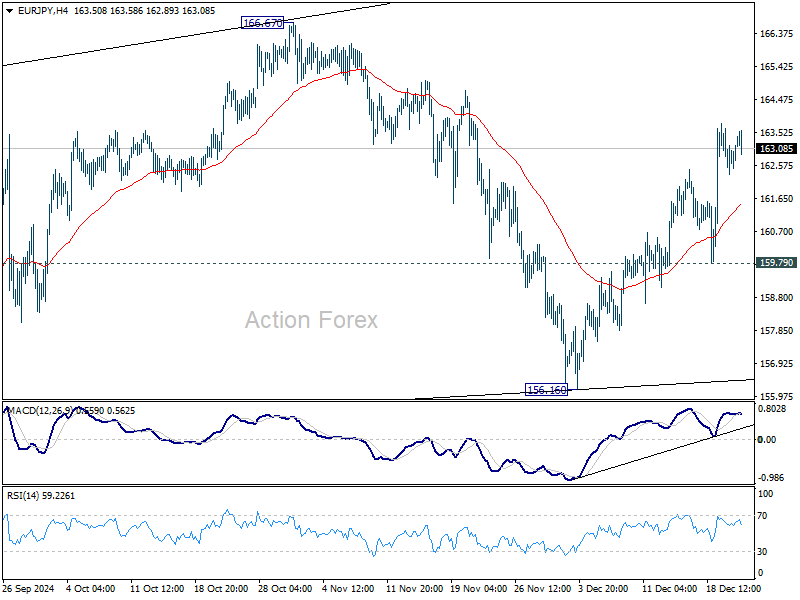
In the bigger picture, price actions from 175.41 are seen as correction to rally from 114.42 (2020 low). The range of consolidation should have been set between 38.2% retracement of 114.42 to 175.41 at 152.11 and 175.41 high. However, decisive break of 152.11 would argue that deeper correction is underway.
EUR/GBP Daily Outlook
Daily Pivots: (S1) 0.8276; (P) 0.8294; (R1) 0.8318; More...
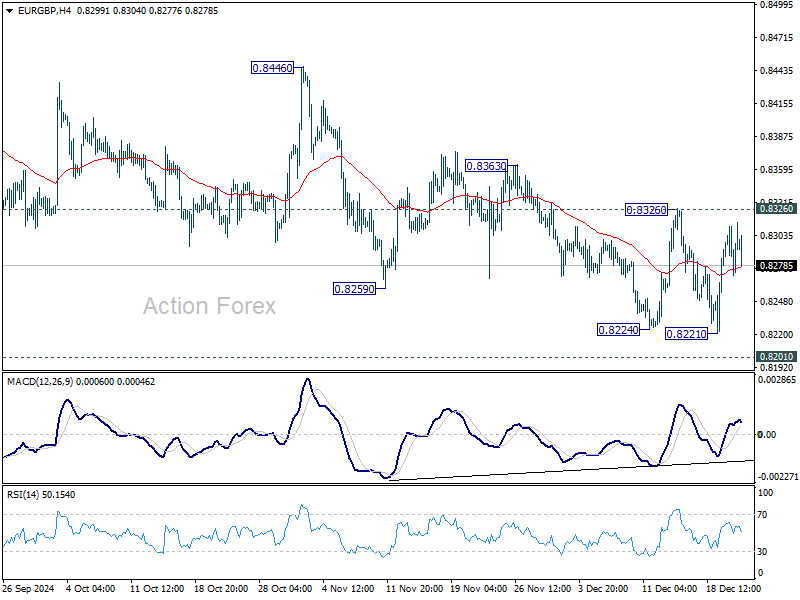
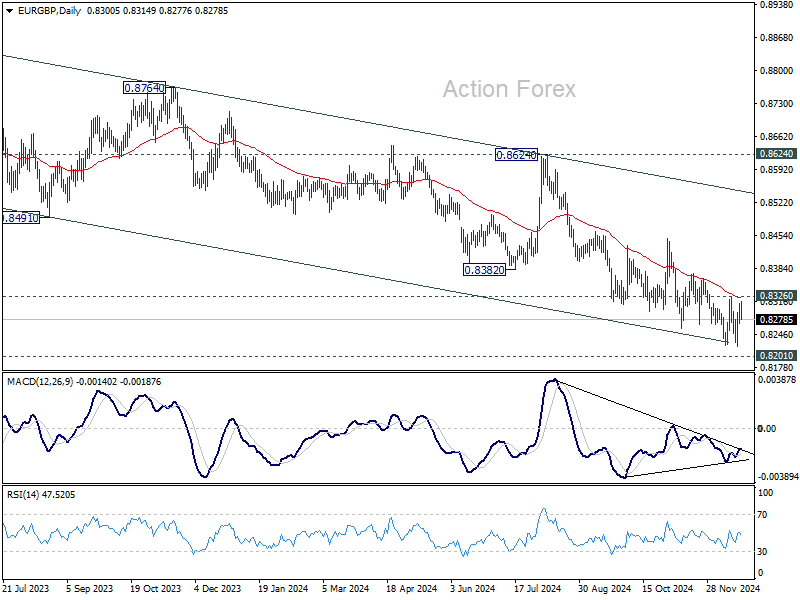
Intraday bias in EUR/GBP stays neutral for the moment and more consolidations would be seen.. On the upside, break of 0.8326 resistance will indicate short term bottoming, at 0.8221, ahead of 0.8201 key support, on bullish convergence condition in 4H MACD. Intraday bias will be turned back to the upside for 0.8446 structural resistance next.
In the bigger picture, focus is now on whether 0.8201 key support (2022 low) is strong enough to complete the whole down trend from 0.9267 (2022 high). In any case, medium term outlook will be neutral at best until decisive break of 0.8624 key resistance. Otherwise, risk will stay on the downside even in case of strong rebound.
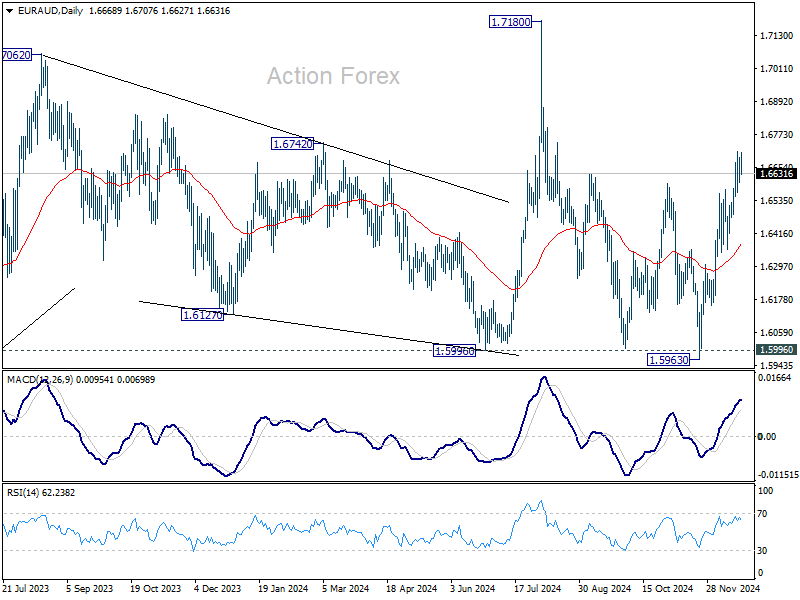
EUR/AUD Daily Outlook
Daily Pivots: (S1) 1.6627; (P) 1.6661; (R1) 1.6717; More...
Intraday bias in EUR/AUD remains neutral as consolidations continue below 1.6712. Deeper retreat could be seen, but downside should be contained by 55 4H EMA (now at 1.6553. On the upside, break of 1.6712 will resume the rally from 1.5693 to retest 1.7180 high next.
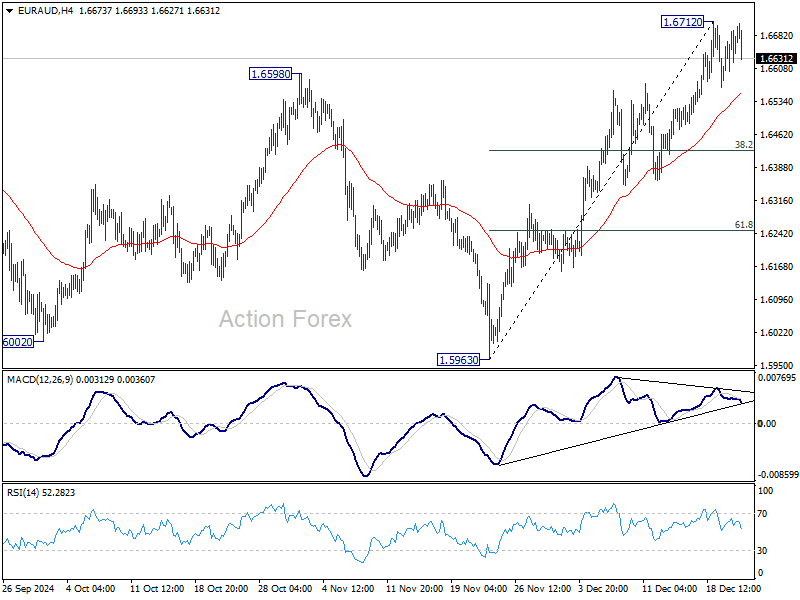
In the bigger picture, EUR/AUD is holding on to 1.5996 key support despite brief breach. Larger up trend from 1.4281 (2022 low) is still in favor to resume through 1.7180 at a later stage. Nevertheless, sustained break of 1.5995 will indicate that such up trend has completed and deeper decline would be seen.
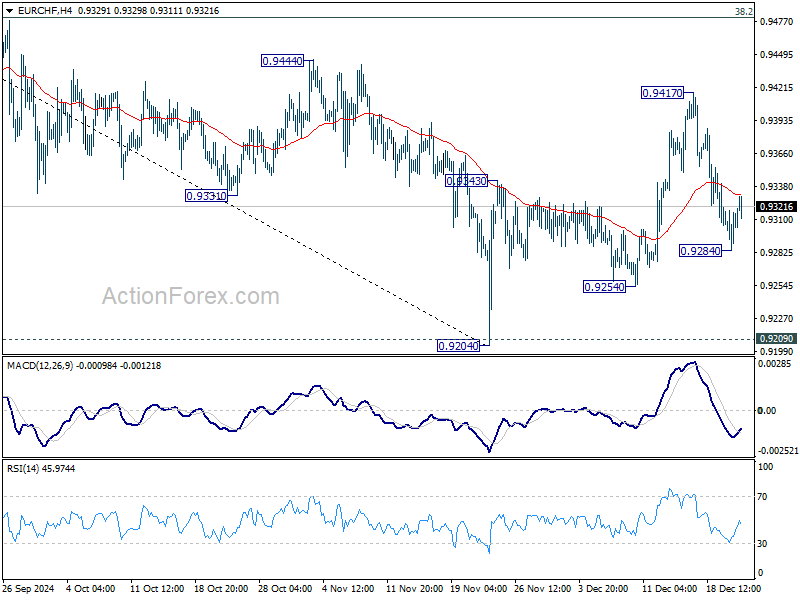
EUR/CHF Daily Outlook
Daily Pivots: (S1) 0.9289; (P) 0.9311; (R1) 0.9336; More....
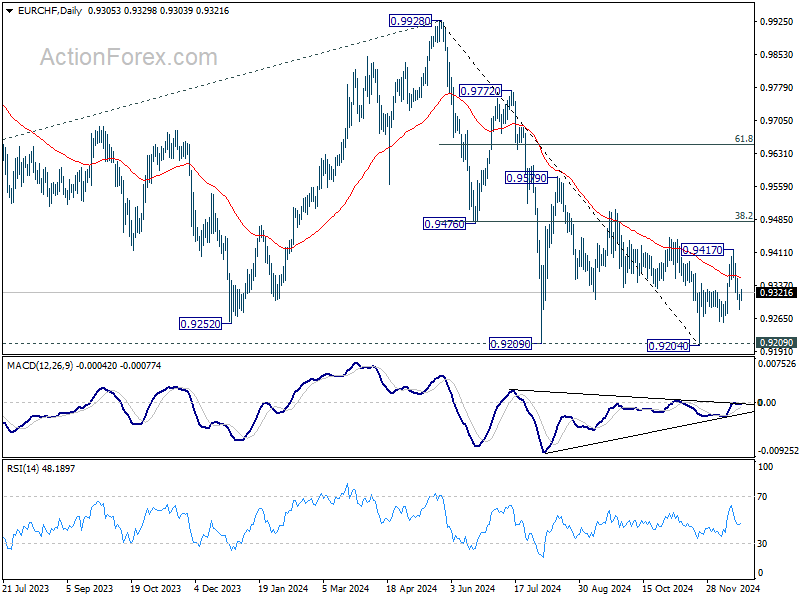
Intraday bias in EUR/CHF is turned neutral first with a temporary low formed at 0.9284. But outlook is unchanged that corrective rebound from 0.9204 should have completed with three waves up to 0.9417 already. Another fall is in favor and below 0.9284 will target 0.9254 support first. Break there will bring retest of 0.9204 low.
In the bigger picture, a medium term bottom is probably in place at 0.9204. More consolidations would be seen above there with risk of stronger rebound to 38.2% retracement of 0.9928 to 0.9204 at 0.9481. But outlook will remain bearish as long as 0.9481 holds and another fall through 0.9204 to resume larger down trend is in favor.
Let’s Focus on the Good for a Few More Days
Last week was chaotic. The Federal Reserve’s (Fed) hawkish 25bp cut, the hint from the dot plot that there would be only two rate cuts next year instead of four – because the US economy is too strong to continue the cuts as previously predicted - and the US debt limit shenanigans even before Trump took office gave a negative jolt to the US stock markets. But happily, things got better from Friday on as a set of US PCE data came in softer than expected, and got some investors hoping that maybe – but just maybe – the Fed’s got too hawkish on inflation. Second, the US averted a government shutdown and politicians disregarded Trump / Musk’s demand for suspending the debt limit. The US government will continue to run until mid March, then we will see what happens to that debt limit under the Trump administration. My best guess is that the US will regularly continue to push the debt limit higher – or Trump will scrap something that didn’t make sense anyway. In practice, nothing will change. The US debt will continue to grow, and as per inflation, I think that those who got their hopes up with one set of inflation data will be disappointed.
As a result, the US yields should continue to push higher regardless of how dovish the Fed tries to be. Note that the US 10-year yield advanced up to 100bp since the Fed started cutting the interest rates – and cut 100bp in three meetings. At least half of the cuts were unnecessary, and that’s why, not only did yields continue climbing as the Fed cut rates, but the possibility of a further rise in the 10-year yield toward 5% remains on the table—and that’s not necessarily good news for risk assets.
But anyway, Friday’s session saw a certain relief – at least in the US – because the mood in Europe was not great at all after Novo Nordisk slumped more than 20% at the open as their latest weight loss drug made patients lose less weight than the company had predicted. But across the Atlantic, the S&P500 rebounded more than 1% on Friday, while Nasdaq added 0.85%. The US yields were little changed but the US dollar retreated from more than 2-year highs.
In the absence of major economic data, this Xmas-shortened week could see a further rebound in the US equities – no one wants to miss the Santa rally – and a further retreat in the US dollar in favour of its major counterparts. Yet, beyond tactical trades based on last week’s softer-than-expected PCE measures, the story remains unchanged. The core PCE in the US has been moving up since the summer dip and settled at 2.8% for the second consecutive month, and – I can never repeat this enough but – Trump’s pro-growth policies, tariffs, mass deportations hint that the US inflation risks are tilted toward the upside.
As such, the US Dollar pullbacks could be interesting opportunities to buy the dips. The EURUSD could see resistance between 1.05/1.0545 area – a psychological level and the minor 23.6% Fibonacci retracement on September to December rally. Cable should see limited upside potential within 1.27/1.2720 area. The USDJPY’s way is cleared for a further advance to 160, until the yen bears get scared that the Japanese authorities will intervene directly in the FX markets to stop bleeding. The Bank of Japan (BoJ) will unlikely to make any changes to their policy until March, April next year. This is when the policymakers think that they will have a clearer view on the potential and the impact of Trump’s international policies. In Canada, the Loonie takes a breather on the back of a broadly softer US dollar but the political shenanigans keep the risks tilted toward the upside in the USDCAD as calls for Trudeau to step down are mounting. And finally, the AUDUSD forms support near the 62 cents level. The pair is oversold, but buying the Aussie looks similar to try to catch a falling knife since September.
In commodities, US crude is better bid above the 50-DMA – few cents below the $70pb level – but without a strong conviction to extend this rebound, the price rallies will likely see resistance into the 100-DMA – near $71.40pb and declining – and into $72.85pb, the major 38.2% Fibonacci retracement on late summer slump that should distinguish between the negative trend since then, and a medium term bullish reversal. The ongoing narrative of weak – and weakening - global demand and ample global supply should maintain oil prices in the bearish consolidation zone for now, with however a limited downside potential near the $67pb level.
In precious metals, gold is better bid this morning. Lately, the yellow metal has been pressured by the rising US yields that increase the opportunity cost of holding the non-interest-bearing gold - but an accelerated selloff in global equities could drive capital into the safe-haven metal regardless of the upswing in yields.