Sample Category Title
ECB’s Lagarde: Inflation target within reach, services inflation still stubborn
In an interview with the Financial Times, ECB President Christine Lagarde expressed optimism about nearing the inflation target.
She remarked that ECB is "very close" to declaring that inflation has been "sustainably" brought back to its 2% medium-term target.
The latest inflation reading of 2.2% reflects the success of ECB’s restrictive monetary policy. However, she highlighted persistent concerns in the services sector, where inflation remains high at 3.9%, describing it as "not budging much" despite showing slight signs of decline.
On the topic of US tariff threats, Lagarde emphasized the economic risks of retaliatory trade measures, stating, "Retaliation was a bad approach." She warned that tit-for-tat trade conflicts could harm the global economy.
EUR/USD Battles Headwinds: Bulls Face Tough Terrain
Key Highlights
- EUR/USD started a recovery wave from the 1.0350 zone.
- A key bearish trend line is forming with resistance near 1.0450 on the 4-hour chart.
- GBP/USD is facing hurdles near the 1.2650 and 1.2720 levels.
- Bitcoin and Ethereum gained bearish pace and declined below key support levels.
EUR/USD Technical Analysis
The Euro traded as low as 1.0343 before it started a recovery wave against the US Dollar. EUR/USD climbed above the 1.0380 and 1.0400 resistance levels.
Looking at the 4-hour chart, the pair even cleared the 23.6% Fib retracement level of the downward move from the 1.0629 swing high to the 1.0343 low. However, the pair is still below the 100 simple moving average (red, 4-hour) and the 200 simple moving average (green, 4-hour).
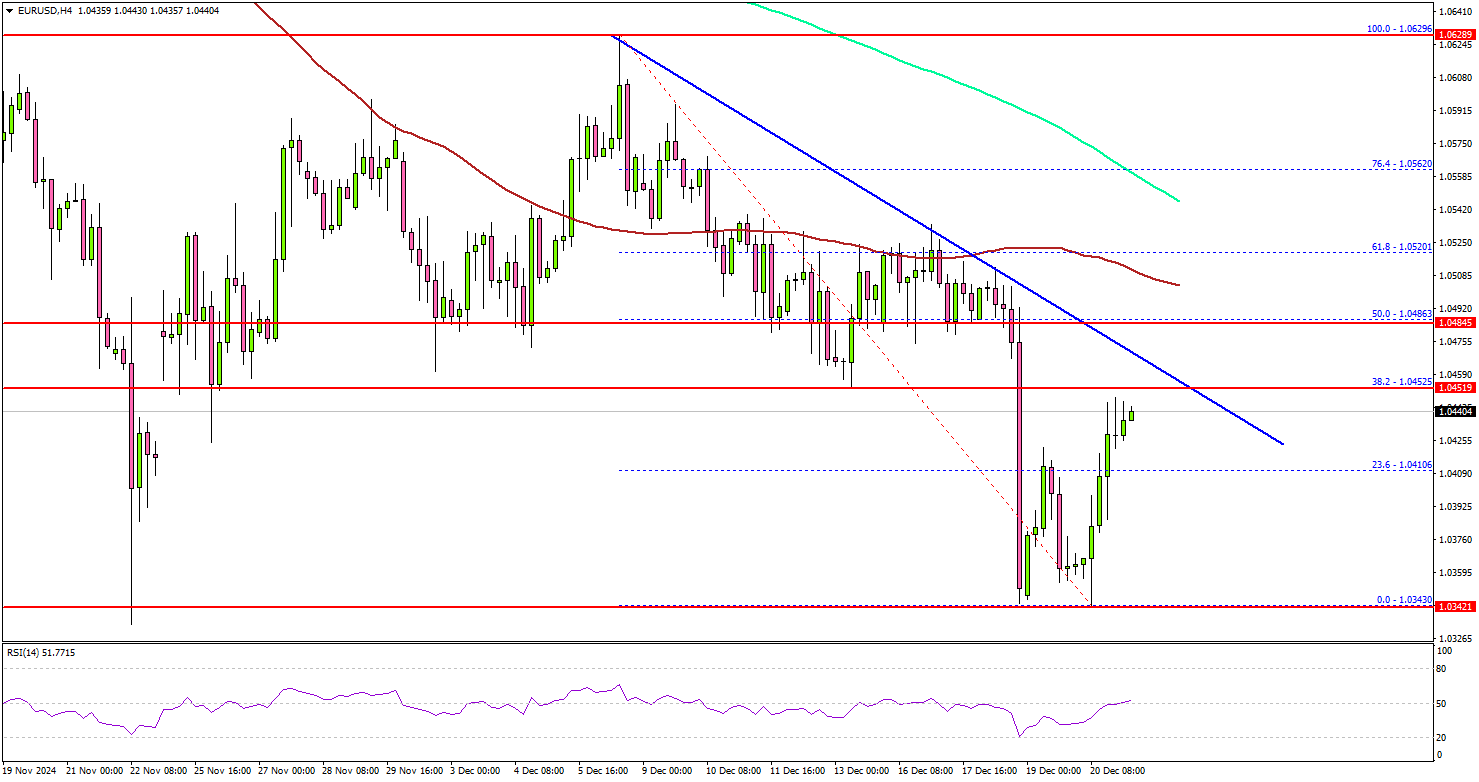
There is also a key bearish trend line forming with resistance near 1.0450 on the same chart. The trend line is close to the 38.2% Fib retracement level of the downward move from the 1.0629 swing high to the 1.0343 low.
On the upside, the pair could face resistance near the 1.0450 level. The next major resistance is near the 1.0475 level. A close above the 1.0475 level could set the tone for another increase.
The next major resistance could be the 1.0520 level, above which the price could climb higher toward the 1.0580 resistance. On the downside, immediate support sits near the 1.0400 level.
The next key support sits near the 1.0380 level. Any more losses could send the pair toward the 1.0350 level. Any more losses might send the pair toward the 1.0300 level.
Looking at Bitcoin, the bears took control, and they succeeded in closing the price below the key support at $100,000.
Upcoming Economic Events:
- UK GDP for Q3 2016 (Preliminary) (QoQ) - Forecast +0.1%, versus +0.1% previous.
- UK GDP for Q3 2016 (Preliminary) (YoY) - Forecast +1%, versus +1% previous.
EURCHF Wave Analysis
- EURCHF falling inside minor impulse wave 5
- Likely to fall to support level 0.9250
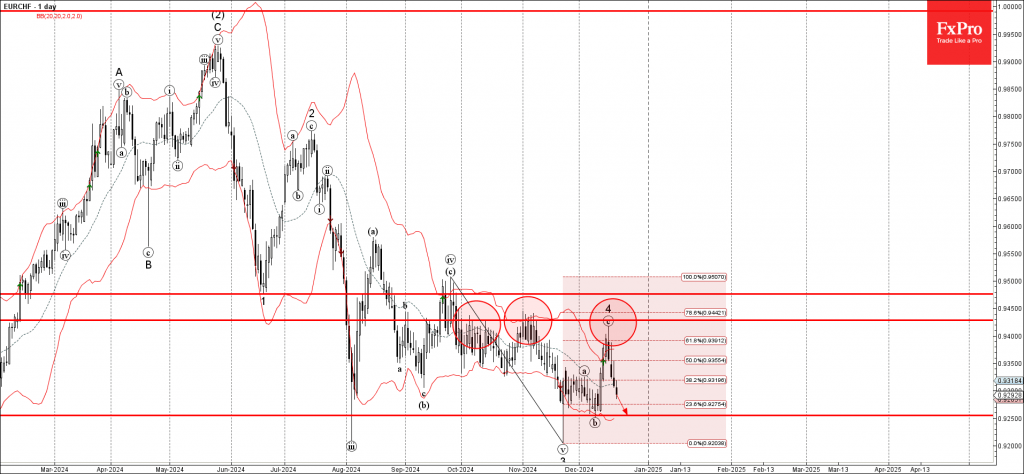
EURCHF currency pair continues to fall inside the minor impulse wave 5, which started earlier from the pivotal resistance level 0.9430 (standing well above the upper daily Bollinger Band), which has been reversing the price from the start of October.
The downward reversal from the resistance level 0.9430 created the daily Japanese candlesticks reversal pattern Bearish Engulfing.
Given the overriding daily downtrend and the strongly bullish Swiss franc sentiment seen today, EURCHF currency pair can be expected to fall to the next support level 0.9250, low of the earlier minor correction b.
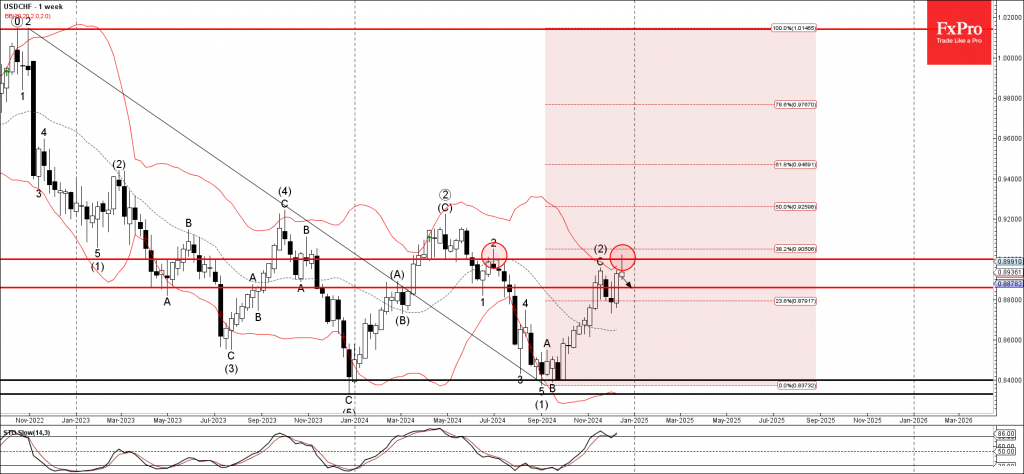
USDCHF Wave Analysis
- USDCHF reversed from resistance zone
- Likely to fall to support level 0.8860
USDCHF currency pair recently reversed down from the strong resistance zone located between the round resistance level 0.90000 (which has been reversing the pair from the idle of last year) and the upper weekly Bollinger Band.
The resistance level 0.90000 was further strengthened by the 38.2% Fibonacci correction of the weekly downtrend from the end of 2022.
Given the strong multiyear downtrend and the overbought weekly Stochastic, USDCHF currency pair can be expected to fall to the next support level 0.8860.
Dollar to Pause for Consolidation After Failing to Break Euro Resistance Post-Fed
The financial markets were jolted by Fed’s hawkish rate cut last week, sending ripples across stocks, bonds, currencies, precious metals, and even cryptocurrencies. Fed’s indication of prolonged restrictive monetary policy fueled risk aversion, pushing Dollar to end the week as the strongest performer in the currency markets, supported by surging yields and elevated Fed expectations.
Despite its dominance, the greenback's gains were capped by its inability to break through key near-term resistance against Euro, suggesting that further consolidation may be in store as the markets enter year-end holiday period. Dollar could take a breather before attempting another rally in the new year.
While European majors posted losses against Dollar, they demonstrated relative resilience against commodity currencies and Yen. British Pound initially showed relative strength against Euro and Swiss Franc but fell sharply after BoE’s dovish MPC vote. The 6-3 decision to hold rates unchanged included Alan Taylor joining known doves Swati Dhingra and Dave Ramsden in advocating for a cut, dragging Sterling lower.
Swiss Franc delivered a surprising recovery, ending the week as the second-best performer, reversing losses incurred after SNB’s 50bps rate cut earlier in the month. Euro, meanwhile, underperformed both the Franc and the Pound.
In the commodity currency bloc, New Zealand Dollar was the weakest, hammered by surprisingly dep Q3 GDP contraction that sparked expectations of a deeper RBNZ easing cycle, potentially lowering rates to 3.25%, well below the estimated neutral rate of 3.75%. Australian Dollar and Canadian Dollar also ended the week among the worst performers.
Japanese Yen fared slightly better than Kiwi but still ended as the second-weakest currency. The BoJ’s decision to hold rates steady without hinting at an imminent hike in January added to the selloff. Governor Kazuo Ueda cited concerns about domestic wage growth and the impact of US trade and fiscal policies. As usual, Yen was also pressured by surging US and European yields, amplifying its weakness.
Markets Reel as Fed Signals Prolonged Restrictive Policy
The US markets were rattled last week after Fed delivered a hawkish rate cut. The hawkish outlook has set a high bar for rate cuts in 2025, leaving markets in a precarious position as they digest the implications of prolonged restrictive policy. The impact reverberated through markets, sparking sharp movements across asset classes
All three major stock indexes ended the week significantly lower despite a modest recovery on Friday. DOW experienced its longest losing streak since the 1970s, including a single-day drop of over -1100 points midweek. Nevertheless, the medium-term uptrend remains intact for now, as the pullback has not yet signal a bearish trend reversal.
In the bond market, 10-year Treasury yield surged past the 4.5% level, resuming its rally from September’s low. With momentum firmly intact, yields appear poised to reach the next target of 4.73% resistance. The rise in yields, combined with risk aversion, fueled Dollar Index's rally through 108 resistance. However, Dollar gains were capped by the resilience of EUR/USD, leaving the greenback’s underlying momentum somewhat uneven.
Fed’s 25bps rate cut to 4.25–4.50%, though anticipated, was accompanied by updated projections that signaled a slower pace of easing in 2025. The median rate projection now stands at 3.9% by the end of 2025, implying just two additional rate cuts next year, sharply higher than September’s forecast of 3.4%.
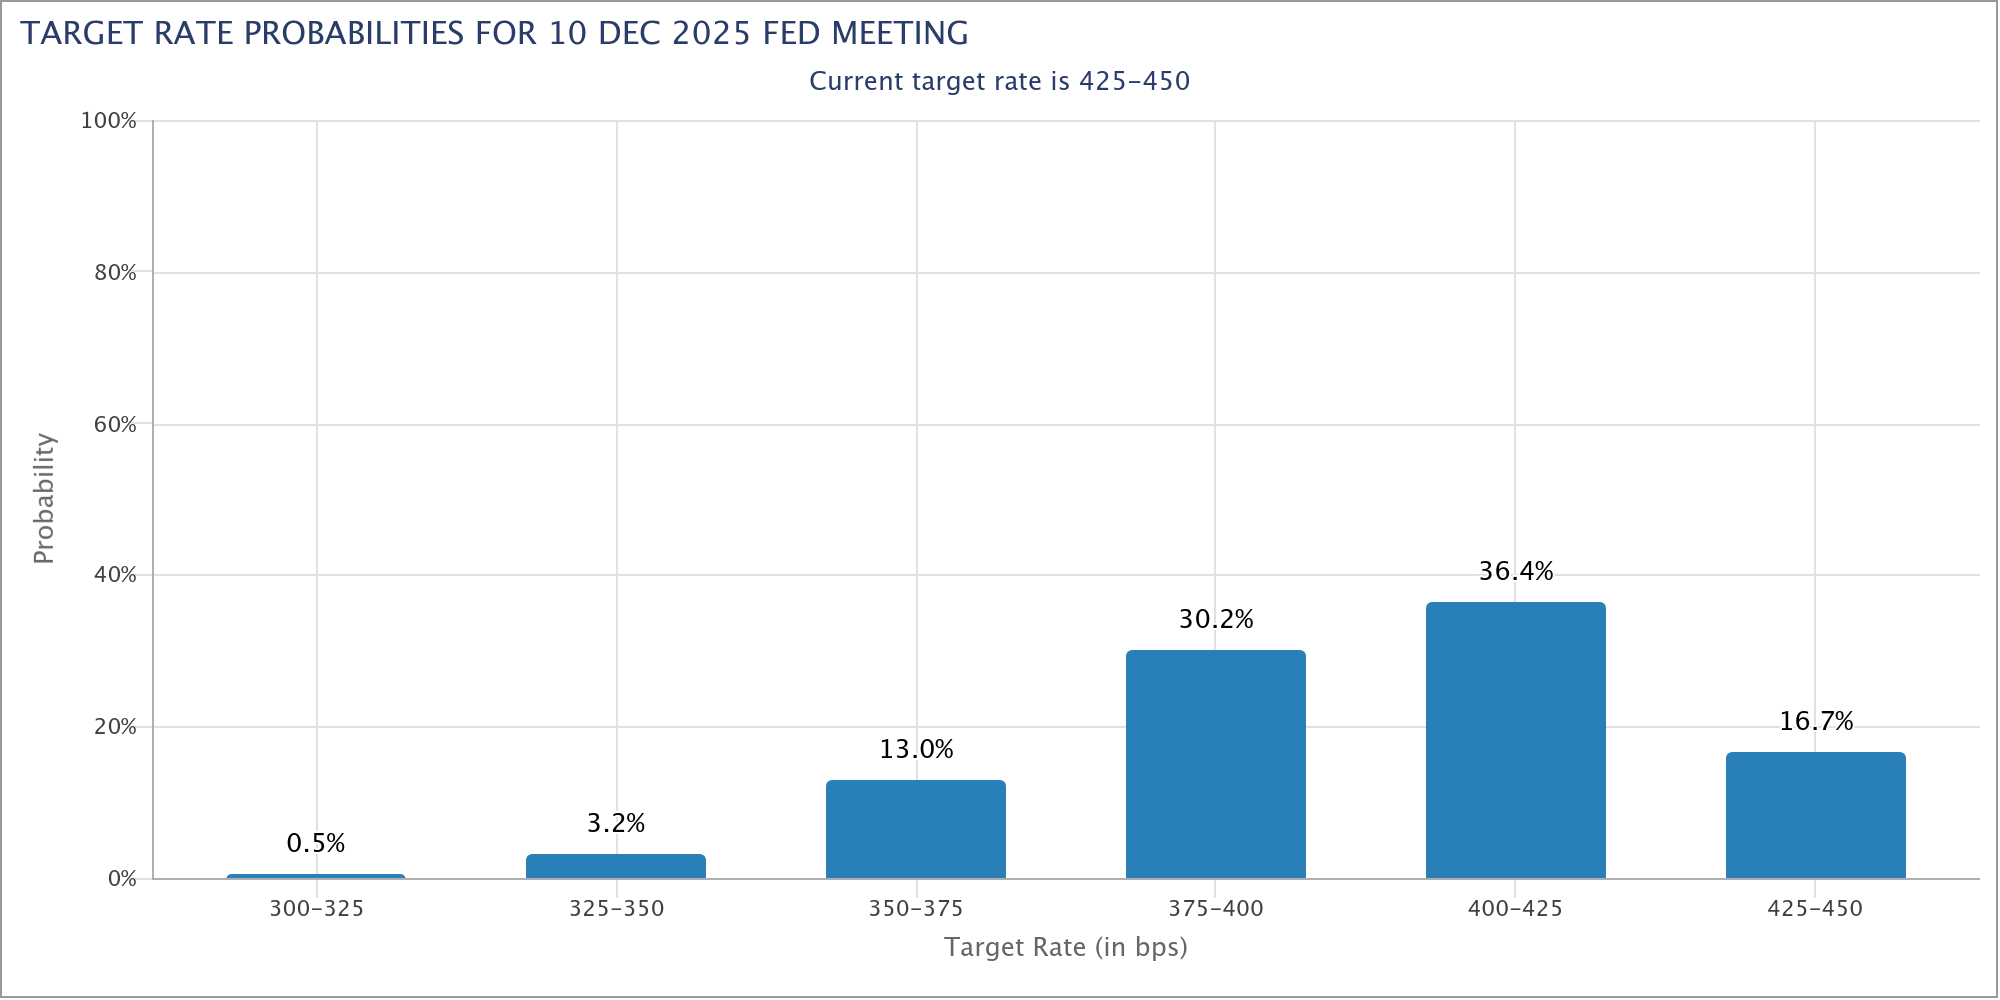
Markets, however, were even more cautious, with Fed fund futures pricing in a 53% chance of only one rate cut in 2025 to 4.00–4.25%. A pause in January is nearly certain, with odds standing at 91.4%.
One of the most significant revelations was the Fed’s upward adjustment to its longer-term rate projections, which represent its estimate of the neutral rate. The median neutral rate edged up from 2.9% to 3.0%. More importantly, the central tendency was revised higher from 2.5-3.5% to a range of 2.8–3.6%.
Projections for end-of-year rates were also raised to 3.4% for 2026 and 3.1% for 2027, both from 2.9%, suggesting that interest rates may only begin entering the neutral zone by late 2026. Notably, the outlook indicates that rates may not turn accommodative throughout the entire projection horizon, indicating Fed’s inclination to keeping monetary policy moderately restrictive for much longer than previously anticipated.
S&P 500 Pauses Below Key Fib Level, Yields and Dollar Signal Further Gains
Technically, S&P 500's steep pull back confirms short term topping at 6099.97 after hitting 61.8% projection of 4103.78 to 5669.67 from 5119.26 at 6086.98. Consolidations should be seen in the near term below 6099.97. However, outlook will stay bullish as long as 5669.67 resistance turned support holds, which is close to medium term channel support. Another rise is expected at a later stage to 100% projection at 6685.15.
However, in the larger picture, there is risk of a deeper and lengthier correction considering that S&P 500 was close to 100% projection of 2191.86 to 4818.62 from 3491.58 at 6118.34. Firm break of 5669.67 will bring deeper fall back to 55 W EMA (now at 5401.91).
10-year yield's break of 4.505 resistance confirms resumption of rise from 3.603. The development further strengthen the case that corrective pattern from 4.997 has completed with three waves down to 3.603. Further rally is expected in the near term as long as 4.361 minor support holds. Next target is 61.8% projection of 3.603 to 4.505 from 4.126 at 4.683.
In the bigger picture, the rise from 3.603 is tentatively seen as resuming whole up trend from 0.398 (2020 low). Break of 4.737 resistance should solidify this medium term bullish case. 10-year yield could then rise through 4.997 (2023 high) to 38.2% projection of 0.398 to 4.997 from 3.603 at 5.359.
Dollar Index breached 108.07 resistance but failed to close above. Nevertheless, rise from 100.15 is tentatively seen as resuming. Further rally is expected as long as 106.69 support holds. Next target is 61.8% projection of 100.15 to 108.07 from 105.42 at 110.31.
In the bigger picture, current development suggests that rebound from 99.57 is the second leg of the sideway pattern from 114.77 (2022 high). Outlook will stay bullish as long as 55 W EMA (now at 104.21) holds. Next target is 161.8% projection of 99.57 to 10734 from 100.15 at 112.72.
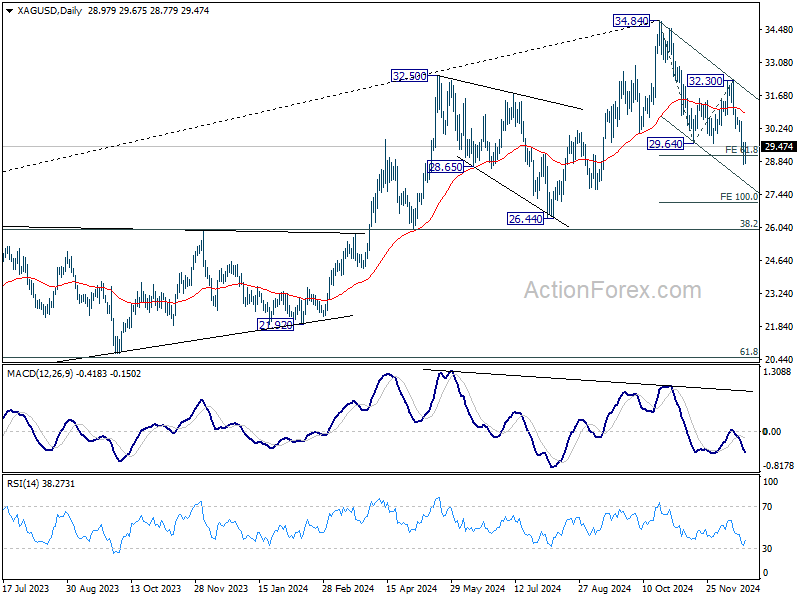
Precious Metals Slide; Silver Faces Critical Support Zone
Precious metals endured a week of heavy losses, driven by Fed’s hawkish rate guidance for 2025. Silver bore the brunt of the selloff, posting its steepest weekly decline in more than five years, while Gold also faced pressure despite a late lift from softer-than-expected US PCE inflation data.
Additionally, Chinese demand provided some support for Gold, with premiums in Shanghai flipping above London for the first time in two months as buyers ramped up purchases ahead of Lunar New Year of Snake. However, this resurgence in demand was insufficient to counteract the broader bearish momentum in the market.
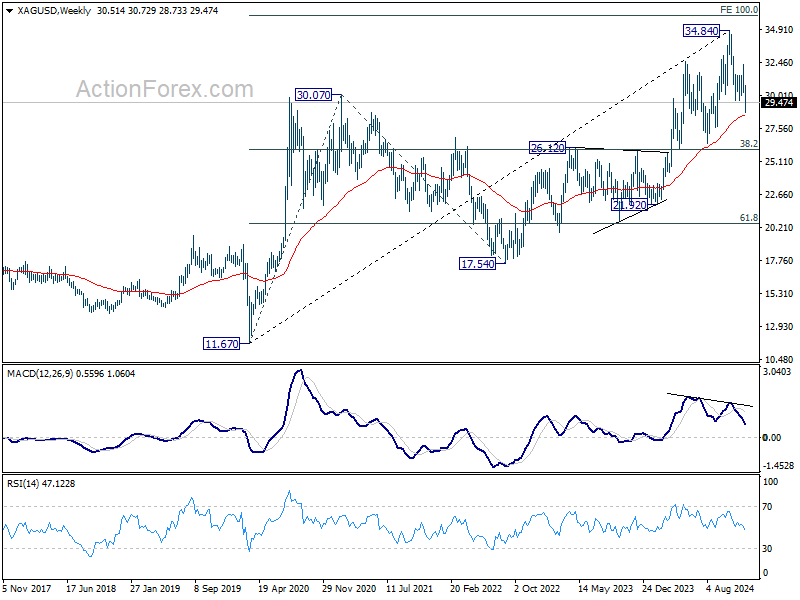
Technically, Silver's fall from 34.84 resumed through 29.64 support last week and it's now at an important support zone, with near term level of 61.8% projection from 34.84 to 29.64 from 32.30 at 29.08, and medium term level of 55 W EMA (now at 28.55) . Strong bounce from the current level, followed by sustained break of 55 D EMA (now at 30.90) will suggest that the correction has completed, and keep the up trend intact.
However considering bearish divergence condition in W MACD, decisive break of 28/29 support zone will raise the chance of medium term bearish reversal. Deeper fall should then be seen back to 26.12 resistance turned support (38.2% retracement of 11.67 to 34.84 at 25.98).
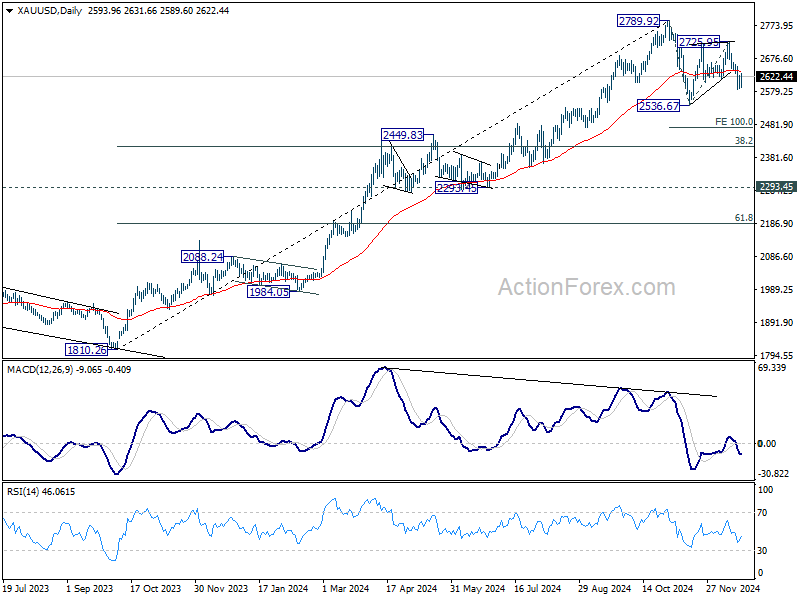
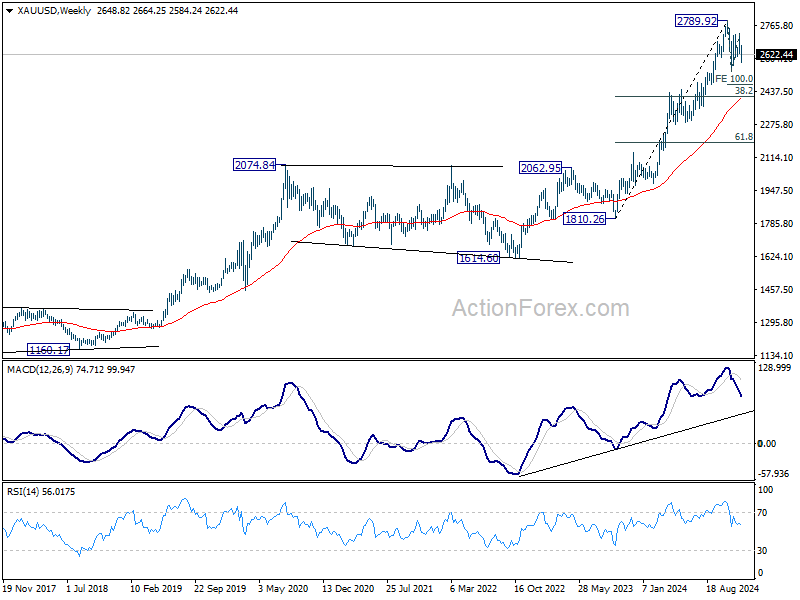
Gold has been relatively resilient after forming a medium term top at 2789.92 with limited pull back so far. Yet outlook is unchanged that it's now in correction to the up trend from 1810.26. Hence risk will stay on the downside for another decline. Break of 2536.67 will target 100% projection of 2789.92 to 2536.67 from 2725.96 at 2472.70 and possibly below.
But still strong support is expected from 38.2% retracement of 1810.26 to 2789.92 at 2415.68, which is to 55 W EMA (now at 2398.44), to contain downside to bring rebound.
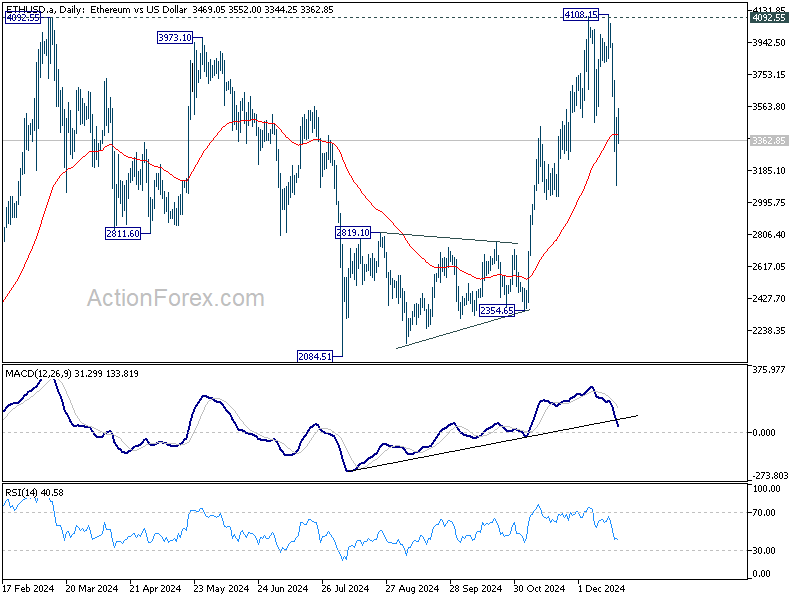
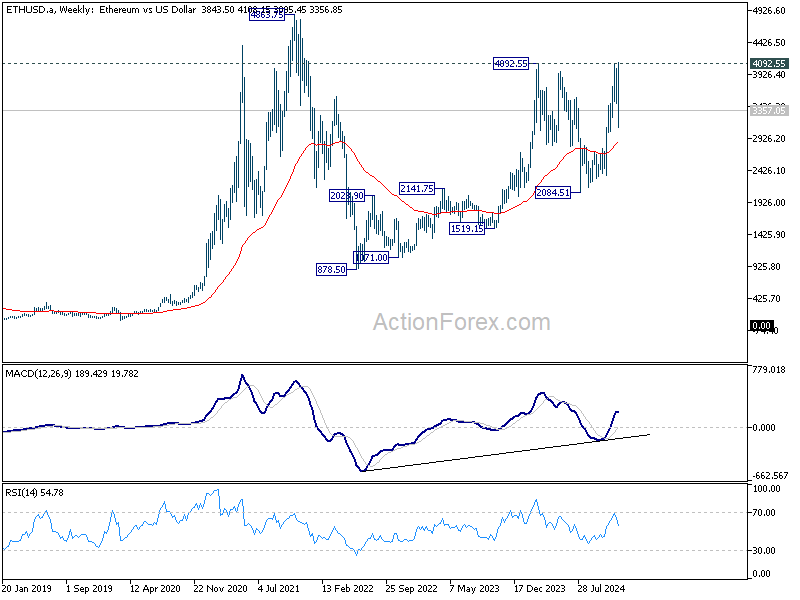
Cryptocurrencies Hit Hard; Bitcoin Holds Key Support, Ethereum Faces Deeper Risks
Fed’s hawkish stance sent shockwaves through cryptocurrency markets, triggering steep declines across Bitcoin, Ethereum, and altcoins. The selloff led to over USD 1.2B in liquidations, marking one of the largest single-day wipeouts in recent months. Despite the turbulence, Bitcoin displayed relative resilience, maintaining much of its post-election gains, while Ethereum faced sharper losses.
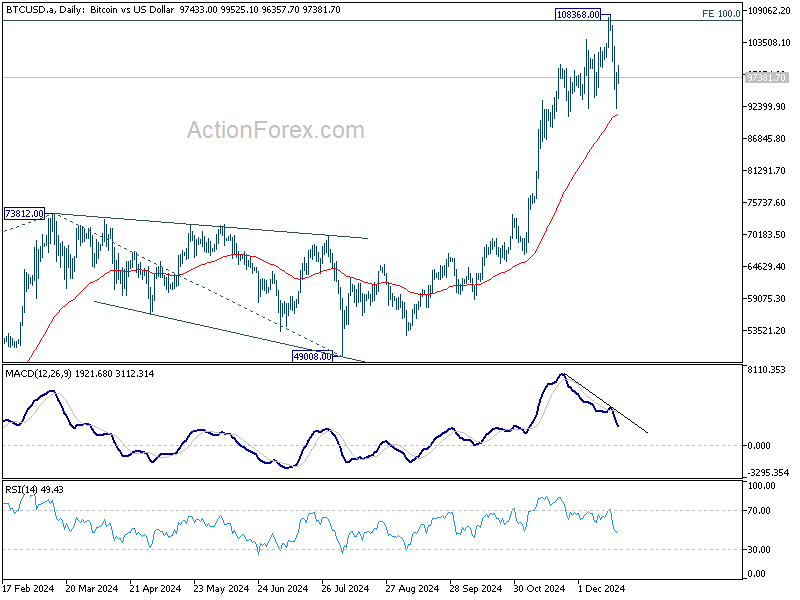
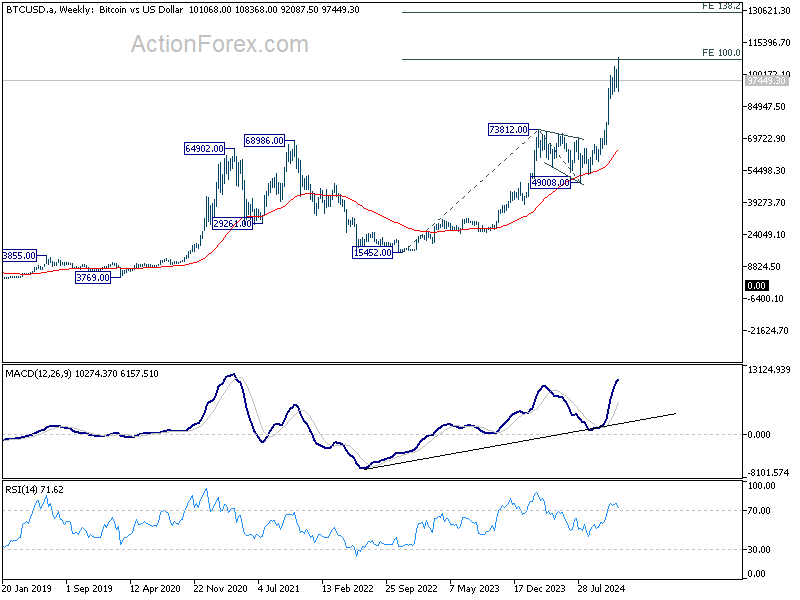
Bitcoin was indeed relatively resilient despite the steep pullback , and still maintained most of the post US election gains. Technically, 108368 is a short term top for sure. But consolidations from there would be relatively brief as long as 55 D EMA (now at 91119) holds. Larger up trend should resume through 109368 sooner rather than later, to 138.2% projection of 15452 to 73812 from 49008 at 129661.
However, firm break of the 55 D EMA will indicate medium term topping, and risk deeper correction back to 73812 resistance turned support.
Ethereum's decline was much steeper, partly because of the strong rejection by 4092.55 key resistance. corrective pattern from could now be extending with fall from 4108.15 as the third leg. Sustained trading below 55 D EMA (now at 3399.07) will pave the way towards 2084.51 support again.
EUR/USD Weekly Outlook
EUR/USD tried to resume the fall from 1.1213 last week but failed to break through 1.0330 support and recovered. Initial bias is turned neutral this week first. While stronger recovery cannot be ruled out, outlook will remain bearish as long as 1.0629 resistance holds. Firm break of 1.0330 will confirm decline resumption and target 61.8% projection of 1.0936 to 10330 from 1.0629 at 1.0254, and then 100% projection at 1.0023.

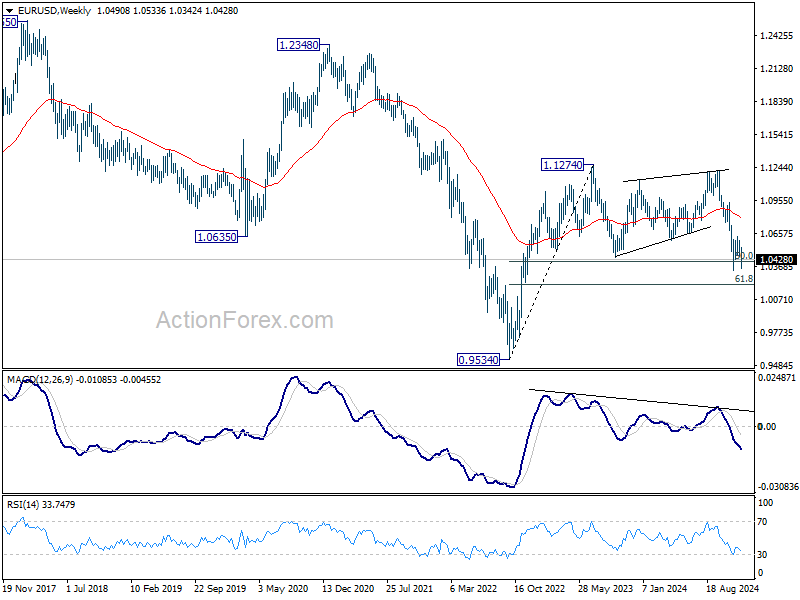
In the bigger picture, focus stays on 50% retracement of 0.9534 (2022 low) to 1.1274 at 1.0404. Strong rebound from this level will keep price actions from 1.1273 (2023 high) as a medium term consolidation pattern only. However, sustained break of 1.0404 will raise the chance that whole up trend from 0.9534 has reversed. That would pave the way to 61.8% retracement at 1.0199 first. Firm break there will target 0.9534 low again.
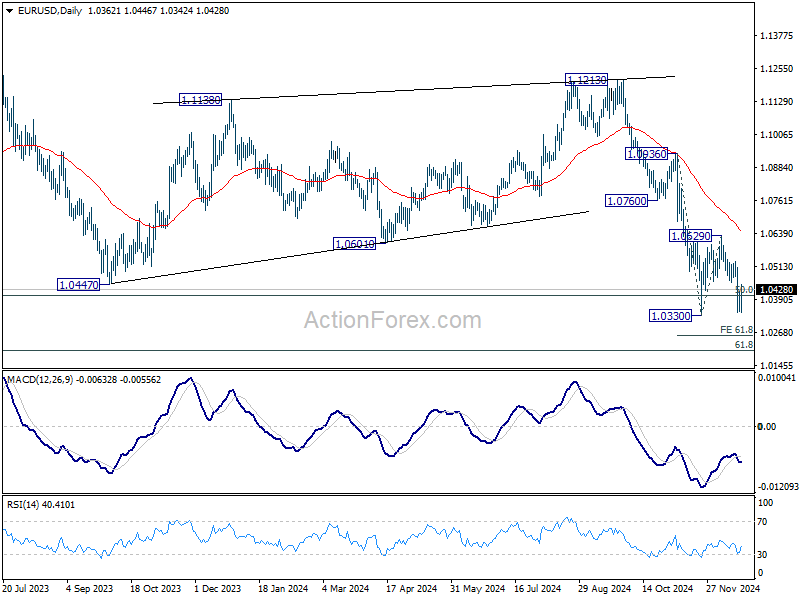
In the long term picture, down trend from 1.6039 remains in force with EUR/USD staying well inside falling channel, and upside of rebound capped by 55 M EMA (now at 1.0979). Consolidation from 0.9534 could extend further and another rising leg might be seem. But as long as 1.1274 resistance holds, downside breakout would be mildly in favor.

EUR/USD Weekly Outlook
EUR/USD tried to resume the fall from 1.1213 last week but failed to break through 1.0330 support and recovered. Initial bias is turned neutral this week first. While stronger recovery cannot be ruled out, outlook will remain bearish as long as 1.0629 resistance holds. Firm break of 1.0330 will confirm decline resumption and target 61.8% projection of 1.0936 to 10330 from 1.0629 at 1.0254, and then 100% projection at 1.0023.
In the bigger picture, focus stays on 50% retracement of 0.9534 (2022 low) to 1.1274 at 1.0404. Strong rebound from this level will keep price actions from 1.1273 (2023 high) as a medium term consolidation pattern only. However, sustained break of 1.0404 will raise the chance that whole up trend from 0.9534 has reversed. That would pave the way to 61.8% retracement at 1.0199 first. Firm break there will target 0.9534 low again.
In the long term picture, down trend from 1.6039 remains in force with EUR/USD staying well inside falling channel, and upside of rebound capped by 55 M EMA (now at 1.0979). Consolidation from 0.9534 could extend further and another rising leg might be seem. But as long as 1.1274 resistance holds, downside breakout would be mildly in favor.
USD/JPY Weekly Outlook
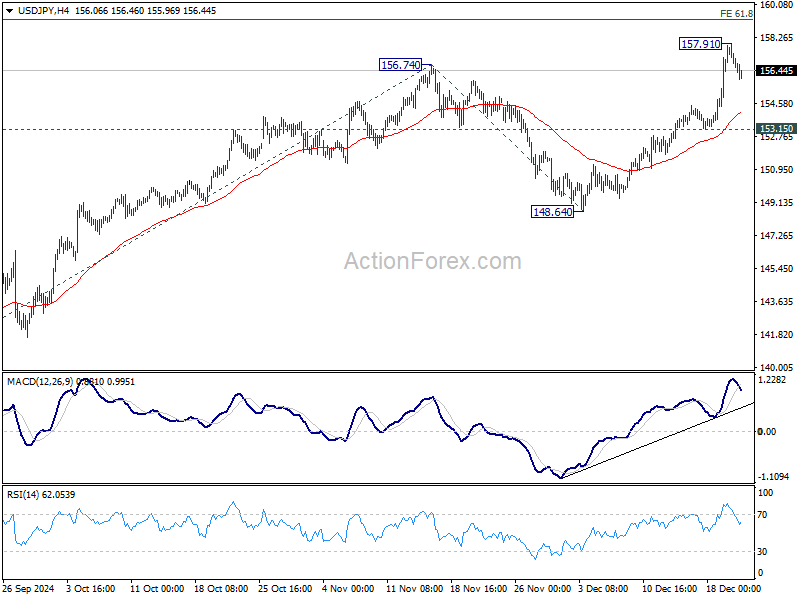
USD/JPY's rally from 139.57 resumed last week but retreated quickly after hitting 157.91. Initial bias stays neutral this week for consolidations. But outlook will remain bullish as long as 153.15 support holds. Break of 157.91 will target 61.8% projection of 139.57 to 156.74 from 148.64 at 159.25 next.
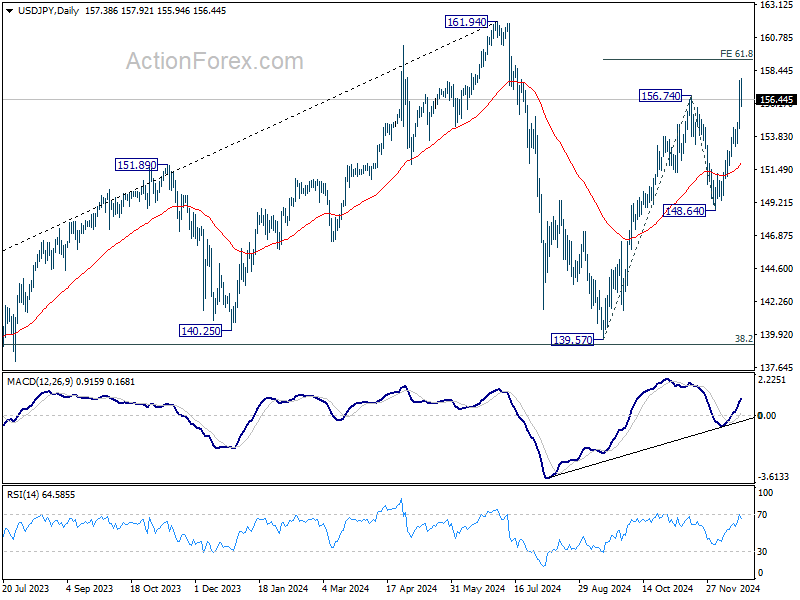
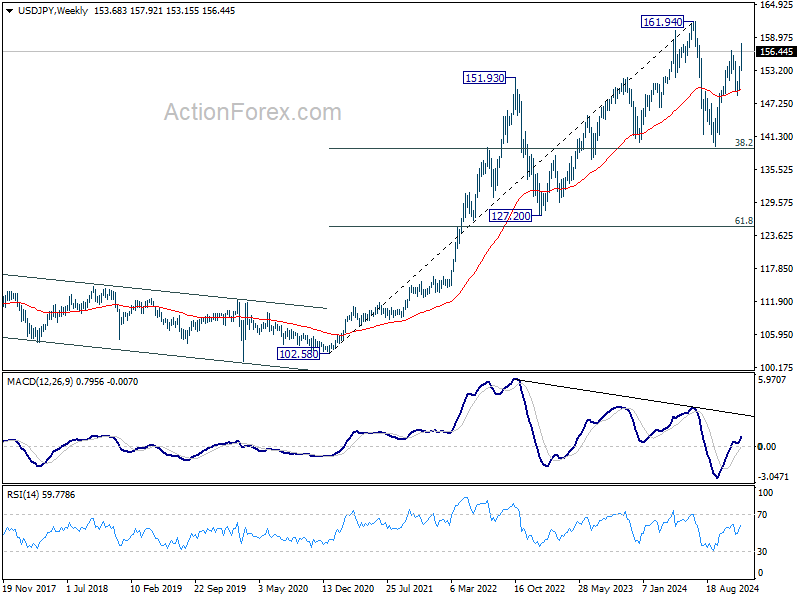
In the bigger picture, price actions from 161.94 are seen as a corrective pattern to rise from 102.58 (2021 low). The range of medium term consolidation should be set between 38.2% retracement of 102.58 to 161.94 at 139.26 and 161.94. Nevertheless, sustained break of 139.26 would open up deeper medium term decline to 61.8% retracement at 125.25.
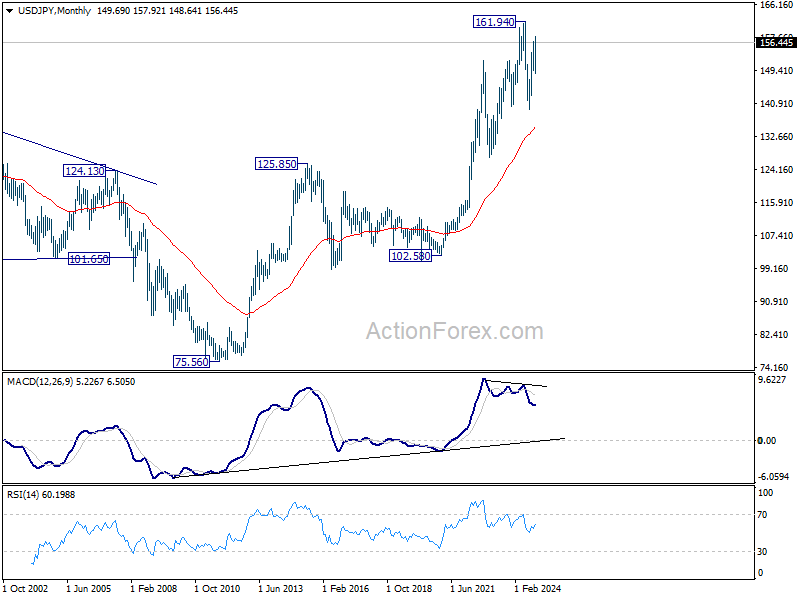
In the long term picture, it's still early to conclude that up trend from 75.56 (2011 low) has completed. However, a medium term corrective phase should have commenced, with risk of deep correction towards 55 M EMA (now at 135.21).
GBP/USD Weekly Outlook
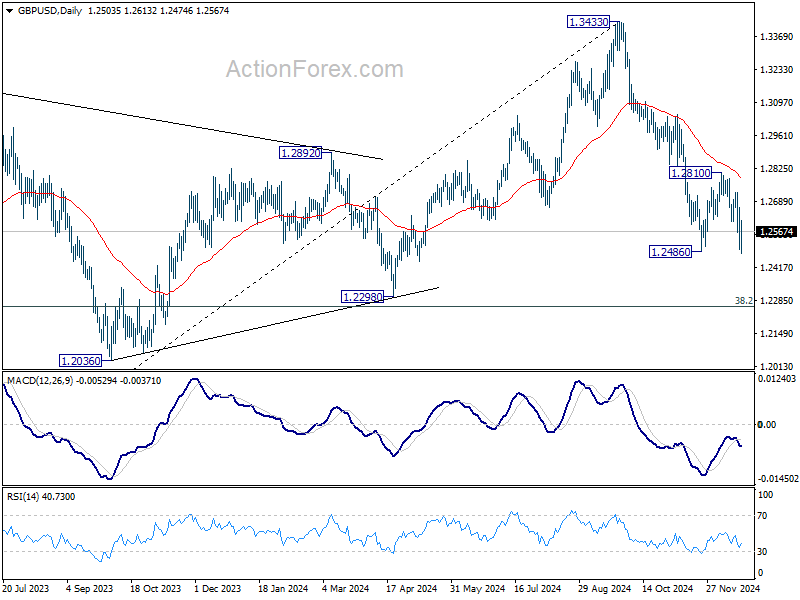
GBP/USD's fall from 1.3433 attempted to resume last week by breaching 1.2486, but quickly recovered after dipping to 1.2474. Initial bias is turned neutral this week for consolidations. Outlook will stay bearish as long as 1.2810 resistance holds. Break of 1.2474 will target 1.2298 cluster support zone.

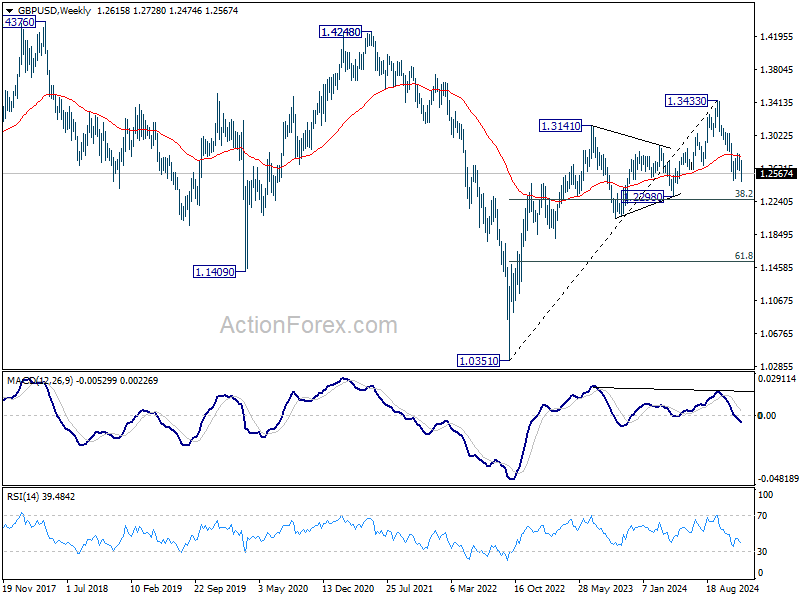
In the bigger picture, price actions from 1.3433 medium term are seen as correcting whole up trend from 1.0351 (2022 low). Deeper decline could be seen to 38.2% retracement of 1.0351 to 1.3433 at 1.2256, which is close to 1.2298 structural support. But strong support is expected there to bring rebound to extend the corrective pattern.
In the long term picture, as long as 1.2298 support holds, rise from 1.0351 long term bottom is expected to continue. But in any case, outlook is neutral at best as long as 1.4248 structural resistance holds.

USD/CHF Weekly Outlook
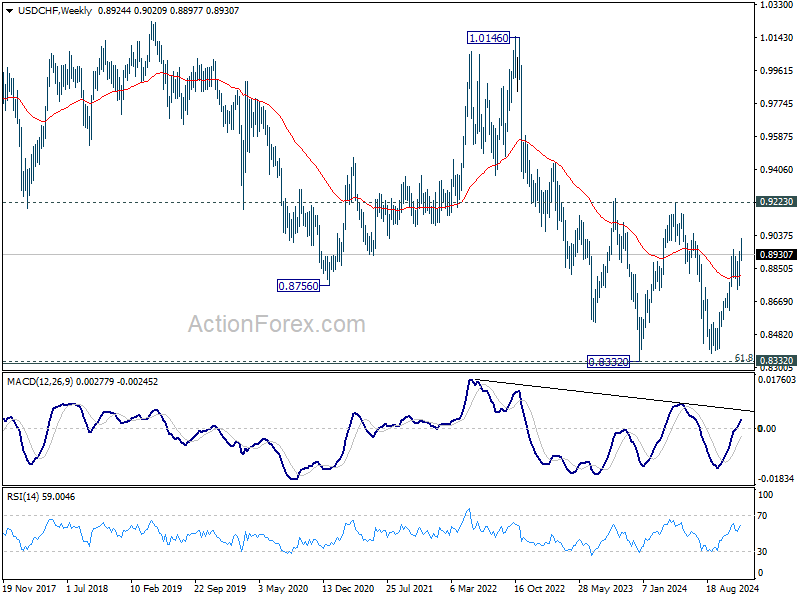
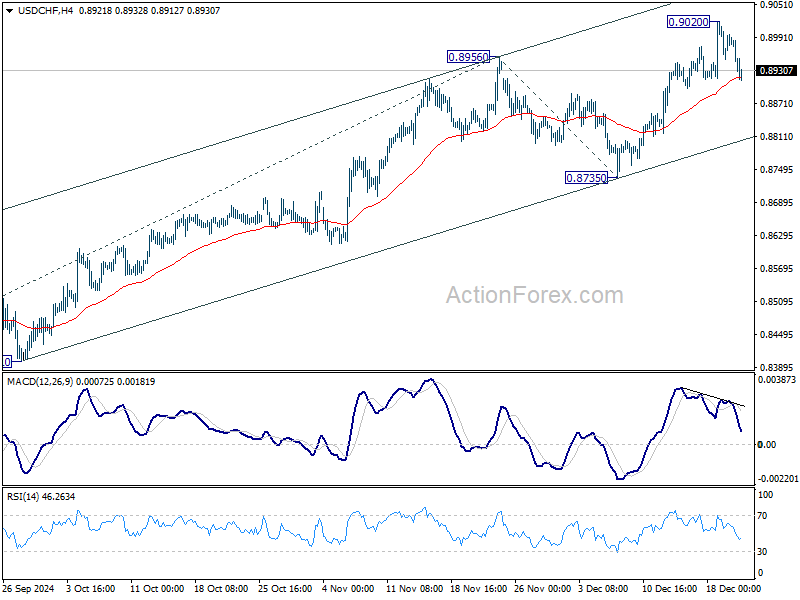
USD/CHF's rally from 0.8374 resumed last week but retreated after hitting 0.9020. Initial bias stays neutral this week for consolidations first. Downside should be contained above 0.8735 support to bring another rally. Above 0.9020 will target 61.8% projection of 0.8374 to 0.8956 from 0.8735 at 0.9095.
In the bigger picture, price actions from 0.8332 (2023 low) are currently seen as a medium term corrective pattern, with rise from 0.8374 as the third leg. Overall outlook will continue to stay bearish as long as 0.9223 resistance holds. Break of 0.8332 low is in favor at a later stage when the consolidation completes.
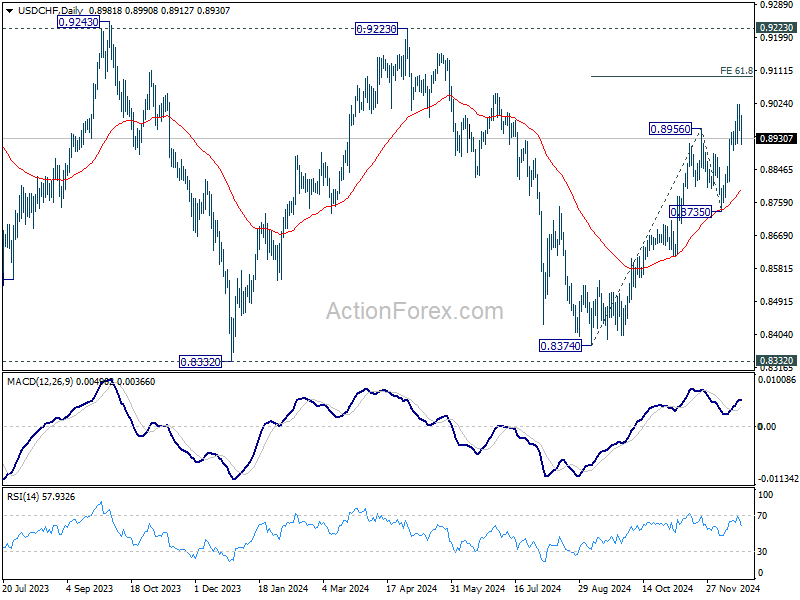
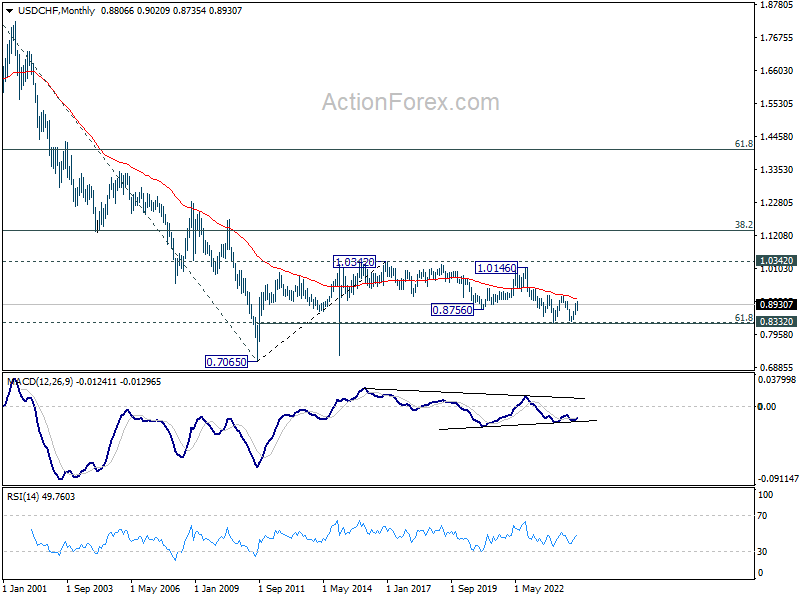
In the long term picture, price action from 0.7065 (2011 low ) are seen as a corrective pattern to the multi-decade down trend from 1.8305 (2000 high). Fall from 1.0342 (2016 high) is seen as the second leg. Rejection by 55 M EMA suggest that this fall is in progress. Break of 61.8% retracement of 0.7065 to 1.0342 at 0.8317 will pave the way back to 0.7065.