Sample Category Title
Dollar Pauses After PCE Miss, Markets Digest Fed Comments
Dollar's strong rally paused in early US trading after PCE inflation data came in below expectations, easing concerns that Fed might maintain higher rates for an extended period. Markets are also digesting remarks from Fed officials following the hawkish rate cut earlier in the week.
Most notably, Cleveland Fed President Beth Hammack, the sole dissenter in the rate cut decision, noted that monetary policy is "not far from a neutral stance." She expressed the preference for holding rates steady until there is clearer evidence that inflation is resuming its downward path toward 2%.
Meanwhile, San Francisco Fed President Mary Daly called the rate cut a "close call" and suggested that the policy recalibration phase is "behind us." She's also "very comfortable" with Fed’s median projections for just two rate cuts next year, with a possibility of even fewer.
New York Fed President John Williams struck a balanced tone, stating that the "baseline trajectory is moving down towards neutral rates," but emphasized the importance of being data-dependent. Williams highlighted that Fed has time to assess incoming data and risks, adding, "I think we're in a great place, well positioned" to meet its objectives.
For the week, Dollar remains the strongest performer by a significant margin, followed by the Swiss Franc and British Pound. On the weaker side, New Zealand Dollar is the worst performer, followed by Australian Dollar, while Yen has climbed slightly, now the third weakest. Euro and Canadian Dollar are mixed in the middle.
In Europe, at the time of writing, FTSE is down -0.81%. DAX is down -0.98%. CAC is down -0.94%. UK 10-year yield is down -0.038 at 4.545. Germany 10-year yield is down -0.017 at 2.289. Earlier in Asia, Nikkei fell -0.29%. Hong Kong HSI fell -0.16%. China Shanghai SSE fell -006%. Singapore Strait Times fell -1.14%. Japan 10-year JGB yield fell -0.0311 to 1.055.
US PCE inflation ticks up to 2.4% yoy, core unchanged at 2.8% yoy
US headline PCE price index rose 0.1% mom in November, below expectation of 0.2% mom. Core PCE price index (excluding food and energy) also rose 0.1% mom, below expectation of 0.2% mom. Prices for goods increased less than 0.1% mom and prices for services increased 0.2% mom. Food prices increased 0.2% mom and energy prices also increased 0.2% mom.
From the same month one year ago, headline PCE index ticked up from 2.3% yoy to 2.4% yoy, below expectation of 2.5% yoy. Core PCE was unchanged at 2.8% yoy, below expectation of 2.9% yoy. Prices for goods decreased -0.4% yoy and prices for services increased 3.8% yoy. Food prices increased 1.4% yoy and energy prices decreased -4.0% yoy.
Personal income rose 0.3% mom or USD 71.1B, below expectation of 0.4% mom. Personal spending rose 0.4% mom or USD 81.3B. below expectation of 0.5% mom.
Canada's retail sales rises 0.6% mom in Oct, unchanged in Nov
Canada's retail sales rose 0.6% mom to CAD 67.6B in October, above expectation of 0.4% mom. Sales were up in five of nine subsectors and were led by increases at motor vehicle and parts dealers.
Core retail sales—which exclude gasoline stations and fuel vendors and motor vehicle and parts dealers—were up 0.2% mom.
In volume terms, retail sales were unchanged.
Advance information suggests that sales were relatively unchanged in November.
UK retail sales edge up 0.2% mom, below 0.4% mom expectations
UK retail sales volumes rose by 0.2% mom in November, falling short of expectations for a 0.4% increase. This modest gain partly recovered the -0.7% mom decline recorded in October. Growth in supermarkets and non-food stores provided support, but this was partially offset by weaker performance from clothing retailers.
On an annual basis, sales volumes increased by 0.5% over the year to November. However, volumes remain -1.6% below their pre-pandemic levels from February 2020.
Looking at the broader trend, retail sales volumes rose by 0.3% in the three months to November compared with the prior three-month period. Compared to the same period last year, volumes were up by 1.9%, suggesting some resilience despite ongoing economic uncertainties.
Japan’s core CPI reaccelerates to 2.7%, driven by energy and rice
Japan’s core CPI (excluding food) rose to 2.7% yoy in November, marking the first reacceleration in three months and exceeding market expectations of 2.6% yoy. Core inflation has remained above the BoJ’s 2% target since April 2022, highlighting persistent price pressures. This increase was attributed to reduced government subsidies for utility bills and a sharp rise in rice prices.
Energy prices surged 6.0% yoy, up from October’s 2.3% yoy gain. Within this category, electricity prices jumped 9.9% yoy, and city gas costs climbed 6.4% yoy. Meanwhile, rice prices soared by a staggering 63.6% yoy, the steepest increase since 1971, driven by last year’s unusually hot summer that disrupted production.
Core-core CPI (excluding food and energy) ticked up from 2.3% yoy to 2.4% yoy, while headline CPI rose to 2.9% from October’s 2.3%. Service prices, a key indicator for BOJ as they often reflect wage dynamics, increased 1.5% yoy, unchanged from the prior month.
NZ's exports rises 9.1% yoy in Nov, imports up 3.9% yoy
New Zealand’s trade data for November showed a significant improvement, with goods exports rising 9.1% yoy to NZD 6.5B, while goods imports increased by a more modest 3.9% yoy to NZD 6.9B. The resulting trade deficit of NZD -437m was much smaller than the expected NZD -1951m.
Exports saw notable gains across key markets. Shipments to China increased 6.3% yoy, adding NZD 106m, while exports to Australia climbed 8.4% yoy (NZD 62m) and to the US by 12% yoy (NZD 85m). Exports to the EU surged the most, rising 27% yoy (NZD 74m), with shipments to Japan also showing strength at 7.2% yoy (NZD 19m).
On the import side, data was more mixed. Imports from China edged down -1.7% yoy (NZD -29m) and from the EU fell sharply by -16% yoy (NZD -163m). Similarly, imports from South Korea dropped -12% yoy (NZD -61m ). However, imports from Australia rose 14% yoy (NZD 101m) and from the US increased 7.2% yoy (NZD 41 m).
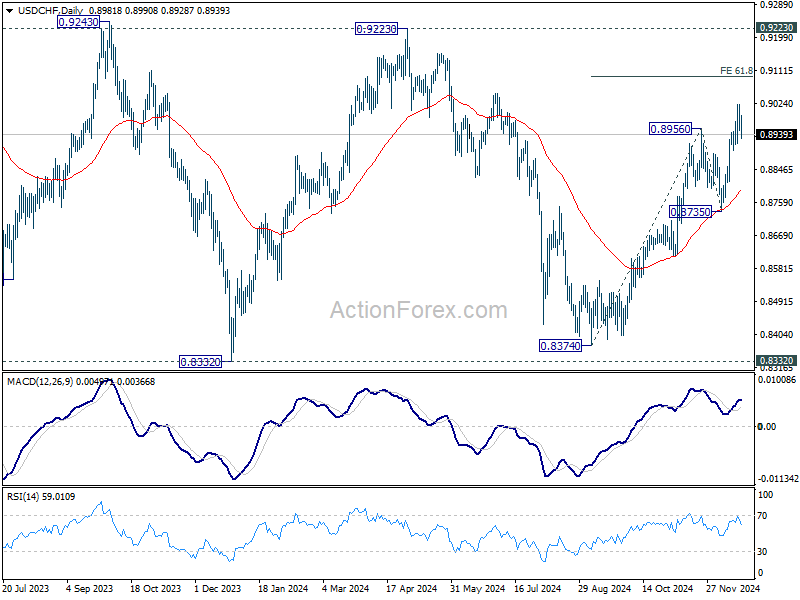
USD/CHF Mid-Day Outlook
Daily Pivots: (S1) 0.8951; (P) 0.8990; (R1) 0.9027; More…
Intraday bias in USD/CHF remains neutral for consolidations below 0.9020 temporary top Some more consolidations could be seen but further rally is expected as long as 0.8735 support holds. On the upside, break of 0.9020 will resume the rally from 0.8374. Next target will be 61.8% projection of 0.8374 to 0.8956 from 0.8735 at 0.9095.
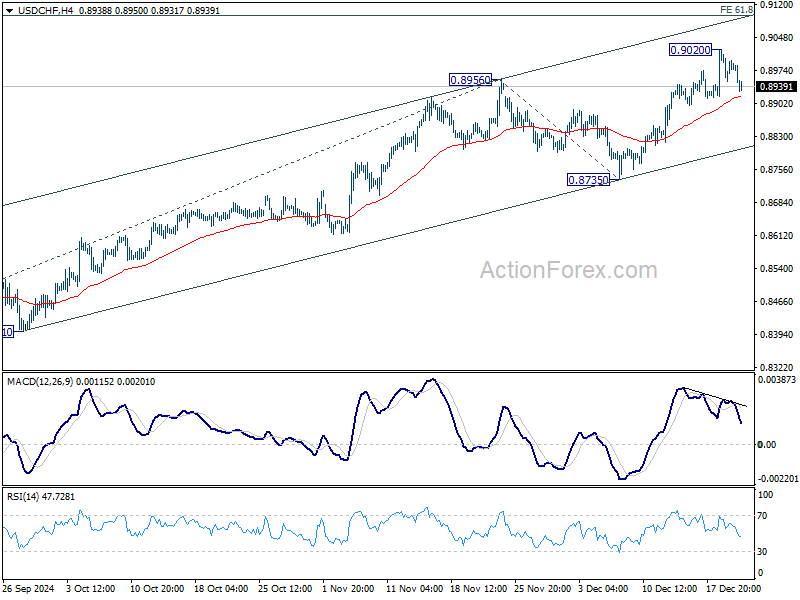
In the bigger picture, price actions from 0.8332 (2023 low) are currently seen as a medium term corrective pattern, with rise from 0.8374 as the third leg. Overall outlook will continue to stay bearish as long as 0.9223 resistance holds. Break of 0.8332 low is in favor at a later stage when the consolidation completes.
Sunset Market Commentary
Markets
A looming US government shutdown starting as soon as tonight is capturing market and media attention. Policymakers had agreed on a bipartisan deal to fund spending through March 24. Enter Trump and Musk. Both urged Republicans to kill the deal, a.o. because it didn’t raise the debt ceiling. Trump otherwise has to address the issue during his own tenure. A bill that did contain such a provision was also shot down a bit later by the Republican-led House as Democrats were opposed and 38 Republicans defected. While we think the economic impact of a government shutdown is contained, it’s an unwelcome layer of uncertainty for the likes of stock markets at the eve of holiday-thinned end-of-year trading. WS already lost up to 3.5% post-Fed and opened another 1% (Nasdaq) lower today. Core bonds gained with UST’s outperforming Bunds. US yields ease between 1.8 and 6.7 bps with the move lower compounded by a slight miss in the November PCE deflators. The headline index picked up by 0.1% m/m to 2.4% from 2.3% vs 2.5% expected. The core gauge missed the bar by a similar margin, adding 0.1% m/m to 2.8%. Adding to the momentum, personal income and spending also printed a sub-consensus 0.3% and 0.4% m/m. Some Fed members came to the fore in the wake of Wednesday’s policy meeting. SF’s Daly said the economy is in a good place and is very comfortable with the projection of two rate cuts next year. She added that the rate decision two days ago was a close call. Vice chair Williams welcomed the “sizeable movement down in inflation over the past two years” but stressed the ongoing need to be data dependent in adjusting policy. He revealed himself as being one of the group that took into account some of Trump’s expected policies on trade and immigration. Cleveland’s Hammack dissented on Wednesday, calling for a status quo. She explained today she preferred to see more progress on prices before cutting again. Rates should stay high enough to modestly restrict activity “for some time”. JPY and CHF outperform against the backdrop of risk aversion. That said, the euro does gain against USD. EUR/USD rises towards 1.04. Sterling erased earlier losses following disappointing retail sales to trade unchanged at 0.828.
News & Views
The Czech National Bank kept its policy rate unchanged at 4% yesterday in a 5-2 vote, pausing the rate cut cycle which started in December of last year. The dovish wing of the board perceives stronger anti-inflationary risks associated with the weaker performance of the global and German economies. The hawkish wing referred to increased inflation momentum in services and faster wage growth. Governor Michl said that rates still remain at restrictive levels and that the board will decide at its next meetings whether to cut them or leave them unchanged. We err on the side of two more 25 bps moves in February and March. Meeting minutes, new inflation numbers (Jan 13), the preliminary Q4 GDP estimate (Jan 31) and CNB communication should provide more clarity from the beginning of next year. EUR/CZK holds withing the trading place between roughly 25 and 25.50 in place since the start of July.
The EC and Switzerland confirmed the completion of negotiations of a broad package of agreements that aim to deepen and expand the EU-Switzerland relationship. It includes an update of five agreements which already give Switzerland access to the EU internal market – air transport, land transport, the free movement of persons, conformity assessment and trade in agricultural products. Each agreement will reflect the evolution of EU legislation in the area concerned and will ensure it is updated dynamically. The agreements will include dispute resolution provisions and State aid disciplines will apply where relevant.
U.S. Personal Income Growth Continues, While Spending Picks Up Pace in November
Personal income grew 0.3% month-on-month (m/m) in November, a deceleration relative to October's outsized 0.7% gain. Personal income is 5.3% higher than 12 months ago, well above the pace of inflation.
Accounting for inflation and taxes, real personal disposable income grew 0.2% m/m, slower than the 0.5% pace in the prior month.
Spending remained robust, increasing 0.4% on the month, and was up 5.5% from a year ago.
Stripping out inflation, spending volumes grew 0.3% – an acceleration relative to the 0.1% gain recorded in October. Spending on goods picked up steam (+0.7%), led by higher outlays on vehicles and parts and recreational goods, while spending on services was little changed (+0.1%).
Inflationary pressures eased off in November. The Fed's preferred inflation metric, the core PCE price deflator, rose 0.1% m/m, less than the 0.3% m/m increase seen in October. Year-over-year, core PCE inflation was 2.8% in November, unchanged from the prior month.
With spending outpacing income growth, the personal savings rate edged lower in November, declining to 4.4% down from 4.5% in October.
Key Implications
Consumers kept their purse strings open last month, and it seems that many were on the lookout for new car. This could partially reflect the post-hurricane replacement demand. For the fourth quarter a whole, consumer spending looks to increase by 3%, only a small downshift from 3.5% pace seen in Q3. Looking at the year as whole, U.S. consumers are finishing 2024 in strong financial shape thanks to wealth gains in equity markets and continued job gains. As a result, spending growth outpaced income for much of this year (with October being a notable exception).
Looking ahead to next year, we expect consumer spending to moderate to a trend-like pace of 2% (forecast) as job growth continues to slow, while inflation remains elevated. Strong gains in household wealth represent an upside risk to our outlook as consumers could lean on it next year as job growth moderates.
Canada: Retail Sales Enter Holiday Season on a Solid Footing
Retail sales rose by a solid 0.6% month-over-month (m/m) in October, slightly below Statistics Canada's advance estimate of 0.7% m/m.
In real terms, however, sales were unchanged.
Sales at motor vehicle and parts dealers accelerated by 2.0% m/m, reversing September's losses. Ex-autos, sales were up 0.1% m/m, falling short of the consensus expectation of 0.4% m/m growth.
Receipts at gas stations and fuel vendors declined by 0.2% m/m in nominal terms and by a sharper 4.7% m/m in real terms.
Excluding both auto sales and gas station receipts, core retail sales rose by 0.2% m/m in October, following an upwardly revised increase of 1.6% m/m in September (previously reported as +1.4% m/m).
Core sales were supported by increases in miscellaneous store retailers (+1.5% m/m) and clothing and clothing accessories stores (+1.2% m/m), and furniture, home furnishings, electronics and appliances retailers (+0.3% m/m). However, declines in food and beverage stores (-0.7% m/m) offset some of these gains.
E-commerce sales rose by 1.5% m/m, building on the 3.3% growth recorded in the previous month.
Statistics Canada's advance estimate for November suggests that sales were unchanged.
Key Implications
Canadians embraced the festive spirit in October, with spending gaining momentum as the official retail holiday season got underway. While the advance estimate for November suggests some softening, the GST holiday is expected to ring in stronger sales for December, giving retail cash registers a boost.
With inflation back at target, the three month average real retail sales per capita trend - a key indicator of purchasing power and consumer activity - posted growth for the second consecutive month. We forecast real personal consumption expenditure to grow at a tad above-trend pace of 1.9% annualized in Q4.
US PCE inflation ticks up to 2.4% yoy, core unchanged at 2.8% yoy
US headline PCE price index rose 0.1% mom in November, below expectation of 0.2% mom. Core PCE price index (excluding food and energy) also rose 0.1% mom, below expectation of 0.2% mom. Prices for goods increased less than 0.1% mom and prices for services increased 0.2% mom. Food prices increased 0.2% mom and energy prices also increased 0.2% mom.
From the same month one year ago, headline PCE index ticked up from 2.3% yoy to 2.4% yoy, below expectation of 2.5% yoy. Core PCE was unchanged at 2.8% yoy, below expectation of 2.9% yoy. Prices for goods decreased -0.4% yoy and prices for services increased 3.8% yoy. Food prices increased 1.4% yoy and energy prices decreased -4.0% yoy.
Personal income rose 0.3% mom or USD 71.1B, below expectation of 0.4% mom. Personal spending rose 0.4% mom or USD 81.3B. below expectation of 0.5% mom.
Canada’s retail sales rises 0.6% mom in Oct, unchanged in Nov
Canada's retail sales rose 0.6% mom to CAD 67.6B in October, above expectation of 0.4% mom. Sales were up in five of nine subsectors and were led by increases at motor vehicle and parts dealers.
Core retail sales—which exclude gasoline stations and fuel vendors and motor vehicle and parts dealers—were up 0.2% mom.
In volume terms, retail sales were unchanged.
Advance information suggests that sales were relatively unchanged in November.
WTI Oil Drifts Lower But Strong Support Below
- WTI Oil continues to trade sideways, but bias is bearish
- Price remains constrained between key resistance and support levels
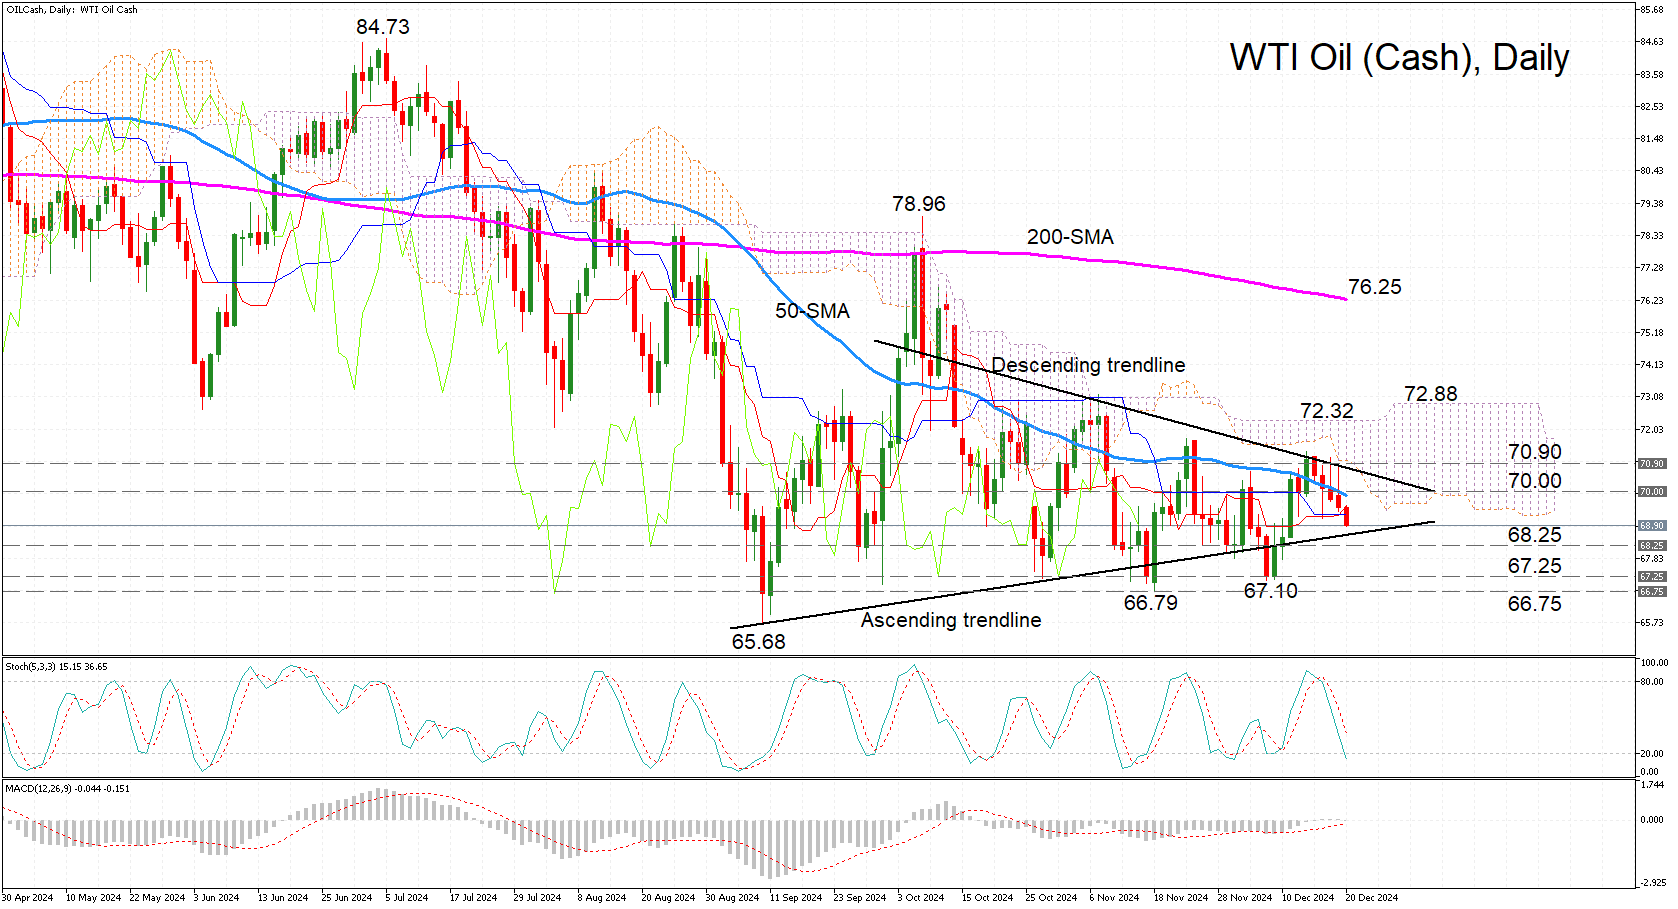
WTI Oil (Cash) is headed for a fifth straight day of declines, slipping below 69.00 and widening the gap with the Ichimoku cloud. The technical indicators are bearish, but to a varying extent. The stochastic oscillator is diving towards the oversold region, suggesting that an upside correction could be on the cards soon. However, the MACD is only marginally negative and remains above its red signal line, pointing to some bullish support as well as scope for greater losses.
In the immediate term, the main challenge for the bears is the ascending trendline that stands ready to defend the price at 68.60. But the fight doesn’t stop there. The 68.25, 67.25 and 66.75 regions have acted as strong barriers over the past few months. If these fail, the final test will be the September low of 65.68. Breaching this too would signal the resumption of the longer-term downtrend.
To the upside, the 50-day simple moving average (SMA) just below the 70.00 mark is the first major hurdle for the bulls. Higher up, the descending trendline and the bottom of the Ichimoku cloud pose a problem in the 70.90 zone. But for any positive momentum to gain traction, the price would need to climb above the shifting cloud tops of 72.32 and 72.88, before setting sights on the 200-day SMA around 76.25. However, for a stronger confirmation of a switch to a bullish outlook, the price needs to additionally surpass the October high of 78.96.
But for now, further consolidation is likely in the coming sessions.
Nasdaq 100 Technical: At Risk of Staging a Multi-Week Corrective Decline
- A transition from a Fed “dovish pivot” to a “normalization” pivot may put a halt to this year-end seasonal “Santa Rally” on the US stock indices.
- Nasdaq 100 momentum and market breadth have weakened which supports a potential medium-term (multi-week) corrective decline sequence.
- Watch the 20,790 downside trigger level of the Nasdaq 100.
The Nasdaq 100 has reversed its bullish momentum where at the start of this week, it was the sole major US benchmark stock index to print a fresh all-time high of 22,133 on Monday, 16 December.
The ex-post release of the US Federal Reserve monetary policy’s latest “dot plot” and Fed Chair Powell’s press conference on Wednesday, 18 December, have spooked the US stock market. The Fed has indicated the prospect of lesser interest rate cuts in 2025 due to the risk of inflationary pressure resurgence (some Fed officials have taken into account the effects of the incoming Trump administration’s “America First” policy).
The heightened prospect of a transition from a Fed “dovish pivot” to a “normalization” pivot in 2025 is likely the narrative at this juncture that may dim the hopes of the seasonal “Santa Rally” for this year-end.
The higher beta Nasdaq 100 recorded a loss of 4% from 18 December to 19 December (open to close) ex-post FOMC, the second worst performer among the four major US stock indices; Russell 2000 (-5.3%), S&P 500 (-3%), Dow Jones Industrial Average (-2.6%).
Several technical elements have now flashed out an increasing odd of a medium-term (multi-week) correction on the Nasdaq 100
Weak market breadth
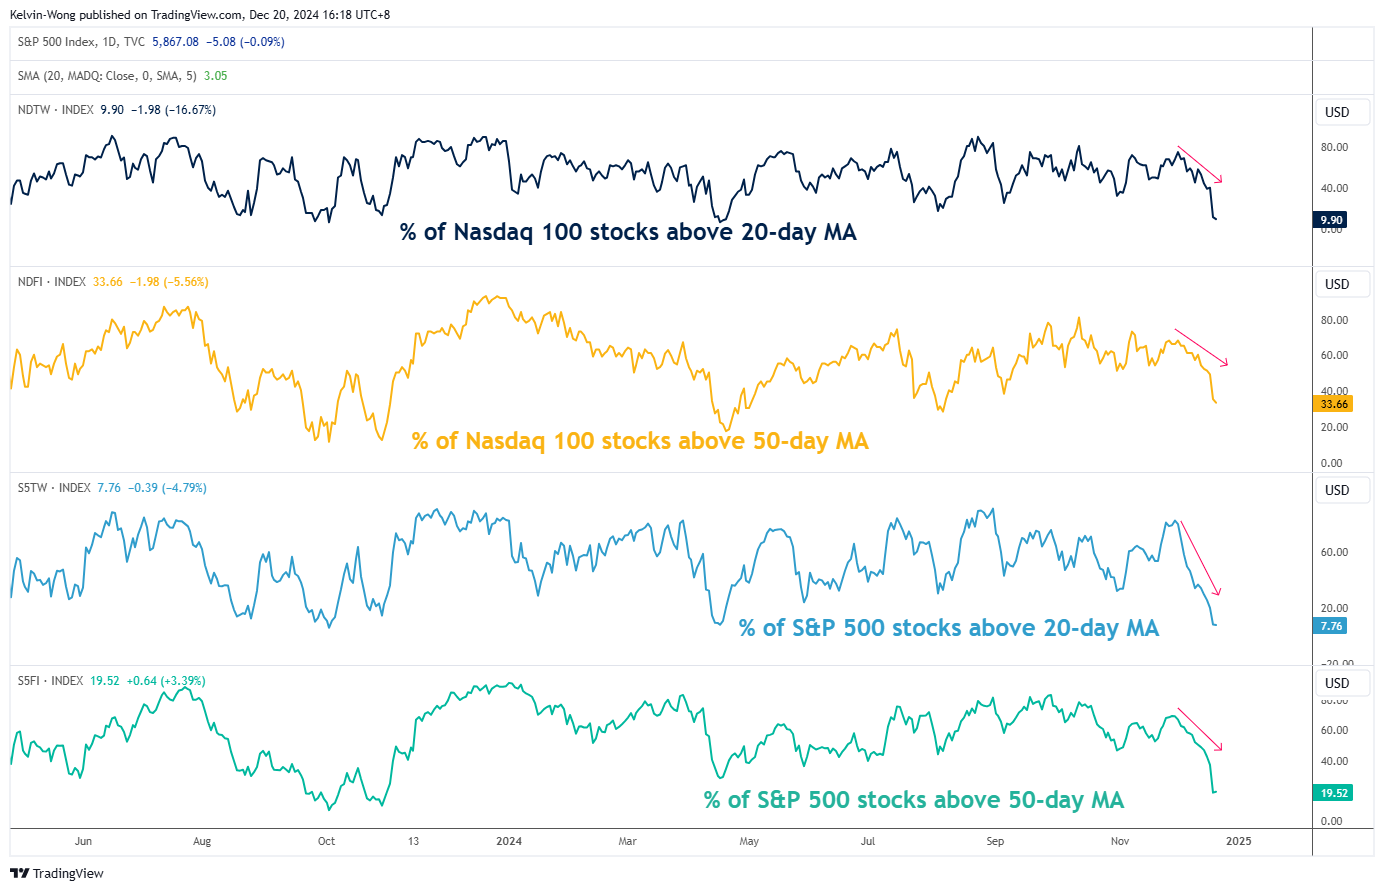
Fig 1: Percentage of Nasdaq 100 and S&P 500 component stocks above 20-day & 50-day moving averages as of 19 Dec 2024 (Source: TradingView, click to enlarge chart)
Since the start of December 2024, the percentage of Nasdaq 100 component stocks trading above their respective 20-day and 50-day moving averages has fallen. In contrast, the price actions of the Nasdaq 100 have kept rocketing upwards to print record highs in the recent two weeks.
Right now, the percentage of Nasdaq 100 component stocks trading above their respective 20-day moving averages have plummeted to 9.9% as of 19 December. Also, the Nasdaq 100 component stocks above their respective 50-day moving averages have declined to 33.7% (see Fig 1).
20,790 is the last line of defense for the Nasdaq 100
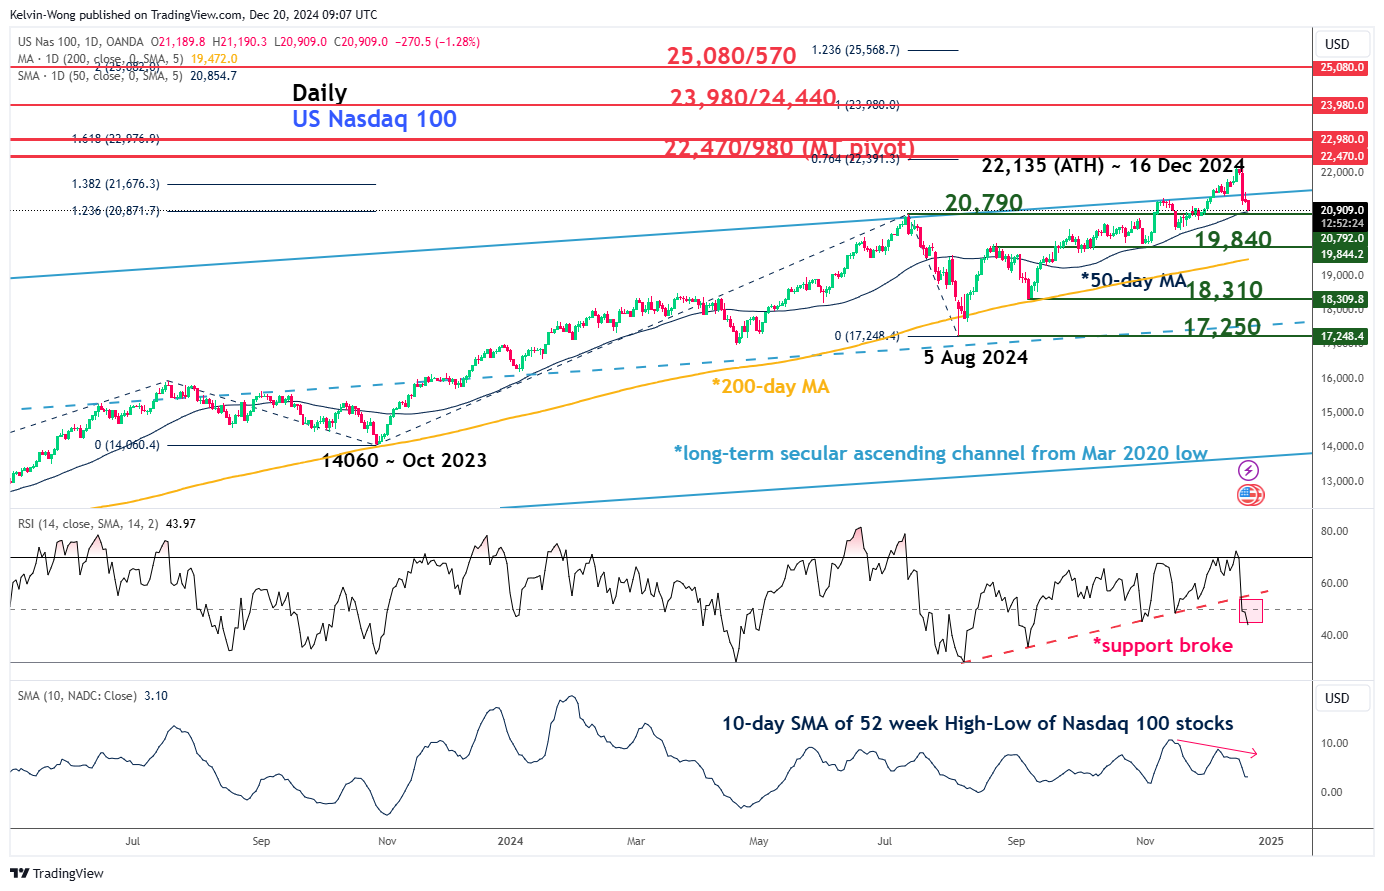
Fig 2: Nasdaq 100 CFD major & medium-term trends as of 20 Dec 2024 (Source: TradingView, click to enlarge chart)
The recent past three days of price actions of the Nasdaq 100 CFD Index (a proxy of Nasdaq 100 E-mini futures have reintegrated below the upper boundary of its long-term secular ascending channel from the March 2020 low. This observation suggests the bullish breakout seen on 4 December is a failure acceleration move.
Since its all-time high on 16 December, it has declined by 5.5%. It is now hovering right above its 50-day moving average, which is acting as key intermediate support at 20,790.
The latest reading seen from the daily RSI momentum indicator suggests that the 20,790 key intermediate support is likely to be a “weak support” as the RSI has broken below a parallel ascending trendline support and breached below the 50 level that indicates a revival of medium-term bearish momentum (see Fig 2).
In addition, fewer Nasdaq 100 component stocks managed to record new 52-week highs since 14 November 2024 as the 10-day moving average of the difference between new 52-week highs minus 52-week lows has shaped a lower high.
Hence, a break with a daily close below the 20,790 key intermediate support may trigger a multi-week corrective decline sequence to expose the medium-term supports of 19,840 and 18,310 in the first step.
On the other hand, clearance above the 22,470/980 medium-term pivotal resistance zone invalidates the bearish scenario for the continuation of its impulsive upmove sequence for the next medium-term resistances to come in at 23,980/24,440 and 25,080/570.
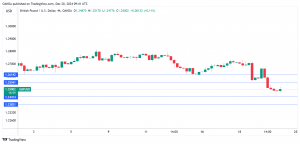
British Pound Stabilizes as Retail Sales Edge Up
The British pound has steadied on Friday, after sliding 1.6% in the past two days. In the European session, GBP/USD is trading at 1.2510, down 0.10% on the day at the time of writing.
Retail sales point to weak Christmas spending
UK retail sales posted a small gain of 0.2% m/m in November. This was a rebound from the 0.7% decline in October but missed the market estimate of 0.5%. Retail sales growth was hampered by weak clothing sales, which fell to their lowest volume since January 2022, as well as the wet weather. Annually, retail sales rose 0.5%, following a downwardly revised 2% gain in October and below the market estimate of 0.8%.
The weak retail sales report indicate that consumers are being cautious during the key Christmas shopping period, which is dampening economic activity. The ‘tax and spend’ Autumn budget hasn’t improved consumer confidence, as consumers remain squeezed by high prices and elevated interest rates.
UK inflation rose to 2.6% y/y in November from 2.3% a month earlier. This was an eight-month high and has raised concerns that the economy will enter a “stagflation” phase in the new year, which is marked by low growth and high inflation. The economy has contracted for two straight months and the Bank of England is projecting that inflation will keep rising and moved closer to 3% in 2025.
The BoE maintained the cash rate at 4.75% on Thursday, as expected. The BoE monetary policy summary said that policy would need to remain restrictive until the upside risk to inflation had eased and that the central bank would take a “gradual” approach to easing policy. This could mean a rate cut at the next meeting in February, but that would be contingent on inflation moving lower, closer towards to BoE 2% inflation target.
GBP/USD Technical
- There is resistance at 1.2554 and 1.2614
- 1.2442 and 1.2382 are the next support levels
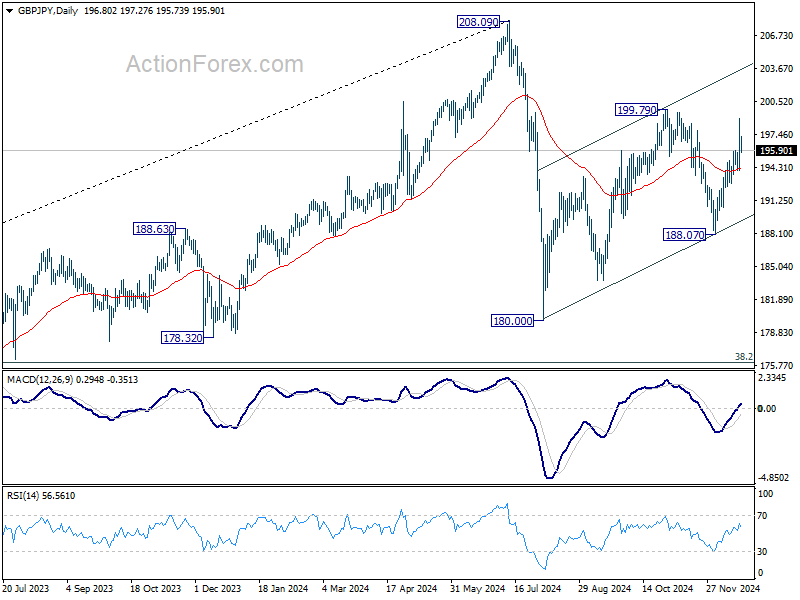
GBP/JPY Daily Outlook
Daily Pivots: (S1) 194.27; (P) 196.61; (R1) 199.16; More...
GBP/JPY retreated ahead of 199.79 resistance and intraday bias is turned neutral first. Further rally will remain in favor as long as 194.04 support holds. Corrective pattern from 180.00 is extending, and break of 199.79 will target channel resistance (now at 202.84).
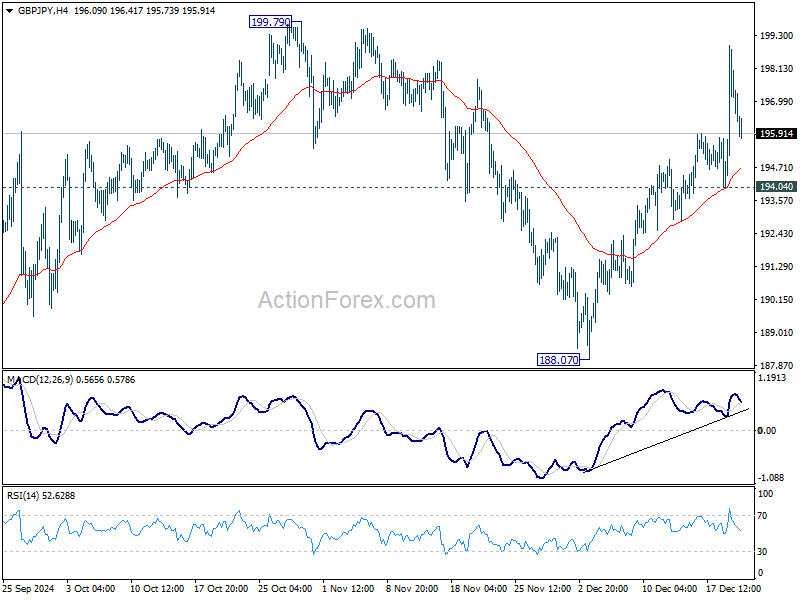
In the bigger picture, price actions from 208.09 are seen as a correction to whole rally from 123.94 (2020 low). The range of consolidation should be set between 38.2% retracement of 123.94 to 208.09 at 175.94 and 208.09. However, decisive break of 175.94 will argue that deeper correction is underway.